HAL Id: hal-01394731
https://hal.archives-ouvertes.fr/hal-01394731
Submitted on 9 Nov 2016
HAL is a multi-disciplinary open access
archive for the deposit and dissemination of
sci-entific research documents, whether they are
pub-lished or not. The documents may come from
teaching and research institutions in France or
abroad, or from public or private research centers.
L’archive ouverte pluridisciplinaire HAL, est
destinée au dépôt et à la diffusion de documents
scientifiques de niveau recherche, publiés ou non,
émanant des établissements d’enseignement et de
recherche français ou étrangers, des laboratoires
publics ou privés.
Climate change and the ash dieback crisis
Eric Goberville, Nina-Coralie Hautekèete, Richard Kirby, Yves Piquot,
Christophe Luczak, Grégory Beaugrand
To cite this version:
Eric Goberville, Nina-Coralie Hautekèete, Richard Kirby, Yves Piquot, Christophe Luczak, et al..
Climate change and the ash dieback crisis. Scientific Reports, Nature Publishing Group, 2016, 6,
pp.35303. �10.1038/srep35303�. �hal-01394731�
www.nature.com/scientificreports
Climate change and the ash dieback
crisis
Eric Goberville
1,2,3, Nina-Coralie Hautekèete
1, Richard R. Kirby
4, Yves Piquot
1,
Christophe Luczak
2,5& Grégory Beaugrand
2,3Beyond the direct influence of climate change on species distribution and phenology, indirect effects may also arise from perturbations in species interactions. Infectious diseases are strong biotic forces that can precipitate population declines and lead to biodiversity loss. It has been shown in forest ecosystems worldwide that at least 10% of trees are vulnerable to extinction and pathogens are increasingly implicated. In Europe, the emerging ash dieback disease caused by the fungus
Hymenoscyphus fraxineus, commonly called Chalara fraxinea, is causing a severe mortality of common
ash trees (Fraxinus excelsior); this is raising concerns for the persistence of this widespread tree, which is both a key component of forest ecosystems and economically important for timber production. Here, we show how the pathogen and climate change may interact to affect the future spatial distribution of the common ash. Using two presence-only models, seven General Circulation Models and four emission scenarios, we show that climate change, by affecting the host and the pathogen separately, may uncouple their spatial distribution to create a mismatch in species interaction and so a lowering of disease transmission. Consequently, as climate change expands the ranges of both species polewards it may alleviate the ash dieback crisis in southern and occidental regions at the same time.
Disease alters ecosystems and can trigger biodiversity loss1,2. Recently, the frequency and magnitude of disease
has been shown to be affected by climate change and related extreme events3,4, and forest ecosystems are no
exception1,5. For example, in North Africa, the severe mortality of Atlas cedar (Cedrus atlantica) was brought
about by a combination of a period of exceptional drought accompanied by fungal and insect injuries5. At least
10% of the world’s tree species are now vulnerable to disease, decline or extinction and pathogens are increasingly implicated6. Emerging infectious diseases are not a new concern7 but all evidence points towards an increase in
the amount of disease and extinction events driven by fungi7,8.
In Europe, the common ash is currently threatened across most of its distributional range by a new lethal disease known as ‘Chalara dieback of ash’ that is caused by the ascomycete Hymenoscyphus fraxineus9. Ash
die-back disease affects trees at various ages6,10 and, after first reports in Poland in the early 1990s, it has spread
rap-idly across Central, Northern and Western Europe10–12. Although forest managers might be inclined to remove
infected trees13 or to abandon common ash planting, the economic value (e.g. common ash is estimated to make
£22m/year in the United Kingdom14) and ecological role10,11 of this species argue for optimising tree
reintroduc-tion programs10,11. A thorough understanding of the environmental factors that might influence the geographical
spread of the disease is therefore important. Here, we examine the potential influence of global climate change upon both the spatial distribution of common ash and its pathogen, and upon how these two species may interact in future.
Results and Discussion
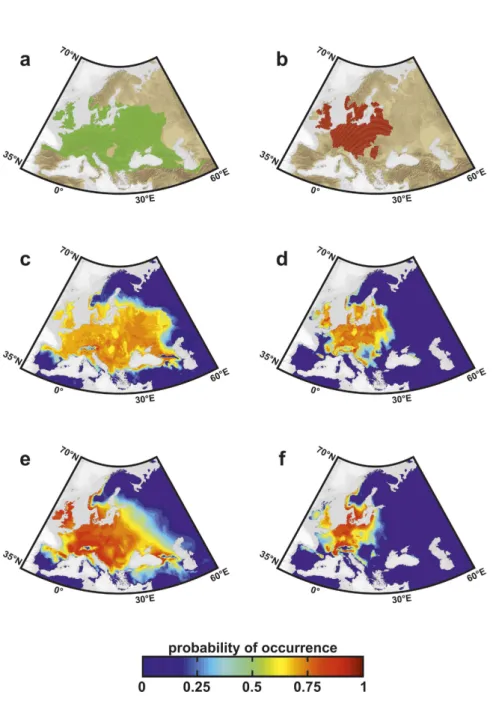
Common ash is widely distributed in Europe, ranging from the Atlantic coast to the Volga River in Russia (Fig. 1a); its northern limit occurs at ~64°N in Norway and its southern boundary is located at ~37°N and the environmental requirements of the species are well-known15,16. To estimate the spatial distribution of common
ash (Fig. 1a) and H. fraxineus (Fig. 1b), we selected presence-only methods and applied a Species Distribution Model (SDM), the Maximum Entropy algorithm (MaxEnt17), and an Ecological Niche Model (ENM), the 1Univ. Lille, CNRS, UMR 8198, Evo-Eco-Paleo, F-59 000 Lille, France. 2CNRS, Univ. Lille, Univ. Littoral Côte d’Opale,
UMR 8187, LOG, Laboratoire d’Océanologie et de Géosciences, F-62 930 Wimereux, France. 3Sir Alister Hardy
Foundation for Ocean Science, The Laboratory, Citadel Hill, Plymouth PL1 2PB, UK. 4Marine Biological Association,
Citadel Hill, The Hoe, Plymouth PL1 2PB, UK. 5Université d’Artois, ESPE, Centre de Gravelines, 40 rue Victor Hugo - BP
129, 59820 Gravelines, France. Correspondence and requests for materials should be addressed to E.G. (email: eric. [email protected]) or G.B. (email: [email protected])
received: 07 March 2016 Accepted: 28 September 2016 Published: 14 October 2016
OPEN
www.nature.com/scientificreports/
Non-Parametric-Probabilistic-Ecological-Niche model (NPPEN18). The bioclimatic parameters were derived
from the Climate Research Unit dataset (Supplementary Table S1). The consistency between simulated con-temporary occurrences and species observations (Fig. 1) was assessed by calculating the area under the curve (AUC) and the true skill statistic (TSS). Our results revealed that both models showed high ability to reproduce the overall species distributions; AUC values were as high as 0.96 and TSS values ranged from 0.83 and 0.92 (Supplementary Table S2). Although MaxEnt reproduces the contemporary spatial distribution of the host and its pathogen slightly better, the two models showed comparable estimates of contemporary geographical extent (Supplementary Table S2). Our projections (Fig. 1c,e) confirmed that the spatial distribution of common ash is constrained by aversion to cold winters and hot dry summers10,15. The European distribution of the pathogen was
reproduced well by the two models and no occurrence of H. fraxineus was predicted in regions where ash was not reported (Fig. 1b,d,f).
Figure 1. Observed and modelled spatial distributions of common ash and its pathogen. Observed distribution of (a) common ash (1950–2008) and (b) H. fraxineus (1992–2009) and modelled spatial distribution (as probability of occurrence) of (c,e) common ash and (d,f) H. fraxineus calculated from (c,d) MaxEnt and (e,f) NPPEN. Maps were produced using ArcGIS software v.10 (Environmental Systems Research Institute, Redlands, California, USA; http://www.esri.com/).
www.nature.com/scientificreports/
Recent phylogenetic analyses of H. fraxineus suggest an Asian origin for this ascomycete, however9,19. As
the fungus has only been reported in a few places in Japan, Korea, China and Far East Russia (Supplementary Figure S1) we did not consider its native range to determine its ecological niche but its European invasive range (Fig. 1b). Among the environmental factors that most seriously affect the initiation and development of diseases, it is well documented that temperature is critical1,5,20,21. Hymenoscyphus fraxineus is a cold-tolerant-organism,
with an optimal temperature at around 20–22 °C and no fungal growth takes place above 28 °C (refs 22–24). Using a model based on the physiological tolerances of H. fraxineus to temperature (Supplementary Figure S3), we evaluated whether all suitable thermal habitats in Europe have already been colonised by the pathogen. This analysis revealed that the pathogen is close to equilibrium with its climate in southern Europe. Although the pathogen might be more widespread than observed in Scandinavia and in Baltic States, the thermal niche of
H. fraxineus (Fig. 2), occurrence data (Fig. 1b) and simulations calculated with MaxEnt and NPPEN (Fig. 1d,f)
suggested unsuitable warm climatic conditions in western and southern regions23,25, which is also corroborated
by multi-model and spatially explicit approaches12.
Change in the spatial distribution of common ash and its pathogen under future climates was investigated using ‘Representative Concentration Pathways’ (RCPs) scenarios26. The pathogen-host interaction was modelled
by constraining the distribution of common ash by the presence of H. fraxineus, a common approach to incor-porate biotic interactions at large spatial extents27,28. Both models revealed a positive effect of climate upon the
geographical extent of common ash and this was also frequently combined with a reduction in pathogen preva-lence (Fig. 3) in relation to the different levels of warming (Supplementary Figure S5). The percentage of increase in the geographical extent of common ash also depended on the magnitude of warming. For Scenario RCP2.6, the spatial area covered by common ash (excluding the fungus) was predicted to increase from 1 to 10% over the 21st century (Fig. 3a,b). The coverage of the pathogen rose after an initial decrease although remaining frequently
negative (from − 16% to + 6%). When the interactive effect between the tree and its pathogen was taken into account, the combined effect translated into an increase in the geographical extent of the tree ranging from 15 to 30% (Fig. 3a,b). For Scenario RCP4.5, the climatic effect on common ash was higher in magnitude (from 2–17%) whilst changes in H. fraxineus were similar to those expected with RCP2.6 (from − 14% to + 6%; Fig. 3c,d). Consequently, both models projected an increase in common ash when the influence of the fungus was consid-ered (> 50% with MaxEnt and > 35% with NPPEN for 2080–2099). For Scenario RCP6.0, the influence on the tree was similar to that observed for a lower level of warming but strongly negative for the pathogen (Fig. 3e,f). From 2050, a reduction between 20–37% of H. fraxineus was observed. When the interactive effect of the pathogen was included, both models projected an increase greater than 40% in the geographical extent of common ash at the end of the century (Fig. 3e,f). For Scenario RCP8.5, the climatic effect on the tree remained highly positive (from 17–26% from 2050) although a plateau was observed with NPPEN from 2060 (Fig. 3g,h). Although occurring later with MaxEnt, the two ecological models projected a pronounced reduction in the pathogen (~50% for the last decade) and revealed the major impact of high temperature on the viability and growth of H. fraxineus22–24.
When the pathogenic influence was considered, changes in common ash varied in both direction and magnitude, and plateaued from 2060 with NPPEN. Consequently, the maximum gain was obtained with MaxEnt for the last decades (> 70% compared to > 45% with NPPEN).
We investigated changes in the spatial distribution of the host and its pathogen associated with global cli-mate change by averaging species projections resulting from the 7 GCMs for each RCP scenario for the period 2080–2099 (Figs 4 and 5). Spatial changes in species distribution were drastic for H. fraxineus for both ecological models even for small degrees of warming (Fig. 4b versus Fig. 5b); in particular, the pathogen was projected to disappear from France especially because of unsuitable warm climatic conditions which alter the spread of Figure 2. Modelled spatial distributions of Hymenoscyphus fraxineus. Modelled spatial distribution (as probability of occurrence) of H. fraxineus calculated from a model based on the physiological tolerances of
H. fraxineus to temperature using the limits defined by Hauptman et al.23 (see Supplementary Figure S3). Map
www.nature.com/scientificreports/
infectious diseases1,5,20,21 (Supplementary Figure S5). For Scenarios RCP2.6 and RCP4.5, both direct and indirect
effects of climate change fragmented the spatial range of common ash (Figs 4c and 5c). When global warming was pronounced (RCP6.0 and RCP8.5) both MaxEnt and NPPEN indicated there would be a major poleward move-ment of the pathogen, with populations only persisting in Scandinavia and the Baltics. The occidental common ash populations were only slightly affected when warming became too intense (Scenarios RCP6.0 and RCP8.5), especially for projections based on NPPEN (Fig. 4a versus Fig. 5a). Although the direct effect of climate on com-mon ash was negative in occidental and southern European countries (e.g. England, France or the Balkans), the virulence of the fungus is also expected to decrease in these areas. When host populations decline and fragment, Figure 3. Expected long-term changes in the spatial distribution of common ash and its pathogen using MaxEnt and NPPEN. Long-term quantitative changes (median and both first and third quartiles as shading) relative to 1992–2009 for H. fraxineus (in red), and common ash without (in green) and with (in blue) the interactive effect of H. fraxineus using (a,c,e,g) MaxEnt and (b,d,f,h) NPPEN for scenarios (a,b) RCP2.6, (c,d) RCP4.5, (e,f) RCP6.0 and (g,h) RCP8.5.
www.nature.com/scientificreports/
pathogens with density-dependent transmission face a lowered chance of infection29, and while the strength of
this positive feedback is difficult to evaluate in our study, it could reduce infection rates at the southern edge of common ash distribution but exacerbate infection at the centre of the spatial distribution of the tree29.
We realise that phenomenological models have a number of limitations. First, to model the ecological niche of both species, we had to assume that the contemporary distribution of common ash and its pathogen is in equi-librium with climate30. Although that assumption is likely to be correct for the pathogen, especially in southern
Europe (Fig. 2), the longevity of adult trees inevitably means they will persist for a while after unsuitable climatic conditions have appeared31,32. Second, we also assumed unlimited dispersal, which is unlikely to be the case for
common ash even though dispersal distances up to 3 kilometres have been recorded33; here, the main
conse-quence would be to anticipate too quickly the arrival of the tree to newly suitable areas. Third, our model does not consider either additional projected infestations (e.g. the Emerald Ash Borer34) or the effect of extreme climatic
events that may affect existing populations strongly4. For example, the extreme heat wave and drought during
Figure 4. Expected future spatial distribution of common ash and its pathogen calculated from MaxEnt. Projections of the averaged probability of occurrence of (a) common ash, (b) H. fraxineus and (c) common ash with consideration of the interactive effect of the pathogen (termed “common ash with H. fraxineus”) for 2080–2099 using scenarios RCP2.6, RCP4.5, RCP6.0 and RCP8.5. Maps were produced using ArcGIS software v.10 (Environmental Systems Research Institute, Redlands, California, USA; http://www.esri.com/).
www.nature.com/scientificreports/
summer 2003 triggered the collapse of Scot pine (Pinus sylvestris) populations in Southeastern France5. We also
do not consider possible variation in the susceptibility of different ash genotypes to H. fraxineus35 and we assume
ecological niche conservatism36, i.e. the niche shape remains unchanged over the study period. Unfortunately,
phenomenological models cannot consider processes of host-pathogen coevolution that may influence our results37,38. Despite those limitations, our study investigates a large range of scenarios using two presence-only
models (a SDM and an ENM), up to seven GCMs and four levels of warming and considers both direct and indi-rect (i.e. interactive effect of the pathogen) effects of climate change on common ash showing how climate change factors should at least be considered when planning ecosystem management.
Over the next decades, both climate change and disease are expected to affect forest ecosystems consider-ably3,6,39. Some diseases may be controlled by climate because both temperature and water availability govern
pathogen development10,11, host susceptibility10,11 and thereby disease-spreading1. Here, our study also reveals
that climate change, by affecting the host and the pathogen separately, may uncouple their spatial distributions, Figure 5. Expected future spatial distribution of common ash and its pathogen calculated from NPPEN. Projections of the averaged probability of occurrence of (a) common ash, (b) H. fraxineus and (c) common ash with H. fraxineus for 2080–2099 using scenarios RCP2.6, RCP4.5, RCP6.0 and RCP8.5. Maps were produced using ArcGIS software v.10 (Environmental Systems Research Institute, Redlands, California, USA; http://www. esri.com/).
www.nature.com/scientificreports/
involving a mismatch in the species’ interaction27 with putative consequences for density-dependent transmission29.
Consequently, although the direct effect of climate change upon common ash is expected to be negative in southern and occidental regions where warming might favour the extension of the Mediterranean ash F. angustifolia15, it may
at the same time alleviate the ash dieback crisis as climate change expands the ranges of both species polewards25.
Our study therefore reveals the complexity of biological pathways through which climate change may affect species and biotic interactions38–40. Distribution models could provide useful information to help design
rein-troduction programmes to better manage forest ecosystems41. While foresters are unwilling to invest in common
ash planting, our results show that it is too early to abandon its exploitation. However, it remains challenging to better document host-pathogen interactions1,3,40 and a deeper knowledge of the infection process would allow
us to refine modelling approaches10,11: landscape pathology would provide insights about dispersal ability of the
fungus42, genomic sequencing procedures would help to identify the origin of the disease19. Initiatives are already
ongoing to ensure the sustainability of common ash in Europe (e.g. the FRAXBACK COST action, Nornex) and will allow foresters to base conservation decisions not on instinctive reactions but instead on ecological scenarios41,43.
Methods
Biological Data.
The distribution map of common ash (Fraxinus excelsior) was downloaded from the EUFORGEN (European Forest Genetic Resources Programme) website (Fig. 1a; http://www.euforgen.org/distri-bution_maps.html). Because no comprehensive database on the spatial distribution of Hymenoscyphus fraxineus was available, we digitalised and compiled occurrence data from different recent maps found in the literature10,44,45to produce the most up-to-date distribution of the fungus (Fig. 1b) (see Supplementary Information for details).
Climatic Data.
We used the gridded Climatic Research Unit (CRU) TS (time-series) 3.10.01 climatic datasets provided by the Climate Research Unit46 and obtained from the British Atmospheric Data Centre (BADC; http://badc.nerc.ac.uk/). From monthly averages of minimum/maximum temperature and precipitation data over the period 1901–2009, a set of bioclimatic parameters was calculated (Supplementary Table S1) by applying the pro-cedure described by Ramirez-Villegas & Bueno-Cabrera47.
Modelling Procedure.
To estimate the spatial distribution of common ash and H. fraxineus, we selected two presence-only methods: the Maximum Entropy (MaxEnt) algorithm17 and the Non-Parametric-Probabilistic-Ecological-Niche (NPPEN) model18 (see SI Materials and Methods for further details). We selected
the most important bioclimatic parameters based on their relative contribution to the estimation of the spatial distribution of common ash and its pathogen (i.e. variables with a contribution of at least 5%) and possible col-linearity between predictors was evaluated by calculating pairwise correlation coefficients (see Supplementary Information, Supplementary Table S1 and Supplementary Figure S2). The following two sets of parameters were retained: (i) precipitation of the driest quarter, annual mean temperature, mean temperature of the coldest quarter and precipitation of the warmest quarter for common ash and (ii) annual temperature range, precipitation of the warmest quarter, mean temperature of the coldest quarter and maximum temperature of the warmest month for
H. fraxineus. The assumption of equilibrium between the fungus and climate was tested by performing a model
based on the physiological tolerances of H. fraxineus to temperature (Supplementary Figure S3) using the limits determined experimentally by Hauptman and colleagues (see Table 2, Figs 1 and 2 in their publication23). We
then estimated the direct influence of climate change on the spatial distribution of common ash and H. fraxineus and its indirect effects through pathogen-host interaction for eight 20-year periods (from 2010–2029 to 2080–2099) using the “Representative Concentration Pathways” (RCPs) climate scenarios, from the fifth phase of the Coupled Model Intercomparison Project (CMIP526). Seven different General Circulation Models (GCMs; see
Supplementary Table S3 for basic information) and the four greenhouse gas concentration emission scenarios were considered: RCP2.6, RCP4.5, RCP6.0 and RCP8.5 (from the most optimistic to the most pessimistic).
Pathogen-Host Interaction.
The pathogen-host interaction (termed ‘common ash with H. fraxineus’) was modelled by constraining the distribution of common ash by the presence of H. fraxineus, i.e. by calculating the differences in probability of occurrence between common ash and H. fraxineus in each geographical cell. This method is comparable to the one implemented by Schweiger and colleagues27,48 to assess butterfly distributionstaking into account the distribution of their larval host plants. Such an approach minimises potential modelling issues, especially when two species responds in a similar way to bioclimatic parameters28.
Quantification of Changes in the Geographical Extent of Species.
To quantify changes in the area covered by the common ash and its pathogen, we transformed probability of occurrence values into binary pre-dictions (i.e. presence/absence) using decision thresholds49 (Supplementary Table S2). For the period 1992–2009which corresponds to the observations of the fungus and each future time period, we calculated the area covered by the tree, the pathogen and the coverage of the common ash with H. fraxineus. For each presence-only model, each GCM and each RCP scenario, changes in the geographical extent of species relative to the period 1992–2009 were estimated in percentage. The same procedure was performed to evaluate changes in the geographical extent of the thermal niche of H. fraxineus (Supplementary Figure S5). For each simulation, the median, first and third quartiles were calculated to show the variability among GCMs (Fig. 3; Supplementary Table S4).
References
1. Harvell, C. D. et al. Climate warming and disease risks for terrestrial and marine biota. Science 296, 2158–2162 (2002). 2. Kuussaari, M. et al. Extinction debt: a challenge for biodiversity conservation. Trends Ecol Evol. 24, 564–571 (2009).
www.nature.com/scientificreports/
3. Altizer, S., Ostfeld, R. S., Johnson, P. T. J., Kutz, S. & Harvell, C. D. Climate change and infectious diseases: From evidence to a predictive framework. Science 341, 514–519 (2013).
4. Smith, M. D. An ecological perspective on extreme climatic events: a synthetic definition and framework to guide future research. J
Ecol. 99, 656–663 (2011).
5. Allen, C. D. et al. A global overview of drought and heat-induced tree mortality reveals emerging climate change risks for forests.
Forest Ecol Manag. 259, 660–684 (2010).
6. Jönsson, M. T. & Thor, G. Estimating coextinction risks from epidemic tree death: Affiliate lichen communities among diseased host tree populations of Fraxinus excelsior. Plos One 7, e45701 (2012).
7. Fisher, M. C. et al. Emerging fungal threats to animal, plant and ecosystem health. Nature 484, 186–194 (2012).
8. La Porta, N. et al. Forest pathogens with higher damage potential due to climate change in Europe. Can J Plant Pathol. 30, 177–195 (2008).
9. Baral, H.-O., Queloz, V. & Hosoya, T. Hymenoscyphus fraxineus, the correct scientific name for the fungus causing ash dieback in Europe. IMA Fungus 5, 79–80 (2014).
10. Pautasso, M., Aas, G., Queloz, V. & Holdenrieder, O. European ash (Fraxinus excelsior) dieback - A conservation biology challenge.
Biol Cons. 158, 37–49 (2013).
11. McKinney, L. V. et al. The ash dieback crisis: genetic variation in resistance can prove a long-term solution. Plant Pathol. 63, 485–499 (2014).
12. Dal Maso, E. & Montecchio, L. Risk of natural spread of Hymenoscyphus fraxineus with environmental niche modelling and ensemble forecasting Technique. Forest Res. 3, 131 (2014).
13. Horie, T., Haight, R. G., Homans, F. R. & Venette, R. C. Optimal strategies for the surveillance and control of forest pathogens: A case study with oak wilt. Ecol Econ. 86, 78–85 (2013).
14. Smith, C. et al. Chalara in ash trees: A framework for assessing ecosystem impacts and appraising options. ed Department for Environment FRA (2013).
15. Marigo, G., Peltier, J.-P., Girel, J. & Pautou, G. Success in the demographic expansion of Fraxinus excelsior L. Trees 15, 1–13 (2000). 16. Thomas, P. A. Biological Flora of the British Isles: Fraxinus excelsior. J. Ecol. 104, 1158–1209 (2016).
17. Phillips, S. J., Anderson, R. P. & Schapire, R. E. Maximum entropy modeling of species geographic distributions. Ecol Model 190, 231–259 (2006).
18. Beaugrand, G., Lenoir, S., Ibanez, F. & Manté, C. A new model to assess the probability of occurrence of a species based on presence-only data. Mar Ecol Prog Ser. 424, 175–190 (2011).
19. Cleary, M. et al. Friend or foe? Biological and ecological traits of the European ash dieback pathogen Hymenoscyphus fraxineus in its native environment. Sci Rep. 6, 21895 (2016).
20. Agrios, G. Significance of plant diseases. Plant pathol. 25–37 (1997).
21. Evans, N., Baierl, A., Semenov, M. A., Gladders, P. & Fitt, B. D. L. Range and severity of a plant disease increased by global warming.
J R Soc Interface 5, 525–531 (2008).
22. Kowalski, T. & Bartnik, C. Morphologial variation in colonies of Chalara fraxinea isolated from ash (Fraxinus excelsior L.) stems with symptoms of dieback and effects of temperature on colony growth and structure. Acta Agrobot 63 (2010).
23. Hauptman, T. et al. Temperature effect on Chalara fraxinea: heat treatment of saplings as a possible disease control method. Forest
Pathol. 43, 360–370 (2013).
24. Pham, T. L. H., Zaspel, I., Schuemann, M., Stephanowitz, H. & Krause, E. Rapid in-vitro and in-vitro detection of Chalara fraxinea by means of mass spectrometric techniques. Am J Plant Sci. 4, 444–453 (2013).
25. Gross, A., Holdenrieder, O., Pautasso, M., Queloz, V. & Sieber, T. N. Hymenoscyphus pseudoalbidus, the causal agent of European ash dieback. Mol Plant Pathol. 15, 5–21 (2014).
26. Stocker, T. F. et al. Climate change 2013: The physical science basis. Intergovernmental Panel on Climate Change, Working Group I
Contribution to the IPCC Fifth Assessment Report (AR5) (Cambridge Univ Press, New York, 2013).
27. Schweiger, O. et al. Increasing range mismatching of interacting species under global change is related to their ecological characteristics. Global Ecol Biogeogr. 21, 88–99 (2012).
28. Kissling, W. D. et al. Towards novel approaches to modelling biotic interactions in multispecies assemblages at large spatial extents.
J Biogeogr. 39, 2163–2178 (2012).
29. Phillips, B. L. et al. Parasites and pathogens lag behind their host during periods of host range advance. Ecology 91, 872–881 (2010). 30. Elith, J., Kearney, M. & Phillips, S. The art of modelling range-shifting species. Methods Ecol Evol. 1, 330–342 (2010).
31. Jump, A. S., Hunt, J. M. & Peñuelas, J. Rapid climate change-related growth decline at the southern range edge of Fagus sylvatica.
Glob Change Biol. 12, 2163–2174 (2006).
32. Aitken, S. N., Yeaman, S., Holliday, J. A., Wang, T. & Curtis-McLane, S. Adaptation, migration or extirpation: climate change outcomes for tree populations. Evol Appl 1, 95–111 (2008).
33. Bacles, C. F. E., Lowe, A. J. & Ennos, R. A. Effective seed dispersal across a fragmented landscape. Science 311, 628 (2006). 34. Valenta, V., Moser, D., Kuttner, M., Peterseil, J. & Essl, F. A high-resolution map of emerald ash borer invasion risk for Southern
Central Europe. Forests 6, 3075–3086 (2015).
35. Cleary, M. R. et al. Genotypes of Fraxinus excelsior with different susceptibility to the ash dieback pathogen Hymenoscyphus
pseudoalbidus and their response to the phytotoxin viridiol – A metabolomic and microscopic study. Phytochemistry 102, 115–125
(2014).
36. Crisp, M. D. et al. Phylogenetic biome conservatism on a global scale. Nature 458, 754–756 (2009).
37. Pritchard, L. & Birch, P. R. J. The zigzag model of plant-microbe interactions: is it time to move on? Mol Plant Pathol. 15, 865–870 (2014).
38. Wisz, M. S. et al. The role of biotic interactions in shaping distributions and realised assemblages of species: implications for species distribution modelling. Biol Rev. 88, 15–30 (2013).
39. Tylianakis, J. M., Didham, R. K., Bascompte, J. & Wardle, D. A. Global change and species interactions in terrestrial ecosystems. Ecol
Lett. 11, 1351–1363 (2008).
40. Van der Putten, W. H., Macel, M. & Visser, M. E. Predicting species distribution and abundance responses to climate change: why it is essential to include biotic interactions across trophic levels. Philos T Roy Soc B 365, 2025–2034 (2010).
41. Guisan, A. et al. Predicting species distributions for conservation decisions. Ecol Lett. 16, 1424–1435 (2013).
42. Pearson, R. G. et al. Life history and spatial traits predict extinction risk due to climate change. Nat Clim Change 4, 217–221 (2014). 43. Mills, P. et al. Integrating natural and social science perspectives on plant disease risk, management and policy formulation. Phil
Trans R Soc B 366, 2035–2044 (2011).
44. Bengtsson, S. B. K. Dieback of Fraxinus excelsior, biology of ash dieback and genetic variation of the fungus Hymenoscyphus
pseudoalbidus. Doctoral Thesis (Faculty of Natural Resources and Agricultural Sciences, Uppsala) (2013).
45. Bakys, R. Dieback of Fraxinus excelsior in the Baltic sea region, associated fungi, their pathogenicity and implications for silviculture. Doctoral Thesis (Faculty of Natural Resources and Agricultural Sciences Uppsala) (2013).
46. Harris, I., Jones, P. D., Osborn, T. J. & Lister, D. H. Updated high-resolution grids of monthly climatic observations - the CRU TS3.10 Dataset. Int J Climatol. 34, 623–642 (2013).
47. Ramírez-Villegas, J. & Bueno-Cabrera, A. Working with climate data and niche modeling: Creation of bioclimatic variables. Cali, Colombia, International Center for Tropical Agriculture (CIAT) (2009).
www.nature.com/scientificreports/
48. Schweiger, O., Settele, J., Kudrna, O., Klotz, S. & Kühn, I. Climate change can cause spatial mismatch of trophically interacting species. Ecology 89, 3472–3479 (2008).
49. Liu, C., Newell, G. & White, M. On the selection of thresholds for predicting species occurrence with presence-only data. Ecol Evol.
6, 337–348 (2015).
Acknowledgements
This work was part of the regional research projects ARCIR BioImpact 2011-11000922 and RETROSCEN 2012-12000625 (Nord – Pas-de-Calais) and was also supported by the “Centre National de la Recherche Scientifique” (CNRS). We thank the European Forest Genetic Resources Programme for providing the distribution map of common ash and the World Climate Research Programme’s Working Group on Coupled Modelling for CMIP5 data.
Author Contributions
E.G. and G.B. designed and performed research; E.G. compiled and analysed the data. E.G., G.B., N.-C.H., R.R.K., C.L. and Y.P. discussed the results and wrote the paper.
Additional Information
Supplementary information accompanies this paper at http://www.nature.com/srep Competing financial interests: The authors declare no competing financial interests.
How to cite this article: Goberville, E. et al. Climate change and the ash dieback crisis. Sci. Rep. 6, 35303; doi: 10.1038/srep35303 (2016).
This work is licensed under a Creative Commons Attribution 4.0 International License. The images or other third party material in this article are included in the article’s Creative Commons license, unless indicated otherwise in the credit line; if the material is not included under the Creative Commons license, users will need to obtain permission from the license holder to reproduce the material. To view a copy of this license, visit http://creativecommons.org/licenses/by/4.0/