HAL Id: hal-00303921
https://hal.archives-ouvertes.fr/hal-00303921
Submitted on 13 Jun 2005HAL is a multi-disciplinary open access
archive for the deposit and dissemination of sci-entific research documents, whether they are pub-lished or not. The documents may come from teaching and research institutions in France or abroad, or from public or private research centers.
L’archive ouverte pluridisciplinaire HAL, est destinée au dépôt et à la diffusion de documents scientifiques de niveau recherche, publiés ou non, émanant des établissements d’enseignement et de recherche français ou étrangers, des laboratoires publics ou privés.
Morphological, chemical and optical absorbing
characterization of aerosols in the urban atmosphere of
Valladolid
S. Mogo, V. E. Cachorro, A. M. de Frutos
To cite this version:
S. Mogo, V. E. Cachorro, A. M. de Frutos. Morphological, chemical and optical absorbing charac-terization of aerosols in the urban atmosphere of Valladolid. Atmospheric Chemistry and Physics Discussions, European Geosciences Union, 2005, 5 (3), pp.3921-3957. �hal-00303921�
ACPD
5, 3921–3957, 2005 SEM/EDX and Baof Valladolid aerosol S. Mogo et al. Title Page Abstract Introduction Conclusions References Tables Figures J I J I Back CloseFull Screen / Esc
Print Version Interactive Discussion
EGU
Atmos. Chem. Phys. Discuss., 5, 3921–3957, 2005 www.atmos-chem-phys.org/acpd/5/3921/
SRef-ID: 1680-7375/acpd/2005-5-3921 European Geosciences Union
Atmospheric Chemistry and Physics Discussions
Morphological, chemical and optical
absorbing characterization of aerosols in
the urban atmosphere of Valladolid
S. Mogo1,2, V. E. Cachorro1, and A. M. de Frutos1 1
Grupo de ´Optica Atmosf ´erica, Universidad de Valladolid, Valladolid, Spain
2
Dep. de F´ısica, Universidade da Beira Interior, Covilh˜a, Portugal
Received: 28 February 2005 – Accepted: 20 April 2005 – Published: 13 June 2005 Correspondence to: S. Mogo (smogo@dfisica.ubi.pt)
ACPD
5, 3921–3957, 2005 SEM/EDX and Baof Valladolid aerosol S. Mogo et al. Title Page Abstract Introduction Conclusions References Tables Figures J I J I Back CloseFull Screen / Esc
Print Version Interactive Discussion
EGU
Abstract
Aerosol samples were collected from the Valladolid (Spain) atmosphere during 2003– 2004 winter using a Dekati PM10 cascade impactor which allows to discriminate four level of particle sizes: greater than 10 µm, between 10 and 2.5, from 2.5 to 1 and less than 1 µm. The size and shape of the aerosol deposits were analyzed by means of
in-5
dividual particles through scanning electron microscope (SEM) technique. Additionally an energy dispersive X-ray analysis (EDX) was performed enabling elemental analysis of a large number of individual particles in a relatively short time. We present a classi-fication in size, shape and composition of the major particulate species present in the Valladolid urban atmosphere.
10
The aerosol concentration is very variable during winter, ranging from 39.86 µg·m−3 to 184.88 µg·m−3 with coarse particle as dominant fraction. Emphasize was given to fine particles, behind 1 µm, for which the visible (from 400 nm to 650 nm) light absorption coefficients were measured using the integrating plate technique.
We have made some enhancements relative to the illumination system in the well
15
known integrating plate method, for the absorption coefficients determination. The ab-sorption coefficient ranges from 7.33×10⁻⁶ m−1 to 1.01×10⁻⁴ m−1 for the 550 nm wavelength. Its visible spectrum decreases with wavelength with greater slope for greater σ values.
1. Introduction
20
The importance of aerosols was many times stressed in the last decades, where stud-ies of atmospheric contamination and air quality attained its greatest exponent (Willeke
and Baron,1993). In the last years great number of studies on aerosols have looked at the influence, or disturbance, that these originate on climate and climate change sce-narios through its contribution to the “radiative forcing” (Haywood and Boucher,2000;
25
ACPD
5, 3921–3957, 2005 SEM/EDX and Baof Valladolid aerosol S. Mogo et al. Title Page Abstract Introduction Conclusions References Tables Figures J I J I Back CloseFull Screen / Esc
Print Version Interactive Discussion
EGU
of aerosols is focused not only on those of anthropogenic origin but also on those of natural origin (desert or maritime...).
As it is well known the addition of scattering and absorption coefficients lead to the extinction coefficient and to the aerosols optical depth after vertical integration.
The knowledge of radiation scattering and absorptive properties of the atmospheric
5
aerosol is of utmost importance. Regardless of the huge number of studies about the radiative properties of aerosols, its net effect in the global warming is not yet very clear. The atmospheric aerosols can behavior as a factor of cooling or of warming, depending in what prevails (H ¨anel and Hillenbrand,1989;Wang,2004): the light absorption or the scattering (that is to say the single scattering albedo). Furthermore, the presence of
10
huge amounts of aerosol can also lead visibility conditions to very low levels. From here we can see the importance of knowing these coefficients that show in general a great spatial and temporal variability.
The scattering and absorption of light by particles depends, among other factors, of their elemental constitution. Nowadays sulphates are considered the main type
15
of aerosols responsible for a net cooling. They produce scattering of solar radiation and are very effective as cloud condensation nuclei, resulting in a negative radiative forcing that leads to a cooling of the Earth surface. On the other hand, soot, mainly constituted by carbon particles is considered the greater absorbent of solar radiation and has, therefore, a warming-up effect.
20
In this way, the studies of the aerosols composition should not be taken apart from the study of its optical and radiative characteristics.
Anthropogenic aerosols have generally their greater impacts on climate near their sources (Buseck and P ´osfai, 1999; Wang, 2004). Thus, this work is focused in the analysis of individual particles found in Valladolid urban atmosphere in order to
cat-25
egorize morphology and elemental constitution of its components, and also on the analysis of their absorbent characteristics, which are directly related with its elemental components and its range of sizes.
ACPD
5, 3921–3957, 2005 SEM/EDX and Baof Valladolid aerosol S. Mogo et al. Title Page Abstract Introduction Conclusions References Tables Figures J I J I Back CloseFull Screen / Esc
Print Version Interactive Discussion
EGU
took into account the results of the scanning electron microscopy and of the energy dispersive X-ray analysis. The scanning electron microscope provided high resolution pictures of the major types of particles composing the aerosol and the energy disper-sive X-ray analysis provided invaluable information about the aerosol composition. By this way the presented classification is simultaneously based on the chemical and
mor-5
phological characteristics of the aerosol leading to a better qualitative description of the atmospheric particles. Studies of aerosol particles properties using an analysis similar to that used in this work were successfully performed by other authors (Ramsden and
Shibaoka,1982;Buseck and P ´osfai,1999;McMurry et al.,1996).
2. Experimental
10
2.1. Sampling location and method
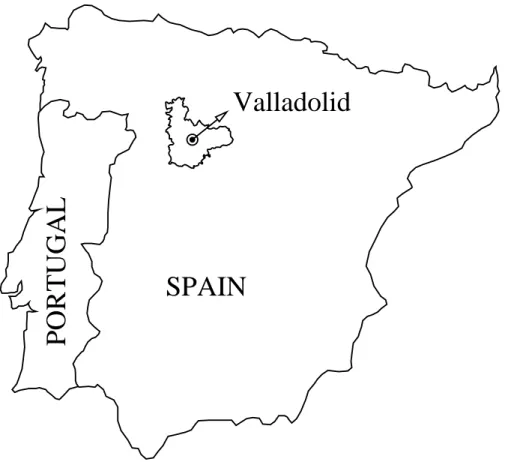
The particles used in this study were collected within the urban environment of Val-ladolid town, Spain (41.67◦ N, 4.74◦E), during an extended winter, December 2003 to March 2004. Valladolid is a medium size town with ≈500 000 inhabitants located in the north-center of the Iberian Peninsula with a continental climate (see Fig.1). It is the
15
biggest town of the extended region of “Castilla y Le ´on” which occupies the main part of north-center Spain. The type of surface that surround the city is basically rough bare and dry soil for agriculture use. The urban aerosol corresponds to a not very indus-trialized city, whose contamination is basically coming from road traffic and domestic heating, however, no emission sources inventory had been developed for this city. The
20
pollution levels are strongly dependent of the atmospheric synoptic conditions, in this case a long and cold winter, with frequent fog events. This fog events are due to the Pisuerga River Valley that crosses the city. The relative humidity goes from 83% in Jan-uary to 47% in July, annual mean is around 65%. Mean monthly precipitation varies from 56 mm in December to 16 mm in July, annual mean is 435 mm. The predominant
25
ACPD
5, 3921–3957, 2005 SEM/EDX and Baof Valladolid aerosol S. Mogo et al. Title Page Abstract Introduction Conclusions References Tables Figures J I J I Back CloseFull Screen / Esc
Print Version Interactive Discussion
EGU
NE (25%), SW (23%), N (20%) and S (10%). However, we must mention that there is ≈25% of calm wind days.
The sampling site was in the campus of the Valladolid University and the impactor was located on a little terrace on the second floor of the building of Sciences Faculty, ≈150 m from the nearest main road. The building has 4 floors which partially protects
5
the impactor from the wind when it comes from the south but we don’t consider this as relevant for our study. In spite of this, pollution from long range transport is linked with well defined synoptic situations (S ´anchez et al.,1990) which make quantifiable appor-tioning for two extreme situations: very clean, when air masses come from the Arctic and highly polluted, corresponding to the anticyclonic weather. Very peculiar and
ex-10
treme situations are given by desert dust intrusions over Spain (estimated about 5% of days per year) which originate the higher episodes of particulate matter concentration. A Dekati PM10 impactor collecting over Millipore polycarbonate membrane filters with 0.2 µm pores was used. The impactor had a constant flow rate of 16.5 l/min and the sampling time was between 8 to 15 h. The impactor aerodynamic cut-off diameters
15
are presented in Table1.
Sampling interval times were limited by the amount of aerosol needed for the in-tegrating plate technique that allows the evaluation of the absorption coefficient for particles smaller than 1 µm.
2.2. Experimental methods: microanalysis of samples
20
Particle analysis was performed using a HITACHI SEM-2700 which provides high reso-lution images of the particles. This allowed a classification of the main particles based on the morphology.
The microscope was equipped with a RONTEC energy dispersive X-ray system in order to obtain information about elemental constitution of the particles. A peak search program was used and the X-ray spectrum of each particle was obtained. This method allows the identification and posterior classification of different particles that share the
ACPD
5, 3921–3957, 2005 SEM/EDX and Baof Valladolid aerosol S. Mogo et al. Title Page Abstract Introduction Conclusions References Tables Figures J I J I Back CloseFull Screen / Esc
Print Version Interactive Discussion
EGU
same morphology, by using its elemental signature.
2.3. Experimental methods: absorption coefficients determination
5
Most of the difficulties in assessing the radiative net effect of the aerosols are due to the deficient evaluation of the absorption coefficient, usually much smaller than the scattering coefficient. Although, the extinction coefficient can be determined with a given precision using a white cell, exact splitting of the two contributions, absorption and scattering, is not an easy task and has a very high uncertainty, especially in what
10
concerns the absorption coefficient.
The absorption coefficients were evaluated by performing measurements in every filter before and after the aerosol collection. The method used is an adaptation of the widely known filter based method: the integrating plate method (Lin et al.,1973). We made some changes to the original method in the illumination and detection systems.
15
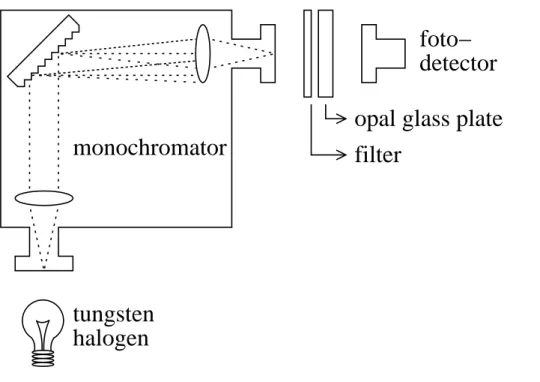
The light source was provided by a 50 W tungsten halogen lamp. A monochromator was laid between the light and the integrated plate; this allows the filter to be illuminated with monochromatic light with a wavelength dependent of the diffraction grating of the monochromator. The detection system was a simple photosensor. With this approach several wavelengths in the visible spectral region can be used. The monochromator
20
spectral window is 400–650 nm with a 50 nm resolution. This situation is sketched in Fig.2.
Aerosol absorption coefficients (σa) of particle samples with aerodynamic size bel-low 1 µm were determined by measuring the apparent transmission (T (λ)) of the light source beams through the polycarbonate filter:
25
T (λ)= If(λ)
I0(λ), (1)
where If(λ) and I0(λ) are the intensities of light passing through the sampling filter and a blank filter, respectively, for each wavelength. Assuming that the attenuation of the
ACPD
5, 3921–3957, 2005 SEM/EDX and Baof Valladolid aerosol S. Mogo et al. Title Page Abstract Introduction Conclusions References Tables Figures J I J I Back CloseFull Screen / Esc
Print Version Interactive Discussion
EGU
beam follows the Beer-Lambert law, one has:
If(λ)= I0(λ)e−xσa(λ), (2)
where x is the optical path length which can be determined from the volume of sampled
5
air and the effective cross-section area of the filter (x = VA). The absorption coefficient can be determined knowing I0(λ), If(λ), V and A:
σa(λ)= −A V ln
If(λ)
I0(λ). (3)
The mass absorption specific coefficient of fine particles, Ba(λ) can be obtained by: Ba(λ)= σa(λ)
Mφ<1µm, (4)
10
where Mφ<1µm is the mass concentration of fine particles (aerodynamic size bellow 1 µm).
By using this method, it is assumed that the optical properties of the particles are unchanged by the collection method and that its behavior remains unaltered after col-lected in the filter as it would be in an atmosphere cylinder of thickness x and section
15
equal to the filter’s effective cross-section, A.
With a system analogous to our, it was determined that 9% of the scattering is mea-sured as absorption (Bond et al.,1999). As we don’t have available scattering neither extinction information for the city of Valladolid, we can’t do a more adjusted estimation for our case assuming this value.
20
3. Results and discussion
3.1. SEM and EDX
The filters were covered with a conductive layer in order to make them visible to the microscope. This coating was made in some cases with a gold layer and in other cases
ACPD
5, 3921–3957, 2005 SEM/EDX and Baof Valladolid aerosol S. Mogo et al. Title Page Abstract Introduction Conclusions References Tables Figures J I J I Back CloseFull Screen / Esc
Print Version Interactive Discussion
EGU
with a carbon layer. Thus, in the X-ray spectra appears in one case the peak due to the gold coating and in the other case, the peak due to carbon coating. These peaks are not part of the X-ray spectra of the particles and it must be ignored when performing
5
the analysis. In the case of carbonate particles, they can be distinguished from the polycarbonate filter were they are collected because they present a much stronger sig-nal than that of the filter, which can be taken as background. This information together with its morphology was used in order to separate the signal of the particle from that of the polycarbonate filter.
10
Several classes of particles were detected in each impactor stage from both, natural and anthropogenic sources. Anthropogenic particles, including graphitic carbon (soot) were largely observed.
For aerosol classification we separated the particles into four basic shapes: chain agglomerates (c), spheres (s), prolonged (p) and irregulars (i) (Tables2,3,4and 5),
15
and in eight different types of elemental composition: 1. S-rich or sulphate particles: (NH4)2SO4, CaSO4, ...; 2. carbonaceous;
3. chlorine salts: Mg, K, Ca;
4. major silicon and calcium or crustal: Si, Ca, Al, Fe, ...;
20
5. major silicon and titanium; 6. major iron;
7. major aluminum; 8. major zinc.
ACPD
5, 3921–3957, 2005 SEM/EDX and Baof Valladolid aerosol S. Mogo et al. Title Page Abstract Introduction Conclusions References Tables Figures J I J I Back CloseFull Screen / Esc
Print Version Interactive Discussion
EGU
3.1.1. Particles with aerodynamic size below 1 µm: zero-stage particles
In the particle range bellow 1 µm the most relevant species found were the soot parti-cles, formed by carbon chains (Fig.3). Spherical carbon particles were also observed (Fig.4). These aerosols are most probably coal and oil fly ash particles. There were
5
also observed spherical sulfur particles (Fig.5).
3.1.2. Particles with aerodynamic size between 1 and 2.5 µm: first-stage particles Chloride salt particles, with size between 1 and 2.5 µm, were encountered in the first impactor level (Fig. 6). There were also encountered particles mainly constituted by silicon, calcium and other minor species. Nevertheless the dominant specie in this
10
impactor level were carbonaceous particles (Fig.7).
3.1.3. Particles with aerodynamic size between 2.5 and 10 µm: second-stage parti-cles
The impactor second level collected particles with size between 2.5 and 10 µm. The most common particles on this level were the chloride salts, mainly NaCl (Fig.8, Fig.9),
15
but also KCl, MgCl2 or CaCl2. This suggests the existence of some local source that has still not been determined, but had already been acknowledged by other authors (V ´azquez et al.,2003;Casado et al.,1996) in works about rainwater monitoring in near places.
3.1.4. Particles with aerodynamic size >10 µm: third-stage particles
20
The particles larger than 10 µm were collected on the third impactor level. In this range the dominant particles are those rich in silicon, calcium, aluminum and iron. Particles with this elemental constitution are present in all the impactor stages and they are with high probability clays, because this is the dominant constituent of local soils. They
ACPD
5, 3921–3957, 2005 SEM/EDX and Baof Valladolid aerosol S. Mogo et al. Title Page Abstract Introduction Conclusions References Tables Figures J I J I Back CloseFull Screen / Esc
Print Version Interactive Discussion
EGU
present in general an irregular form, Fig. 10, and a X-ray spectrum as that seen in
25
Fig.10.
In Fig. 11 it is summarized for better visualization the information given in the Ta-bles2–5. It is presented the distribution of the analyzed particles, by size, elemental composition and shape. Carbonaceous particles are dominant in the range of particle matter (PM) smaller than 2.5 µm and they appear predominantly as chains but in the
5
range of PM<1 µm there is a considerable proportion of carbonaceous spherical par-ticles too. In the range of PM>2.5 µm the dominant parpar-ticles are chloride salts and those formed by silicon, calcium, aluminium and iron (clays).
3.1.5. Mixture of particles
Particles scattering and absorption properties depend on shape, size distribution,
10
wavelength of the incident light, and most important on how various aerosol species are mixed.
The particles state of aggregation, that is, if they form an internal mixture, an ex-ternal mixture or a core-shell structure, is an important factor. If a particle is mixed internally with other particles, their optical properties can vary (Chandra et al.,2004).
15
For example, a soot inclusion in a sulphate particle changes the optical properties of the sulphate. If the sulphate particle is alone its effect is a net cooling of the atmo-sphere; but, if contains sufficient amount of soot can emit infrared radiation and warm up the surrounding atmosphere.
Usually, the absorption coefficient of a mixture of elemental carbon with
non-20
absorbent particles, is bigger for internal mixture than for external mixture (Horvath,
1993).
Figure12 and Fig.13 show several particles mixed with soot. The pictures present both situations, internal and external mixture. In Fig. 12 we can observe a carbon chain attached to a larger spherical particle while in Fig.13we observe how particles
25
ACPD
5, 3921–3957, 2005 SEM/EDX and Baof Valladolid aerosol S. Mogo et al. Title Page Abstract Introduction Conclusions References Tables Figures J I J I Back CloseFull Screen / Esc
Print Version Interactive Discussion
EGU
3.2. Light absorption coefficients measured by integrating plate method
There is a complete lack of information about absorption coefficients in the atmosphere of Valladolid (neither any other towns from center Spain), and this kind of atmosphere is not comparable to other towns in center Europe. So, we made some tests in order to know the distribution of the absorption coefficients in function of the size of the
5
particles. We verified that PM<1 µm presents the main contribution for the value of the absorption coefficient and the contribution of PM>1 µm is almost insignificant. Thus, calculate σa for all the particles or only for the fraction with aerodynamic size bellow 1 µm achieves approximately the same value.
Figure 14shows the evolution of the solar radiation absorption coefficients for
par-10
ticles with aerodynamic size bellow 1 µm for visible wavelengths during the period of sampling. For a wavelength nearly in the middle of visible spectrum, we say 550 nm, it was registered a minimum value of 7.33×10⁻⁶m−1and a maximum value of 1.01×10⁻⁴m−1. The average value for all the campaign period was 4.47×10⁻⁵m−1.
If we took the average absorption coefficient for all the wavelengths measured we get
15
a minimum of 7.42×10⁻⁶ m−1 and a maximum value of 1.05×10⁻⁴ m−1. The average absorption coefficient observed was 4.74×10⁻⁵m−1.
Figure15shows variation of the absorption coefficient through the visible spectrum. The three curves presented belong to three representative sample days, one partic-ularly high (11 February), one particpartic-ularly low (26 February) and one normal day (20
20
April). It can be observed that the absorption coefficient value decreases with the wavelength, the smaller the wavelength the highest the absorption coefficient. How-ever, this decrease is not very pronounced during our measurement period, reaching a maximum difference of 3.12 ×10⁻⁵ m−1 between 400 nm and 650 nm, a minimum difference of 2.98×10⁻⁶ m−1, and an average of 1.75×10⁻⁵ m−1. Based on the error
25
propagation theory we estimated an error between 27% and 39%. The error presents spectral dependence, with higher errors for 400 nm and smaller to 650 nm. The asso-ciated higher error can justify the inverse slope of the curve in the interval 400–500 nm
ACPD
5, 3921–3957, 2005 SEM/EDX and Baof Valladolid aerosol S. Mogo et al. Title Page Abstract Introduction Conclusions References Tables Figures J I J I Back CloseFull Screen / Esc
Print Version Interactive Discussion
EGU
(see Fig.15). We present error bars only for one of the days in order not to overload the figure. Our daily detection limit is 1.46×10⁻⁸m−1.
Figure16shows time series of total particulate matter (TPM), particles with aerody-namic size smaller than 1 µm, and the ratio of coarse to fine mode (C/F) during the campaign period. TPM values varies from 39.86 µg·m−3 to 184.88 µg·m−3 and the average for all the campaign days was 108.03 µg·m−3. Fine particles concentration
5
ranged between 10.23 µg·m−3 and 53.60 µg·m−3, average value was 28.22 µg·m−3. The ratio C/F was generally higher than 1.0 due to the presence of larger particles. By comparing Fig.14and Fig.16we can observe, as expected, that each increase of the absorption coefficient coincides with a decrease of the ratio C/F. The situations of C/F<1.0 are in coincidence with the highest absorption coefficients measured.
10
As we saw before, black carbon particles were present as the main component of small fraction matter so, we consider it as the main responsible for the measured visible light absorption.
Figure17illustrates time series of mass specific absorption coefficient of the particu-late matter with aerodynamic size below 1 µm. The calcuparticu-lated values for a wavelength
15
of 550 nm ranges between 0.37 m2g−1 and 4.66 m2g−1, with an average value of 1.76 m2g−1.
4. Conclusions
Our main initial goal was to collect particles for analysis by electron microscopy, which were separated according to their size. An exhaustive analysis of representative
par-20
ticle samples of Valladolid atmosphere has been performed for a greater amount of particles. Through the use of energy dispersive X-ray analysis techniques we were able to classify the particles according to its chemical structure. A more complete chemical analysis will be performed in a near future.
Particles of natural and anthropogenic origin were observed. Between these last
25
ACPD
5, 3921–3957, 2005 SEM/EDX and Baof Valladolid aerosol S. Mogo et al. Title Page Abstract Introduction Conclusions References Tables Figures J I J I Back CloseFull Screen / Esc
Print Version Interactive Discussion
EGU
all the levels of the impactor but in more relevant quantities in level zero, that is, in the particle range with aerodynamic sizes lower than 1 µm. In levels 0 and 1, bellow 2.5 µm, one encounters coal and oil fly ash particles. In levels 1 and 2, from 1 µm to 10 µm were observed great amounts of salts which suggest the presence of a local source but its confirmation will require further studies.
By assuming black carbon as the most abundant light-absorbing component of
5
aerosols (Hitzenberger et al., 1996) or, at least, the absorption coefficient of black carbon as substantially higher than other species at the wavelengths we are working with, we consider it as responsible for the visible light absorption measured.
In general, we can conclude that the fine mode found in the Valladolid atmosphere is more related with anthropogenic air pollution. The coarse mode is the most abundant
10
fraction found and consists mostly of mineral particles with natural origin. This could explain the low-medium values of the absorption coefficient measured.
We presented an easy way to characterize qualitatively the constitution and optical proprieties of the aerosol found in a chosen region. We feel safe to conclude that it is possible to use a combination of optical techniques (in this case the integrating
15
plate technique), scanning electron microscopy and energy dispersive X-ray analysis to obtain information relating optical and morphological properties of individual particles to their elemental composition.
We have also analyzed most of the filters by ionic chromatography, the results are currently being processed. One expects to be able to correlate ionic chromatographic
20
data with SEM/EDX data in order to better characterize local aerosol particles.
In what concerns to the absorption coefficient determination, we expect to extent this research very soon to UV region.
Acknowledgements. Scanning electron microscopy and energy dispersive X-ray analysis were performed by using instruments of the Optical Center of the University of Beira Interior and/or
25
instruments of the Department of Condensed Matter Physics of the University of Valladolid. This work was partially supported by the CYCIT Ref. REN2002-00966/CLI.
ACPD
5, 3921–3957, 2005 SEM/EDX and Baof Valladolid aerosol S. Mogo et al. Title Page Abstract Introduction Conclusions References Tables Figures J I J I Back CloseFull Screen / Esc
Print Version Interactive Discussion
EGU
References
Bond, T., Anderson, T., and Campbell, D.: Calibration and intercomparison of filter-based mea-surements of visible light absorption by aerosols, Aerosol Sci. Technol., 30, 582–600, 1999. Buseck, P. and P ´osfai, M.: Airbone minerals and related aerosol particles: Effects on climate
5
and environment, Proc. Nat. Acad. Sci. USA, 96, 3372–2279, 1999.
Casado, H., Encinas, D., and Lacaux, J.: Relationship between the atmospheric particulate fraction and the ionic content of precipitation in an area under influence of a waste incinerator located in the Basque Country (Spain), Atmos. Environ., 30, 1537–1542, 1996.
Chandra, S., Satheest, S., and Srinivasan, J.: Can the state of mixing of black carbon aerosols
10
explain the mistery of ‘excess’ atmospheric absorption?, Geophys. Res. Lett., 31, L19109, doi:10.1029/2004GL020662, 2004.
H ¨anel, G. and Hillenbrand, C.: Calorimetric measurement of optical absorption, Appl. Opt., 28, 510–516, 1989.
Hansen, J. and Nazarenko, L.: Soot climate forcing via snow and ice albedos, Proc. Nat. Acad.
15
Sci. USA, 101, 423–428, 2004.
Haywood, J. and Boucher, O.: Estimates of direct and indirect radiative forcing due to tropo-spheric aerosols: a review, Rev. Geophys., 38, 513–543, 2000.
Hitzenberger, R., Dusek, U., and Berner, A.: Black carbon measurements using an integrating sphere, J. Geophys. Res., 101, 19 601–19 606, 1996.
20
Horvath, H.: Atmospheric light absorption – a review, Atmos. Environ., 27A, 293–317, 1993. Lin, C., Baker, M., and Charlson, R.: Absorption coefficient of atmospheric aerosol: a method
of measurement, Appl. Opt., 12, 1356–1363, 1973.
McMurry, P., Litchy, M., Huang, P., Cai, X., Turpin, B., Dick, W., and Hanson, A.: Elemental composition and morphology of individual particles separated by size and hygroscopicity
25
with TDMA, Atmos. Environ., 30, 101–108, 1996.
Ramsden, A. and Shibaoka, M.: Characterization and analysis of individual fly-ash particles from coal-fired power stations by a combination of optical microscopy, electron microscopy and quantitative electron microprobe analysis, Atmos. Environ., 16, 2191–2206, 1982. Roberts, D. and Jones, A.: Climate sensitivity to black carbon aerosol from fossil fuel
combus-30
tion, J. Geophys. Res., 109, D16202, doi:10.1029/2004JD004676, 2004.
S ´anchez, M., Pascual, D., Ramos, C., and P ´erez, I.: Forecasting particulate pollutant con-centrations in a city from meteorological variables and regional weather patterns, Atmos.
ACPD
5, 3921–3957, 2005 SEM/EDX and Baof Valladolid aerosol S. Mogo et al. Title Page Abstract Introduction Conclusions References Tables Figures J I J I Back CloseFull Screen / Esc
Print Version Interactive Discussion
EGU
Environ., 24A, 1509–1519, 1990.
V ´azquez, A., Costoya, M., Pe ˜na, R., Garc´ıa, S., and Herrero, C.: A rainwater quality moni-toring network: a preliminary study of the composition of rainwater in Galicia (NW Spain),
345
Chemosp., 51, 375–386, 2003.
Wang, C.: A modeling study on the climate impacts of black carbon aerosols, J. Geophys. Res., 109, D03106, doi:10.1029/2003JD004084, 2004.
Willeke, K. and Baron, P. (Eds.): Aerosol Measurement, Principles, Techniques, and Applica-tions, John Wiley & Sons, Inc., 1993.
ACPD
5, 3921–3957, 2005 SEM/EDX and Baof Valladolid aerosol S. Mogo et al. Title Page Abstract Introduction Conclusions References Tables Figures J I J I Back CloseFull Screen / Esc
Print Version Interactive Discussion
EGU Table 1. Characteristics of the cascade impactor DEKATI PM10. Air flow: 16.5 l/min. Sizes are
aerodynamic equivalent size.
Stage Size range / µm Modal regime
0 <1 fine
1 1–2.5 coarse
2 2.5–10 coarse
ACPD
5, 3921–3957, 2005 SEM/EDX and Baof Valladolid aerosol S. Mogo et al. Title Page Abstract Introduction Conclusions References Tables Figures J I J I Back CloseFull Screen / Esc
Print Version Interactive Discussion
EGU Table 2. Particles found on impactor stage 0: aerodynamic size bellow 1 µm (% values).
Elemental analysis Shape Total
c i s p
S – 3.85 15.38 – 19.23
> Si, Ca, (Al, Fe) – 3.85 3.85 – 7.67
ACPD
5, 3921–3957, 2005 SEM/EDX and Baof Valladolid aerosol S. Mogo et al. Title Page Abstract Introduction Conclusions References Tables Figures J I J I Back CloseFull Screen / Esc
Print Version Interactive Discussion
EGU Table 3. Particles found on impactor stage 1: aerodynamic size between 1 µm and 2.5 µm
(% values).
Elemental analysis Shape Total
c i s p
S – 2.70 – – 2.70
Cl salts – 27.03 – – 27.03
> Si, Ca, (Al, Fe) – 21.62 5.41 – 27.03
> Fe – – 2.70 – 2.70
ACPD
5, 3921–3957, 2005 SEM/EDX and Baof Valladolid aerosol S. Mogo et al. Title Page Abstract Introduction Conclusions References Tables Figures J I J I Back CloseFull Screen / Esc
Print Version Interactive Discussion
EGU Table 4. Particles found on impactor stage 2: aerodynamic size between 2.5 µm and 10 µm
(% values).
Elemental analysis Shape Total
c i s p
S – 6.06 – – 6.06
Cl salts – 33.33 12.12 – 45.45 > Si, Ca, (Al, Fe) – 18.18 3.03 6.06 27.27
> Si, Ti, (Ca) – – – 3.03 3.03
> Fe – 6.06 – 3.03 9.09
ACPD
5, 3921–3957, 2005 SEM/EDX and Baof Valladolid aerosol S. Mogo et al. Title Page Abstract Introduction Conclusions References Tables Figures J I J I Back CloseFull Screen / Esc
Print Version Interactive Discussion
EGU Table 5. Particles found on impactor stage 3: aerodynamic size over 10 µm (% values).
Elemental analysis Shape Total
c i s p
S – 11.54 – – 11.54
Cl salts – 15.38 – 3.85 19.23 > Si, Ca, (Al, Fe) – 30.77 – 11.54 42.31
> Zn – 3.85 – – 3.85
> Al – 3.85 – 3.85 7.67
ACPD
5, 3921–3957, 2005 SEM/EDX and Baof Valladolid aerosol S. Mogo et al. Title Page Abstract Introduction Conclusions References Tables Figures J I J I Back CloseFull Screen / Esc
Print Version Interactive Discussion EGU
SPAIN
Valladolid
PORTUGAL
ACPD
5, 3921–3957, 2005 SEM/EDX and Baof Valladolid aerosol S. Mogo et al. Title Page Abstract Introduction Conclusions References Tables Figures J I J I Back CloseFull Screen / Esc
Print Version Interactive Discussion
EGU
halogen
detector
opal glass plate
monochromator
foto−
tungsten
filter
Fig. 2. Schema of the optical system using the integrating plate (opal glass plate) for the analysis of light absorbing aerosols. The light source is a 50 W tungsten halogen lamp. The monochromator can work from 400 nm to 650 nm. The detection is provided by a photosensor.
ACPD
5, 3921–3957, 2005 SEM/EDX and Baof Valladolid aerosol S. Mogo et al. Title Page Abstract Introduction Conclusions References Tables Figures J I J I Back CloseFull Screen / Esc
Print Version Interactive Discussion
EGU Fig. 3. SEM photo and X-ray spectrum of carbon chains. The darker points are the filter pores.
The black bar in the photo inferior right corner corresponds to 1 µm. Gold peaks in X-ray spectrum are due to the gold coating of the filter.
ACPD
5, 3921–3957, 2005 SEM/EDX and Baof Valladolid aerosol S. Mogo et al. Title Page Abstract Introduction Conclusions References Tables Figures J I J I Back CloseFull Screen / Esc
Print Version Interactive Discussion
EGU Fig. 4. Spherical carbon particle. Its spectrum is very similar to that of Fig.3. The black bar in
ACPD
5, 3921–3957, 2005 SEM/EDX and Baof Valladolid aerosol S. Mogo et al. Title Page Abstract Introduction Conclusions References Tables Figures J I J I Back CloseFull Screen / Esc
Print Version Interactive Discussion
EGU Fig. 5. Spherical sulfur-rich particle and the X-ray spectrum. Carbon peak is due to the carbon
ACPD
5, 3921–3957, 2005 SEM/EDX and Baof Valladolid aerosol S. Mogo et al. Title Page Abstract Introduction Conclusions References Tables Figures J I J I Back CloseFull Screen / Esc
Print Version Interactive Discussion
EGU Fig. 6. NaCl particles. Its X-ray spectrum is very similar to that of Fig.9. The number refers to
ACPD
5, 3921–3957, 2005 SEM/EDX and Baof Valladolid aerosol S. Mogo et al. Title Page Abstract Introduction Conclusions References Tables Figures J I J I Back CloseFull Screen / Esc
Print Version Interactive Discussion
EGU Fig. 7. Carbon agglomerate associated with a spherical particle of carbonaceous origin.
ACPD
5, 3921–3957, 2005 SEM/EDX and Baof Valladolid aerosol S. Mogo et al. Title Page Abstract Introduction Conclusions References Tables Figures J I J I Back CloseFull Screen / Esc
Print Version Interactive Discussion
EGU Fig. 8. NaCl particles and the respective X-ray spectrum. The white bar in the inferior left
ACPD
5, 3921–3957, 2005 SEM/EDX and Baof Valladolid aerosol S. Mogo et al. Title Page Abstract Introduction Conclusions References Tables Figures J I J I Back CloseFull Screen / Esc
Print Version Interactive Discussion
EGU Fig. 9. Cubic particle and its X-ray spectrum collected on impactor level 2. The black bar in the
photo inferior right corner corresponds to 1 µm. Carbon peak is due to the carbon coating of the filter.
ACPD
5, 3921–3957, 2005 SEM/EDX and Baof Valladolid aerosol S. Mogo et al. Title Page Abstract Introduction Conclusions References Tables Figures J I J I Back CloseFull Screen / Esc
Print Version Interactive Discussion
EGU Fig. 10. SEM image and X-ray spectrum of particle rich in silicon, calcium and aluminum. The
white bar in the inferior left corner corresponds to 2 µm. Carbon peak belong to the carbon coating of the filter.
ACPD
5, 3921–3957, 2005 SEM/EDX and Baof Valladolid aerosol S. Mogo et al. Title Page Abstract Introduction Conclusions References Tables Figures J I J I Back CloseFull Screen / Esc
Print Version Interactive Discussion
EGU Fig. 11. Frequence distribution of the analyzed particles by size, composition and shape. As
in the Tables2–5,c, i, sandpmean chain agglomerate, irregular, spherical and prolonged, respectively. Each column represents a characteristic elemental composition.
ACPD
5, 3921–3957, 2005 SEM/EDX and Baof Valladolid aerosol S. Mogo et al. Title Page Abstract Introduction Conclusions References Tables Figures J I J I Back CloseFull Screen / Esc
Print Version Interactive Discussion
EGU Fig. 12. (a) Soot particle. (b1) Chain-like soot monomers attached to a bigger particle. (b2)
Bellow, with more magnification it can be seen how the small carbon particles are added to the larger particle.
ACPD
5, 3921–3957, 2005 SEM/EDX and Baof Valladolid aerosol S. Mogo et al. Title Page Abstract Introduction Conclusions References Tables Figures J I J I Back CloseFull Screen / Esc
Print Version Interactive Discussion
EGU Fig. 13. Mixture of carbon aggregates with other particles. For the left picture, the white bar in
the inferior left corner corresponds to 2 µm. For the right picture, the black bar in the inferior right corner corresponds to 10 µm.
ACPD
5, 3921–3957, 2005 SEM/EDX and Baof Valladolid aerosol S. Mogo et al. Title Page Abstract Introduction Conclusions References Tables Figures J I J I Back CloseFull Screen / Esc
Print Version Interactive Discussion
EGU Fig. 14. Evolution of aerosol absorption coefficient during the campaign for particles with
ACPD
5, 3921–3957, 2005 SEM/EDX and Baof Valladolid aerosol S. Mogo et al. Title Page Abstract Introduction Conclusions References Tables Figures J I J I Back CloseFull Screen / Esc
Print Version Interactive Discussion
EGU Fig. 15. Aerosol absorption coefficient variation along visible spectrum. The three lines belong
to three example days: one particularly high, Feb 11 (•); one particularly low, 26 February (N); and one normal day, 20 April (H).
ACPD
5, 3921–3957, 2005 SEM/EDX and Baof Valladolid aerosol S. Mogo et al. Title Page Abstract Introduction Conclusions References Tables Figures J I J I Back CloseFull Screen / Esc
Print Version Interactive Discussion
EGU Fig. 16. Concentrations of aerosols observed during the sampling period. PM1 denote
partic-ulate matter with aerodynamic size bellow 1 µm, TPM denote total particpartic-ulate matter and C/F means the ratio between particles with aerodynamic size above and below 1 µm.
ACPD
5, 3921–3957, 2005 SEM/EDX and Baof Valladolid aerosol S. Mogo et al. Title Page Abstract Introduction Conclusions References Tables Figures J I J I Back CloseFull Screen / Esc
Print Version Interactive Discussion
EGU Fig. 17. Mass absorption coefficient of particulate matter with aerodynamic size below 1 µm.