HAL Id: hal-01068760
https://hal.archives-ouvertes.fr/hal-01068760
Submitted on 20 Nov 2014
HAL is a multi-disciplinary open access
archive for the deposit and dissemination of
sci-entific research documents, whether they are
pub-lished or not. The documents may come from
teaching and research institutions in France or
abroad, or from public or private research centers.
L’archive ouverte pluridisciplinaire HAL, est
destinée au dépôt et à la diffusion de documents
scientifiques de niveau recherche, publiés ou non,
émanant des établissements d’enseignement et de
recherche français ou étrangers, des laboratoires
publics ou privés.
The 2013, Mw 7.7 Balochistan earthquake, energetic
strike-slip reactivation of a thrust fault
J.-P. Avouac, F. Ayoub, S. Wei, J.-P. Ampuero, L. Meng, S. Leprince, R.
Jolivet, Z. Duputel, D. Helmberger
To cite this version:
J.-P. Avouac, F. Ayoub, S. Wei, J.-P. Ampuero, L. Meng, et al.. The 2013, Mw 7.7 Balochistan
earthquake, energetic strike-slip reactivation of a thrust fault. Earth Planet Sci. Lett., 2014, 391,
pp.128-134. �10.1016/j.epsl.2014.01.036�. �hal-01068760�
Contents lists available atScienceDirect
Earth and Planetary Science Letters
www.elsevier.com/locate/epslThe 2013, Mw 7.7 Balochistan earthquake, energetic strike-slip
reactivation of a thrust fault
Jean-Philippe Avouac
a,
∗
, Francois Ayoub
a, Shengji Wei
a, Jean-Paul Ampuero
a,
Lingsen Meng
a,
b, Sebastien Leprince
a, Romain Jolivet
a, Zacharie Duputel
a,
c,
Don Helmberger
aaGeological and Planetary Science Division, Caltech Institute of Technology, Pasadena, USA bDepartment of Earth, Planetary and Space Sciences, University of California Los Angeles, USA cInstitut de Physique du Globe de Strasbourg, UdS and EOST/CNRS UMR 7516, France1
a r t i c l e
i n f o
a b s t r a c t
Article history:
Received 23 November 2013
Received in revised form 18 January 2014 Accepted 24 January 2014
Available online 13 February 2014 Editor: P. Shearer
Keywords:
Balochistan earthquake Chaman fault Makran megathrust earthquake source model image geodesy
We analyse the Mw 7.7 Balochistan earthquake of 09/24/2013 based on ground surface deformation measured from sub-pixel correlation of Landsat-8 images, combined with back-projection and finite source modeling of teleseismic waveforms. The earthquake nucleated south of the Chaman strike-slip fault and propagated southwestward along the Hoshab fault at the front of the Kech Band. The rupture was mostly unilateral, propagated at 3 km/s on average and produced a 200 km surface fault trace with purely strike-slip displacement peaking to 10 m and averaging around 6 m. The finite source model
shows that slip was maximum near the surface. Although the Hoshab fault is dipping by 45◦ to the
North, in accordance with its origin as a thrust fault within the Makran accretionary prism, slip was nearly purely strike-slip during that earthquake. Large seismic slip on such a non-optimally oriented fault was enhanced possibly due to the influence of the free surface on dynamic stresses or to particular properties of the fault zone allowing for strong dynamic weakening. Strike-slip faulting on thrust fault within the eastern Makran is interpreted as due to eastward extrusion of the accretionary prism as it bulges out over the Indian plate. Portions of the Makran megathrust, some thrust faults in the Kirthar range and strike-slip faults within the Chaman fault system have been brought closer to failure by this earthquake. Aftershocks cluster within the Chaman fault system north of the epicenter, opposite to the direction of rupture propagation. By contrast, few aftershocks were detected in the area of maximum moment release. In this example, aftershocks cannot be used to infer earthquake characteristics.
©2014 Elsevier B.V. All rights reserved.
1. Introduction
The Mw 7.7 Balochistan earthquake which occurred in south-western Pakistan on 09/24/13 nucleated on a strike-slip fault seg-ment, south of the Chaman fault, which is part of the 1200 km long left-lateral fault system accommodating the 3 cm/yr north-ward motion of the western side of India relative to Eurasia (Lawrence et al., 1981; Szeliga et al., 2012) (Figs. 1 and 2). The W-phase moment tensor (Fig. 1) indicates purely strike-slip mo-tion on a 45◦ North dipping fault plane and a slight non-double component suggesting a non-planar fault geometry. The fault trace determined in this study (Figs. 2 and 3) shows that the rupture in-deed bends westward to merge with the arcuate tectonic fabric of the eastern Makran accretionary prism. These observations demon-strate that the rupture does not conform to Anderson’s theory for
*
Corresponding author.E-mail address:avouac@gps.caltech.edu(J.-P. Avouac).
1 Present address.
a newly formed fault, as such theory would require either purely dip-slip motion on the 45◦dipping fault or strike-slip motion on a vertical fault. This event is thus an interesting case example high-lighting the influence of fault geometry on seismic ruptures.
In this study, we first characterize and model the source of the earthquake combining remote-sensing and seismological observa-tions. We then discuss the implications for earthquake dynamics and the tectonic significance of that event.
2. Optical image correlation results
We measured horizontal surface displacements induced by the earthquake from cross-correlation of optical images using the COSI-Corr technique (Leprince et al., 2007). We used images from Landsat-8, an optical satellite system imaging the earth every 16 days which was launched by NASA in February 2013 and is now operated by USGS.
We processed two adjacent pairs of images along the satellite track. The pre-earthquake images were acquired on September 10,
0012-821X/$ – see front matter ©2014 Elsevier B.V. All rights reserved.
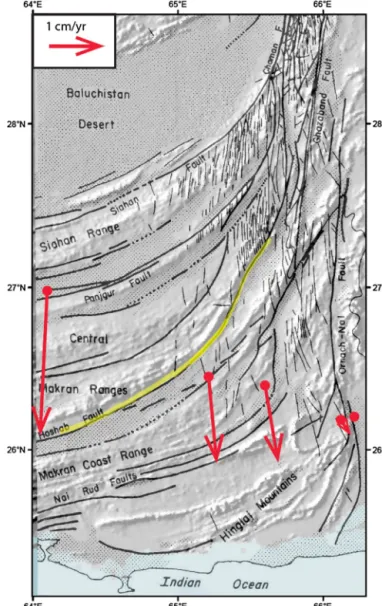
Fig. 1. Seismotectonic setting of the September 24, 2013, Mw 7.7 Balochistan earthquake. The location of the epicenter, red star (http://earthquake.usgs.gov/ earthquakes/eventpage/usb000jyiv), shows that the earthquake nucleated at the southern tip of the Chaman fault, the major left-lateral strike-slip fault accom-modating the northward motion of India relative to Eurasia. The curved trace of the surface rupture shows that the earthquake propagated along a restraining fault bend within the Makran accretionary prism. The box shows the footprint ofFig. 3. The W-phase moment tensor determined (inset) shows purely strike motion on the fault plane sub-parallel to the observed fault trace (see Supplements). The 10% non-double component is consistent with the curved geometry of the fault trace. The moment tensor of the finite source model (also in inset) is nearly identical to the W-phase moment tensor. Tectonic setting is based on the literature (Byrne et al., 1992; Kukowski et al., 2000; Lawrence et al., 1981). Arrows show the Arabia (Reilinger et al., 2006) and India (Ader et al., 2012) plate motions relative to sta-ble Eurasia. (For interpretation of the references to color in this figure legend, the reader is referred to the web version of this article.)
2013 (14 days before the event), and post-earthquake images were acquired on September 26, 2013 (2 days after the event). We correlated the panchromatic band (band 8), which has a ground sampling distance of 15 m, using a window size of 64
×
64 pixels (960×
960 m2) and a sliding step of 16 pixels (240 m). The pro-cedure yields the surface displacement vector fields with a ground sampling distance of 240 m, close to the actual resolution of the measurements, with a 1–σ
uncertainly of 30 cm. The results from the correlation of the two pairs were corrected for CCD-arrays ar-tifacts and mosaicked. See Supplements for more details about this analysis.These measurements (Fig. 3) reveal a 200 km long continuous surface rupture following the Hoshab thrust fault (Lawrence et al., 1981) which runs along the front of the Kech Band, a mountain-ous ridge peaking to about 1200 m (Fig. 2). Fault slip is essentially strike-slip, 6 m on average, and reaches up to 10 m (Fig. 4). The fault-normal component indicates a very small thrust component. Displacements are significantly larger on the northwestern side than on the southeastern side of the fault. Such asymmetry clearly indicates a northwest dipping fault consistent with the W-phase moment tensor.
3. Backprojection results
We imaged the rupture process by back-projecting (Ishii et al., 2005) teleseismic P-waves recorded by the Japanese Hi-net seis-mic network using the Multitaper-MUSIC array processing tech-nique (Meng et al., 2011) (Fig. 5). The technique tracks the spatio-temporal evolution of the sources of radiation in the 0.5–2 Hz
Fig. 2. Fault map of Eastern Makran (Lawrence et al., 1981) with surface rupture of the 2013, Mw 7.7 Balochistan earthquake (yellow, this study) and GPS velocities relative to India measured at 5 campaign sites surveyed between 2006 and 2012 (Szeliga et al., 2012). (For interpretation of the references to color in this figure legend, the reader is referred to the web version of this article.)
frequency band during the rupture process. Source radiation is reliably imaged during 50 s indicating southwestward unilateral rupture with speed fluctuating around 3 km/s on average (Fig. 6). Although it is unclear whether these fluctuations are real or simply reflect the data and method uncertainties, we observe that the plot suggests some segments with rupture speed as high as 5 km/s. The rupture speed may well have locally exceeded shear-wave speed. The distribution of the high frequency radiators relative to the mainshock epicenter follows remarkably well the fault geometry derived from the optical images. The high frequency radiations am-plified as the rupture propagated southwestwards.
4. Finite source modeling
We next determined a finite source kinematic model of the rup-ture from the joint inversion of surface displacements and seismic waveforms in the 0.01–1 Hz frequency band using the technique of Ji et al. (2002). We approximate the fault geometry with six planar fault segments. This is the minimum number of fault seg-ments needed to approximately fit the fault trace resolved from our image correlation results. We started with a single rectangular segment and iteratively increased the number of segments so as
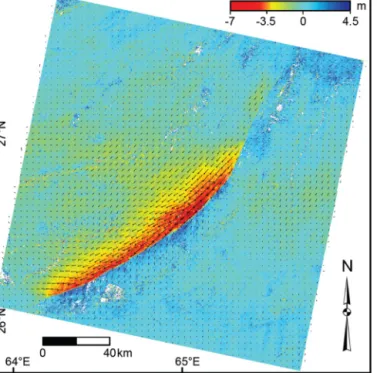
Fig. 3. Surface displacement measured from cross-correlation of optical satellite im-ages. We used two pairs of Landsat 8 images (15 m GSD), acquired on 09/10/13 and 09/26/13, which were co-registered and correlated using COSI-Corr (Leprince et al., 2007). Vector field show horizontal displacements and color shading shows the EW component of the displacement field (positive eastward) calculated with a 64×64 pixel correlation window and a 240 m Ground Sampling Distance (GSD). The 1–σ uncertainty on EW and NS displacement is estimated to 0.47 m and 0.60 m, respec-tively (see Supplements). (For interpretation of the references to color in this figure legend, the reader is referred to the web version of this article.)
Fig. 4. Surface fault slip measured from the displacement discontinuity across the fault trace; red shows strike-slip component (positive for left-lateral) and green fault-normal component (positive for extension). See Supplement for details. (For interpretation of the references to color in this figure legend, the reader is referred to the web version of this article.)
to best reduce at each step the misfit between the model geome-try and the measured fault trace. Dip angles were adjusted by trial and error. The model assumes that the rupture consists of a prop-agating rupture front with slip accruing in the wake of the rupture front over a duration called the rise-time. The back-projection re-sults lend support to the relevance of that parametrisation, which has also been shown to correctly retrieve rupture kinematics sim-ulated with dynamic ruptures models for a variety of scenarios (Konca et al., 2013). For each subfault, we solve for the slip am-plitude and rake, rise time and rupture velocity. We assume that all of the measured slip at the surface occurred during the seis-mic phase, ignoring the possibility of afterslip over the two days
Fig. 5. Rupture kinematics from back-projection of teleseismic P-waves. Rupture pro-cess imaged from back-projection of teleseismic P-waves recorded by the Japanese seismic network using the Multitaper-MUSIC array processing technique (Meng et al., 2011). Color dots show the locations of the high frequency sources (frequency band: 0.5–2 Hz). Size is proportional to the beamforming amplitude and color in-dicates the time of each window center relative to hypocentral time. The sliding window duration is 10 s and the first window is centered on first P waves arrival. (For interpretation of the references to color in this figure legend, the reader is re-ferred to the web version of this article.)
Fig. 6. Timing of the high frequency sources plotted as a function of distance along the fault indicates westward unilateral rupture with average speed of about 3 km/s.
following the earthquake. The finite-source model (Fig. 7) shows that the rupture initiated on a 70◦westward dipping subfault and then propagated to the southwest on 45◦ northwestward dipping fault segments releasing a cumulative moment of 5
.
4×
1020Nm,corresponding to a moment magnitude Mw 7.75. The moment ten-sor computed by summing the moment tenten-sors from all subfaults is found to be nearly identical to the W-phase moment tensor (Fig. 1, inset). In particular, our model does correctly account for the non-double-couple component determined by the point source solution. In our model, most of the slip occurred at depth shal-lower than 15 km. Total duration is about 60 s and the rupture velocity is quite uniform around 3 km/s on average. This value is consistent with the best fitting rupture velocity obtained for in-versions run with a constant rupture velocity (Fig. 8). The rake is everywhere close to zero, showing nearly purely strike-slip mo-tion. Rise-times are generally less than 8 s, much shorter than the total duration of the source, indicating a clear pulse-like rupture
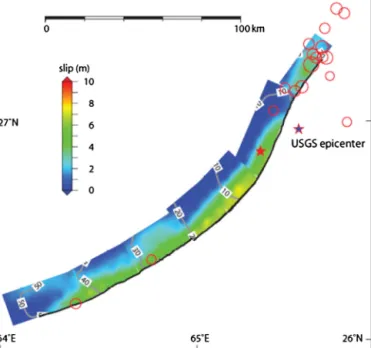
Fig. 7. Finite source kinematic model. Slip distribution in map view with isochrons (in seconds) of the rupture front propagation determined from the joint inversion of the surface displacements and teleseismic waveforms. The average speed of the rup-ture is 3 km/s for this preferred model. Red circles show aftershocks with mb>4 over the first week following the mainshock (NEIC catalogue). (For interpretation of the references to color in this figure legend, the reader is referred to the web version of this article.)
(Heaton, 1990). Rise-time (see Supplements) approximately scales with slip, indicating a fault slip rate of about 1 m/s throughout the rupture. Note that the peak slip rate could be much larger as our model does not resolve high frequencies (due to the filtering of frequency below 1 Hz and the smoothness of the assumed slip-rate function). The average stress drop derived from the released seismic moment and surface rupture area is 3.3 MPa. See Supple-ments for more details about the finite source modeling method and results. The source model is available online at:http://www. tectonics.caltech.edu/slip_history/index.html.
5. Discussion
5.1. Regional tectonic interpretation
The earthquake nucleated on a fault segment within the N–S trending Chaman fault strike-slip system. More surprisingly, it was able to propagate for over 150 km to the southwest within the Makran accretionary prism. The Hoshab fault, which originated as a thrust fault within the accretionary prism, was reactivated with nearly pure strike-slip motion. Still, kinematic compatibility with pure strike-slip motion on the North–South trending Chaman fault
requires a thrust component approximately equal to the observed strike-slip component (Fig. 2). We discuss here more precisely the structural setting of the Hoshab fault and the tectonic significance of strike-slip motion on this fault.
Structural field investigations suggest that thrust faults within the prism cut through Paleogene to Early Miocene turbidites de-tached from the underthrusting oceanic Arabian plate ( Ellouz-Zimmermann et al., 2007). The basal décollement lies at a depth probably larger than 12 km beneath the Kech Band ( Ellouz-Zimmermann et al., 2007). This is consistent with our finding that most of the slip occurred at depth shallower than 15 km. The morphology of the ridges in eastern Makran and deformed allu-vial surfaces observed on satellite images suggest active thrusting within the accretionary wedge, including on the Hoshab fault, as documented from morphotectonic field studies incentral-western Makran (Haghipour et al., 2012). Out-of sequence thrusting within the Makran wedge is also documented from field structural obser-vations (Platt et al., 1988). One might then wonder whether the strike-slip motion observed during the 2013 earthquake is repre-sentative of the Hoshab fault kinematics in long term or whether it is a rare strike-slip event on a fault with overall dominantly thrust motion. In that regard, it is interesting to comment on how the 2013 Balochistan earthquake relates to the regional tectonic setting.
A recent geodetic study (Szeliga et al., 2012) noticed that the geodetic strain is not centered on the Chaman fault system, includ-ing the Chaman, Gazaband and Ornach-Nal faults, but offseted to the west (Fig. 2). It is thus possible that a fraction of the strike-slip shear motion between Makran and Peninsular India is accommo-dated by faults within eastern Makran such as the one activated in 2013. However, the orientation of the Hoshab fault would require as much thrusting as strike-slip motion on that fault in view on the India/Eurasia plate motion and given the measured geodetic strain. The observed kinematics is quite different from the stan-dard slip-partioning mechanism whereby oblique convergence is absorbed by pure strike-slip faulting on a sub-vertical fault and pure dip-slip motion on a thrust fault (Wesnousky and Jones, 1994). One possibility would be that strike-slip motion is occa-sional and would have been induced during the 2013 rupture by dynamic stresses significantly different from the static stress field induced by regional tectonics. Another possibility would be that the regional deformation and subsequent stress field be organized so as to induce pure strike-slip motion along the Hoshab fault in a more complicated way than in standard slip partitioning. Such a possible scenario, sketched in Fig. 9 where arrows show long term velocities relative to Eurasia, is that the outer part of the prism is extruded eastward as it is squeezed against the Helmand block, the cratonic block forming the backstop of eastern Makran. As a result the prism bulges outward and is thrust over the Indian basement, east of the Chaman fault system. This mechanism would provide an explanation for thrusting within the NS trending Kirthar range (Fig. 1). According to this scenario, the Chaman fault system
Fig. 8. (a) Moment rate function corresponding to the finite source model ofFig. 7. (b) Sensitivity to the rupture speed determined by running inversions with an imposed constant rupture speed. The best fitting model is obtained for a rupture speed of 3 km/s, close to the average value of our preferred model, and close to the estimated S-waves velocity in the depth range of the rupture (Table S1).
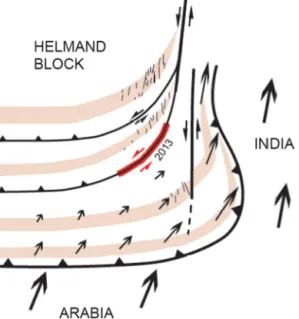
Fig. 9. Possible interpretation of regional tectonics. Sketch of faults pattern based onLawrence et al. (1981). Thin N–S trending line represents normal faults. Vectors show long term velocities relative to Iran assuming that a fraction of the oblique convergence between Arabia and central Iran is absorbed within the Makran ac-cretionary wedge. The fold-and-thrust belts within the Makran are dragged and stretched due to left-lateral shear along the Chaman fault system. The eastern part of the wedge is squeezed out and bulges eastwards.
propagates southward across the extruded portion of the prism. The arcuate shape of the fold-and-thrust belts in eastern Makran and the N–S to NW–SE trending normal faults noticed byLawrence et al. (1981), which are actually prominent in the morphology, would have developed as the folds are dragged and stretched due to left-lateral shear along the Chaman fault system (Fig. 9).
5.2. Static stress changes induced by the 2013 earthquake, relation to aftershocks and implications for regional seismic hazard
We discuss here the effect of the 2013 Balochistan earth-quake on nearby faults and the Makran Megathrust based on the
Coulomb stress change calculation (e.g., King et al., 1994). The calculation shows that the 2013 earthquake has brought the NS trending strike-slip faults of the Chaman fault system, north of the rupture, closer to yielding (Fig. 10a). This is consistent with the numerous aftershocks observed there. It must therefore have in-creased the probability of a significant seismic event along this fault system. Historical seismicity on the Chaman fault is actu-ally remarkably low in view of its length, longer than 1000 km, and slip rate, faster than 2 cm/yr (Ambraseys and Bilham, 2003; Szeliga et al., 2012). Only four significant earthquakes are re-ported on that fault system over the last 500 years. The largest one is the Mw 7.5 Quetta earthquake which probably ruptured the Ghazaband fault in 1935. The other ones, which occurred in 1505, 1892 and 1975, are more moderate with magnitudes be-tween 6 and 7. This would suggest that either aseismic creep plays a large role in accommodating the long term slip rate on that fault or that the largest earthquakes are not represented in historical seismicity. Sparse geodetic data do indicate low inter-seismic coupling (Szeliga et al., 2012), hence it is tempting to advocate for aseismic creep to explain the southward propaga-tion of the rupture and the generally low level of seismicity on the Chaman fault system. Data coverage is however too sparse to draw any firm conclusion about the proportion of aseismic creep.
Fig. 10b shows the effect of the 2013 Balochistan earthquake on the Makran Megathrust. This megathrust has produced large tsunamigenic earthquakes in the past, notably an Mw 8.1 event in 1945 (Byrne et al., 1992) (Fig. 1), and it might have the po-tential to generate even larger earthquakes (Smith et al., 2013). The Coulomb stress actually increased slightly in the rupture area of 1945 and decreased in the presumed rupture area of the 1765 earthquake. Significant Coulomb stress increased occurred on the deeper part of the Megathrust which is thought to slip aseismi-cally (Smith et al., 2013).Fig. 10c shows that the 2013 earthquake increased the Coulomb stress on the thrust fault within the Kirthar range, east of the rupture area. Seismicity and morphologic ex-pression of the range attest to its activity. The low shortening rate across the range (Fig. 2) and the relative proportion of seismic and aseismic deformation are unconstrained making it difficult to as-sess the seismic potential of the area.
Fig. 10. (a) The Coulomb stress change induced by the 2013, Mw 7.7 Balochistan earthquake on vertical NS left-lateral strike-slip faults parallel to the faults within the Chaman fault system (black thick lines) at 5 km depth. (b) Co-seismic Coulomb stress change on the Makran Megathrust which is assumed to be dipping by 15 northward. The estimated rupture areas of the 1945, Mw 8.1 earthquake and of the 1765 historical earthquake (Byrne et al., 1992). (c) Co-seismic Coulomb stress change on NS thrust faults, dipping 30 westward, parallel to the thrust faults within the Kirthar range calculated at 5 km depth. White dots show aftershocks with mb>4 over the first week following the mainshock (NEIC catalogue). The Coulomb stress is change is calculated based on our finite source model using Coulomb 3.3 (Toda et al., 2011;
http://pubs.usgs.gov/of/2011/1060/) assuming a friction coefficient of 0.4, a standard value used to account approximately for the effect of fluid pressure (King et al., 1994), and a Poisson coefficient of 0.25.
It is interesting to note that aftershocks of the 2013 Balochistan earthquake show a quite unusual pattern. First, they do not delin-eate well the rupture area (Fig. 7). The segment with the largest moment release is remarkably devoid of aftershocks. In addition, most recorded events occurred north of the rupture area and north of the epicenter, a pattern that might have been mistaken to sug-gest a northward directivity of the rupture.
5.3. Implications for faults dynamics
Fault geometry determines the initial stress prior to an earth-quake as well as the dynamic stresses during the seismic rupture (e.g.,Kase and Day, 2006; Lozos et al., 2011). It is therefore rec-ognized as one of the major factors governing the nucleation and propagation of seismic ruptures (Wesnousky, 2008). Observations (Bouchon et al., 1998; Bouchon et al., 2000; King and Nabelek, 1985) and numerical simulations (Bouchon and Streiff, 1997; Duan and Oglesby, 2005) of dynamic ruptures suggest in particu-lar that slip is impeded and seismic rupture speed slows down on non-optimally oriented fault segments (Bouchon and Streiff, 1997; Duan and Oglesby, 2005), i.e., segments unfavorably oriented with respect to the regional stress field and therefore with large strength excess (a large strength excess, defined as the difference between static frictional strength and initial shear stress, means that the pre-seismic stress is far from the condition for yielding).
It is interesting in that regard to comment on how the kinemat-ics of the 2013 rupture relates to the fault geometry. First, we note that the earthquake ruptured a quite smooth fault trace with only gradual geometric changes. The only significant jog is a 1 km-wide compressional jog at about 65◦E, at the junction between the 3rd and 4th segments of our model (Figs. 3 and 7). The rupture prop-agated across that jog undisrupted. We do not observe either any clear geometric control of the endpoints of the rupture (Fig. 2). In particular, the 2013 earthquake did not propagate to the north al-though this strike-slip fault segment was probably close to failure, as the numerous aftershocks observed there seem to suggest. It is possible that the rupture was inhibited due to a low initial stress which could be the stress shadow of a previous rupture or due to the effect of an aseismic barrier (Kaneko et al., 2010). This fault segment is probably too far from the stress shadow of the 1935 Quetta earthquake which is thought to have ruptured the Ghaza-band fault over 100 km to the North, but a low stress level could have resulted from some other earthquake not documented histor-ically. Observation of postseismic displacements would in principle reveal some afterslip in the case of an aseismic barrier.
The large slip and energetic rupture of the Hoshab fault is a puzzling observation in view of the presumed effect of fault geom-etry on rupture dynamics. Seismically activated fault planes tend to be optimally oriented, in agreement with Anderson’s theory of faulting: focal mechanism of shallow crustal earthquakes show dominantly either dip-slip or strike-slip sources, while sources with oblique slip are relatively rare (Celerier, 2008) as expected since the zero shear stress at the Earth surface implies that one principal stress is vertical.
Both the shallow dip angle and the increasing westward bend of the fault trace should make the Hoshab fault unfavorably ori-ented for a strike-slip rupture assuming a rather homogeneous re-gional stress field at the scale of the rupture. Also, due to the grad-ual fault bend, dynamic stresses should have induced clamping, hence inhibited the propagation of the rupture. Nevertheless, the amplitude of high frequency radiation, as well as surface deforma-tion and the finite source model, all consistently show that seismic rupture was actually boosted and not inhibited as it propagated along the bent Hoshab fault. The high moment release rate is ex-plained by a combination of large total slip and fast rupture speed. The average rupture speed estimated by our teleseismic
backpro-jection and finite source inversion results (
∼
3 km/s) is about 85% of the S-waves speed at the centroid rupture depth (see Table S1 for velocity structure). The fact that the rupture could propagate along the Hoshab fault over a long distance and with a speed close to that of the S-waves requires particular conditions. A high strength excess, as expected for a non-optimally oriented fault, should indeed have impeded the rupture propagation (Andrews, 1976). These characteristics require a low ratio of strength excess to stress drop possibly attesting to an intrinsically low yielding strength and/or very strong dynamic weakening. Interestingly, our source model shows slip increasing gradually upward to reach its maximum at the surface. This observation is in contrast with the near surface slip deficit which seems to characterize strike-slip earthquakes (Fialko et al., 2005), but is more alike the pattern ob-served in thrust earthquakes (Avouac et al., 2006; Ji et al., 2003) for which near surface large slip is potentially promoted by the interaction of the earthquake-generated stress field with Earth’s free surface (Huang et al., 2013; Kozdon and Dunham, 2013; Oglesby et al., 1998; Oglesby and Day, 2001). This mechanism may have been at play during the 2013 Balochistan earthquake. The Balochistan earthquake will serve as a good case-example to test the effect of fault geometry, pre-stress and dynamic weakening on seismic rupture propagation from dynamic modeling as has been done in a number of past studies (Aochi and Madariaga, 2003; Oglesby and Day, 2001).6. Conclusion
This study illustrates the benefits of combining remote sensing of surface deformation with backprojection and finite source mod-eling of teleseismic waveforms to derive well constrained earth-quake source models. The Balochistan earthearth-quake is a rare example of large strike-slip motion on a relatively low angle dipping fault. Such kinematics must have resulted from reactivation of a fault which originally formed as a thrust fault within the Makran ac-cretionary prism. The reactivation was made possible due to the vertical axis bending of the thrust belt associated with left-lateral shear along the Chaman fault system.
This case example is of particular interest to test dynamic mod-els of seismic ruptures. Such test might help identify the key fac-tors (low dip angle or dynamic weakening mechanisms) which could have allowed large and fast slip on a preexisting low angle thrust fault with a mapped curvature that should have impeded rupture propagation. Another noteworthy feature is the pattern of aftershocks which does not delineate the rupture area, with very few earthquakes in the area of maximum moment release, and cluster north of the epicenter in the direction opposite to the rup-ture directivity.
Acknowledgements
We thank Steve Wesnousky and one anonymous reviewer for their comments which helped clarify the manuscript. This research was partly supported by the Gordon and Betty Moore Foundation and NSF grant EAR 1147436. This is Tectonics Observatory contri-bution # 254.
Appendix A. Supplementary material
Supplementary material related to this article can be found on-line athttp://dx.doi.org/10.1016/j.epsl.2014.01.036.
References
Ader, T., Avouac, J.P., Liu-Zeng, J., Lyon-Caen, H., Bollinger, L., Galetzka, J., Genrich, J., Thomas, M., Chanard, K., Sapkota, S.N., Rajaure, S., Shrestha, P., Ding, L., Flouzat, M., 2012. Convergence rate across the Nepal Himalaya and interseismic coupling
on the Main Himalayan Thrust: Implications for seismic hazard. J. Geophys. Res., Solid Earth 117.
Ambraseys, N.N., Bilham, R., 2003. Earthquakes and associated deformation in Northern Baluchistan. Bull. Seismol. Soc. Am. 93, 1573–1605.
Andrews, D.J., 1976. Rupture velocity of plane strain shear cracks. J. Geophys. Res. 81, 5679–5687.
Aochi, H., Madariaga, R., 2003. The 1999 Izmit, Turkey, earthquake: Nonplanar fault structure, dynamic rupture process, and strong ground motion. Bull. Seismol. Soc. Am. 93, 1249–1266.
Avouac, J.P., Ayoub, F., Leprince, S., Konca, O., Helmberger, D.V., 2006. The 2005, M-w 7.6 Kashmir earthquake: Sub-pixel correlation of ASTER images and seis-mic waveforms analysis. Earth Planet. Sci. Lett. 249, 514–528.
Bouchon, M., Campillo, M., Cotton, F., 1998. Stress field associated with the rupture of the 1992 Landers, California, earthquake and its implications concerning the fault strength at the onset of the earthquake. J. Geophys. Res., Solid Earth 103, 21091–21097.
Bouchon, M., Streiff, D., 1997. Propagation of a shear crack on a nonplanar fault: A method of calculation. Bull. Seismol. Soc. Am. 87, 61–66.
Bouchon, M., Toksoz, N., Karabulut, H., Bouin, M.P., Dietrich, M., Aktar, M., Edie, M., 2000. Seismic imaging of the 1999 Izmit (Turkey) rupture inferred from the near-fault recordings. Geophys. Res. Lett. 27, 3013–3016.
Byrne, D.E., Sykes, L.R., Davis, D.M., 1992. Great thrust earthquakes and aseismic slip along the plate boundary of the Makran subduction zone. J. Geophys. Res., Solid Earth 97, 449–478.
Celerier, B., 2008. Seeking Anderson’s faulting in seismicity: A centennial celebra-tion. Rev. Geophys. 46.
Duan, B.C., Oglesby, D.D., 2005. Multicycle dynamics of nonplanar strike-slip faults. J. Geophys. Res., Solid Earth 110.
Ellouz-Zimmermann, N., Deville, E., Mueller, C., Lallemant, S., Subhani, A.B., Tabreez, A.R., 2007. Impact of sedimentation on convergent margin tectonics: Example of the Makran accretionary prism (Pakistan).
Fialko, Y., Sandwell, D., Simons, M., Rosen, P., 2005. Three-dimensional deformation caused by the Bam, Iran, earthquake and the origin of shallow slip deficit. Na-ture 435, 295–299.
Haghipour, N., Burg, J.P., Kober, F., Zeilinger, G., Ivy-Ochs, S., Kubik, P.W., Faridi, M., 2012. Rate of crustal shortening and non-Coulomb behaviour of an active ac-cretionary wedge: The folded fluvial terraces in Makran (SE, Iran). Earth Planet. Sci. Lett. 355, 187–198.
Heaton, T.H., 1990. Evidence for and implications of self-healing pulses of slip in earthquake rupture. Phys. Earth Planet. Inter. 64, 1–20.
Huang, Y.H., Ampuero, J.P., Kanamori, H., 2013. Slip-weakening models of the 2011 Tohoku-Oki earthquake and constraints on stress drop and fracture energy PA-GEOPH.
Ishii, M., Shearer, P.M., Houston, H., Vidale, J.E., 2005. Extent, duration and speed of the 2004 Sumatra–Andaman earthquake imaged by the Hi-Net array. Na-ture 435, 933–936.
Ji, C., Helmberger, D.V., Wald, D.J., Ma, K.F., 2003. Slip history and dynamic implica-tions of the 1999 Chi-Chi, Taiwan, earthquake. J. Geophys. Res., Solid Earth 108. Ji, C., Wald, D., Helmberger, D.V., 2002. Source description of the 1999 Hector Mine, California Earthquake, Part I: Wavelet domain inversion theory and resolution analysis. Bull. Seismol. Soc. Am. 92, 1192–1207.
Kaneko, Y., Avouac, J.P., Lapusta, N., 2010. Towards inferring earthquake patterns from geodetic observations of interseismic coupling. Nat. Geosci. 3, 363–369. Kase, Y., Day, S.M., 2006. Spontaneous rupture processes on a bending fault.
Geo-phys. Res. Lett. 33.
King, G.C., Nabelek, J., 1985. The role of fault bends in faults in the initiation and termination of earthquake rupture. Science 283, 984–987.
King, G.C.P., Stein, R.S., Lin, J., 1994. Static stress changes and the triggering of earth-quakes. Bull. Seismol. Soc. Am. 84, 935–953.
Konca, A.O., Kaneko, Y., Lapusta, N., Avouac, J.P., 2013. Kinematic inversion of physi-cally plausible earthquake source models obtained from dynamic rupture simu-lations. Bull. Seismol. Soc. Am. 103, 2621–2644.
Kozdon, J.E., Dunham, E.M., 2013. Rupture to the trench: Dynamic rupture simu-lations of the 11 March 2011 Tohoku earthquake. Bull. Seismol. Soc. Am. 103, 1275–1289.
Kukowski, N., Schillhorn, T., Flueh, E.R., Huhn, K., 2000. Newly identified strike-slip plate boundary in the northeastern Arabian Sea. Geology 28, 355–358. Lawrence, R.D., Khan, S.H., Dejong, K.A., Farah, A., Yeats, R.S., 1981. Thrust and strike
slip fault interaction along the Chaman transform zone, Pakistan. In: McClay, K., Price, N.J. (Eds.), Thrust and Nappe tectonics. The Geological Society, London, pp. 363–370.
Leprince, S., Barbot, S., Ayoub, F., Avouac, J.P., 2007. Automatic and precise orthorec-tification, coregistration, and subpixel correlation of satellite images, application to ground deformation measurements. IEEE Trans. Geosci. Remote Sens. 45, 1529–1558.
Lozos, J.C., Oglesby, D.D., Duan, B.C., Wesnousky, S.G., 2011. The effects of double fault bends on rupture propagation: A geometrical parameter study. Bull. Seis-mol. Soc. Am. 101, 385–398.
Meng, L.S., Inbal, A., Ampuero, J.P., 2011. A window into the complexity of the dy-namic rupture of the 2011 Mw 9 Tohoku-Oki earthquake. Geophys. Res. Lett. 38. Oglesby, D.D., Archuleta, R.J., Nielsen, S.B., 1998. Earthquakes on dipping faults: The
effects of broken symmetry. Science 280, 1055–1059.
Oglesby, D.D., Day, S.M., 2001. Fault geometry and the dynamics of the 1999 Chi-Chi (Taiwan) earthquake. Bull. Seismol. Soc. Am. 91, 1099–1111.
Platt, J.P., Leggett, J.K., Alam, S., 1988. Slip vectors and fault mechanics in the Makran accretionary wedge, southwest Pakistan. J. Geophys. Res., Solid Earth Planets 93, 7955–7973.
Reilinger, R., McClusky, S., Vernant, P., Lawrence, S., Ergintav, S., Cakmak, R., Ozener, H., Kadirov, F., Guliev, I., Stepanyan, R., Nadariya, M., Hahubia, G., Mahmoud, S., Sakr, K., ArRajehi, A., Paradissis, D., Al-Aydrus, A., Prilepin, M., Guseva, T., Evren, E., Dmitrotsa, A., Filikov, S.V., Gomez, F., Al-Ghazzi, R., Karam, G., 2006. GPS constraints on continental deformation in the Africa–Arabia–Eurasia con-tinental collision zone and implications for the dynamics of plate interactions. J. Geophys. Res., Solid Earth 111.
Smith, G.L., McNeill, L.C., Wang, K.L., He, J.H., Henstock, T.J., 2013. Thermal structure and megathrust seismogenic potential of the Makran subduction zone. Geophys. Res. Lett. 40, 1528–1533.
Szeliga, W., Bilham, R., Kakar, D.M., Lodi, S.H., 2012. Interseismic strain accumulation along the western boundary of the Indian subcontinent. J. Geophys. Res., Solid Earth 117.
Toda, S., Stein, R.S., Sevilgen, V., Lin, J., 2011. Coulomb 3.3: Graphic-rich deformation and stress-change software for earthquake, tectonic, and volcano research and teaching—user guide: U.S. Geological Survey Open-File Report 2011–1060. Wesnousky, S.G., 2008. Displacement and geometrical characteristics of earthquake
surface ruptures: Issues and implications for seismic-hazard analysis and the process of earthquake rupture. Bull. Seismol. Soc. Am. 98, 1609–1632. Wesnousky, S.G., Jones, C.H., 1994. Oblique slip, slip partitioning, spatial and
tempo-ral changes in the regional stress-field, and the relative strength of active faults in the basin and range, Western United-States. Geology 22, 1031–1034.