HAL Id: insu-01231177
https://hal-insu.archives-ouvertes.fr/insu-01231177
Submitted on 4 Mar 2016
HAL is a multi-disciplinary open access
archive for the deposit and dissemination of
sci-entific research documents, whether they are
pub-lished or not. The documents may come from
teaching and research institutions in France or
abroad, or from public or private research centers.
L’archive ouverte pluridisciplinaire HAL, est
destinée au dépôt et à la diffusion de documents
scientifiques de niveau recherche, publiés ou non,
émanant des établissements d’enseignement et de
recherche français ou étrangers, des laboratoires
publics ou privés.
aerosol transport events in the framework of the
ChArMEx/ADRIMED campaign at Minorca in June
2013
Patrick Chazette, Julien Totems, Gérard Ancellet, Jacques Pelon, Michael
Sicard
To cite this version:
Patrick Chazette, Julien Totems, Gérard Ancellet, Jacques Pelon, Michael Sicard.
Tempo-ral consistency of lidar observations during aerosol transport events in the framework of the
ChArMEx/ADRIMED campaign at Minorca in June 2013. Atmospheric Chemistry and Physics,
Eu-ropean Geosciences Union, 2016, 16 (5), pp.2863-2875. �10.5194/acp-16-2863-2016�. �insu-01231177�
www.atmos-chem-phys.net/16/2863/2016/ doi:10.5194/acp-16-2863-2016
© Author(s) 2016. CC Attribution 3.0 License.
Temporal consistency of lidar observations during aerosol transport
events in the framework of the ChArMEx/ADRIMED campaign at
Minorca in June 2013
Patrick Chazette1, Julien Totems1, Gérard Ancellet2, Jacques Pelon2, and Michaël Sicard3 1LSCE, CEA-CNRS-UVSQ, UMR 8212, Gif-sur-Yvette, France
2Sorbonne Universités, UPMC Université Paris 06, CNRS-UVSQ, UMR 8190 LATMOS, Paris, France 3RSLab/IEEC-CRAE, Universitat Politècnica de Catalunya, Barcelona, Spain
Correspondence to: Patrick Chazette ([email protected])
Received: 9 October 2015 – Published in Atmos. Chem. Phys. Discuss.: 19 November 2015 Revised: 15 February 2016 – Accepted: 16 February 2016 – Published: 4 March 2016
Abstract. We performed synergetic daytime and night-time active and passive remote-sensing observations at Minorca (Balearic Islands, Spain), over more than 3 weeks during the Chemistry-Aerosol Mediterranean Experi-ment/Aerosol Direct Radiative Effect in the Mediterranean (ChArMEx/ADRIMED) special observation period (SOP 1a, June–July 2013). We characterized the aerosol optical properties and type in the low and middle troposphere using an automated procedure combining Rayleigh–Mie–Raman lidar (355, 387 and 407 nm) with depolarization (355 nm) and AERONET Cimel®sun-photometer data. Results show a high variability due to varying dynamical forcing. The mean column-averaged lidar backscatter-to-extinction ratio (BER) was close to 0.024 sr−1(lidar ratio of ∼ 41.7 sr), with a large dispersion of ±33 % over the whole observation period due to changing atmospheric transport regimes and aerosol sources. The ground-based remote-sensing measurements, coupled with satellite observations, allowed the documentation of (i) dust particles up to 5 km (above sea level) in altitude originating from Morocco and Algeria from 15 to 18 June with a peak in aerosol optical thickness (AOT) of 0.25 ± 0.05 at 355 nm, (ii) a long-range transport of biomass burning aerosol (AOT = 0.18 ± 0.16) related to North American forest fires detected from 26 to 28 June 2013 by the lidar between 2 and 7 km and (iii) mixture of local sources including marine aerosol particles and pollution from Spain. During the biomass burning event, the high value of the particle depolarization ratio (8–14 %) may imply the presence of dust-like particles mixed with the biomass burning aerosols in the mid-troposphere. For the
field campaign period, we also show linearity with SEVIRI retrievals of the aerosol optical thickness despite 35 % relative bias, which is discussed as a function of aerosol type.
1 Introduction
The Mediterranean has been identified as one of the “hotspots” in projections of future climate change (Giorgi and Lionello, 2008), and it has been recently shown that aerosol direct and semi-direct effects, which were not prop-erly taken into account in global climate change simulations (IPCC, 2014), have a significant impact on surface temper-ature, evaporation, and precipitation at the regional scale (Nabat et al., 2015), i.e. a likely positive feedback on the trend for future dryer and thus more turbid Mediterranean summers. Due to the variability of aerosol properties over the Mediterranean basin, this calls for a more representative description of aerosol optical properties and spatiotemporal distribution by both observations and models.
Regional experiments including measurements of the ver-tical distribution of aerosols were performed some time ago to characterize aerosols around the Mediterranean Sea: (i) in the framework of the MEditerranean DUSt Experiment (MEDUSE) in 1997 (Hamonou et al., 1999), (ii) in the Sci-entific Training and Access to Aircraft for Atmospheric Re-search Throughout Europe (STAAARTE) airborne flights in 1997 (Dulac and Chazette, 2003) and 1998 (Formenti et al.,
2002), (iii) with a lidar deployed in Crete (Gobbi et al., 2000) or an instrumented ultralight aircraft in Lampedusa (Di Io-rio et al., 2003) during the Photochemical Activity and Ul-traviolet Radiation (PAUR II) campaign in 1999, (iv) over the eastern Mediterranean basin during the Mediterranean In-tensive Oxidant Study (MINOS; Lelieveld et al., 2002) and Mediterranean Israeli Dust Experiment (MEIDEX; Levin et al., 2005) in 2001, and (v) over the urban and industrial re-gion of Marseille–Fos–Berre on the French Mediterranean coast also in 2001 (Cros et al., 2004; Cachier et al., 2005); and (vi) in the framework of the EARLINET network (Pa-payannis et al., 2008). Such past experiments have produced very useful information about the vertical distribution of Mediterranean aerosol optical properties, based on in situ ob-servations and lidar measurements. During those preceding campaigns in the Mediterranean region, the use of aerosol lidars was focused on rather short time periods, but they ap-pear as a very powerful tool to identify the wide spectrum of aerosol types encountered in the tropospheric column (e.g. Chazette, 2003; Chazette et al., 2005a; Berthier et al., 2006; Groß et al., 2011; Tesche et al., 2011; Nisantzi et al., 2014). The multidisciplinary programme Mediterranean Integrated Studies at the Regional and Local Scales (MISTRALS; http: //www.mistrals-home.org), initiated by CNRS/INSU in 2010 to study the future habitability of the Mediterranean re-gion, offered the opportunity, within the Chemistry-Aerosol Mediterranean Experiment (ChArMEx, http://charmex.lsce. ipsl.fr), to conduct ground-based and airborne lidar observa-tions at the scale of the western Mediterranean basin.
The ChArMEx/Aerosol Direct Radiative Effect in the Mediterranean (ADRIMED) special observation period (SOP-1a) was set up from 11 June to 3 July to study aerosol optical properties and radiative effects in the western Mediterranean during the dry season, which shows a maxi-mum in aerosol optical depth (Nabat et al., 2013). The cam-paign involved several surface stations throughout the west-ern Mediterranean, research aircrafts, and instrumented bal-loons (Mallet et al., 2016). In this work, we focus on both active and passive remote-sensing observations performed at Minorca (Balearic Islands, Spain) during this campaign. The main goal of the paper is to demonstrate the benefit of continuous daytime and nighttime lidar measurements dur-ing at least 3 weeks to derive aerosol optical properties. It improves both the assessment of the diurnal variation of the aerosol distribution related to the planetary boundary layer (PBL) growth and the probability of detecting long-range transports of aerosol plumes. In Sect. 2, we first present the experimental set-up. Retrieved aerosol optical properties for both nighttime and daytime conditions are analysed in Sect. 3 to give an overall identification of aerosol types. In Sect. 4, we discuss the different origins of aerosol particles before discussing comparison with the Spinning Enhanced Visible and InfraRed Imager (SEVIRI) retrievals and concluding in Sect. 5.
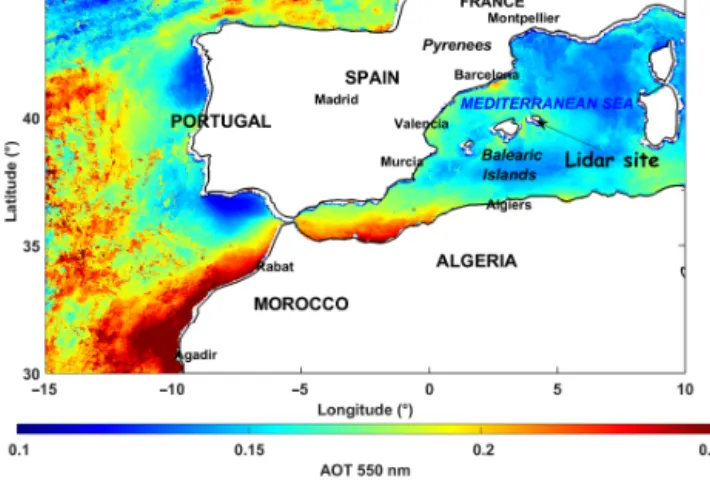
Figure 1. Location of the Cap d’en Font surface station on Minorca, on a map of the MSG/SEVIRI-derived aerosol optical thickness at 550 nm over ocean, averaged over the campaign period (10 June– 3 July 2013, daytime).
2 Ground-based remote-sensing measurements
During the campaign, our custom-made Raman lidar WALI (Chazette et al., 2014) was operated together with an AERONET sun photometer at Cap d’en Font (http://aeronet. gsfc.nasa.gov/new_web/photo_db/Cap_d_En_Font.html) on the south-eastern coast of Minorca (Balearic Islands, Spain). The instruments were located within ∼ 6 m from each other, at 39◦49032.900N, 04◦12029.300E, at ∼ 10 m above the mean
sea level (a.m.s.l.) and less than 70 m from a small cliff on the sea shore. The choice to use only remote-sensing in-struments is driven by the lack of representativeness of the ground-based in situ measurements, which are mainly af-fected by local dynamical forcings. This is especially true in coastal regions (Chazette, 2003). The selected location is mainly affected by Saharan and Spanish air masses. Figure 1 shows the location of the station approximately in the centre of the western Mediterranean basin. The campaign average aerosol optical thickness (AOT550, at 550 nm) distribution derived from SEVIRI on board the geostationary Meteosat Second Generation (MSG) platform is reported in this fig-ure. It shows a classical north–south decreasing gradient in the western Mediterranean basin due to African dust with maximum values between 0.20 and 0.25 in the Alboran Sea, and minimum values of ∼ 0.12 in the Gulf of Lion. Interme-diate values of ∼ 0.17 are found around Minorca.
2.1 Raman lidar
The WALI instrument uses an emitted wavelength of 354.7 nm and is designed to fulfil eye-safety conditions. The instrument, its calibration and the associated errors are docu-mented in Chazette et al. (2014) and will not be detailed here. During all the experiment, the acquisition was performed continuously with a vertical resolution of 15 m for mean
pro-Figure 2. Result of the lidar inversion on the both the integrated AOT and the BER for the elastic (Klett, 1985, algorithm) and N2–
Raman channels: (a) the nights of 16–17 June, and (b) the nights of 27–28 June. The grey area highlights the gap between the two approaches.
files of 1000 laser shots leading to a temporal sampling close to 1 min. The presence of clouds was visually detected in the lidar time series of range-corrected lidar backscattered profile, and the corresponding periods were removed. Two validated (e.g. Dieudonné et al., 2015) measurement synergy types have been used to retrieve the aerosol optical properties from the lidar. During daytime the sun-photometer AOT355 is considered as a constraint for the lidar inversion as in Chazette (2003). Note that using the total AOT only allows us to retrieve a column-averaged or equivalent backscatter-to-extinction ratio (BER, product of the backscatter phase function and the single scattering albedo, inverse of the li-dar ratio LR), integrating all the aerosol layers. During night-time, the two elastic and the N2–Raman channels of the lidar are used to determine simultaneously the aerosol BER, the vertical profile of the aerosol extinction coefficient (αe), and the linear particle depolarization ratio (PDR). All method-ological details are well presented in Royer et al. (2011) and Chazette et al. (2012a, 2014). The relative uncertainty on the BER is ∼ 5 % during nighttime (∼ 10 % during daytime). The relative uncertainties on the PDR are close to 10 % for the encountered AOT at 355 nm (AOT355>0.2). The relative uncertainty on the AOT is less than 2 %. The relative
uncer-tainty on the water vapour mixing ratio (WVMR) is between 7 and 11 % within the first kilometres of the atmosphere.
Two representative examples of AOT and BER retrieval are given in Fig. 2 corresponding to the main aerosol sources, biomass burning and desert dust observed during this cam-paign. They demonstrate the good agreement between the cumulative AOT derived from the N2–Raman and the elas-tic channels. The calculations have been performed using the average profile of nighttime measurements during the nights of 16–17 and 27–28 June, for biomass and dust cases, re-spectively. To improve the inversion, the mean profiles have been inverted using an altitude-variable BER and a regular-ization approach (Royer et al., 2011). For the first exam-ple, the BER (LR) is close to 0.04 sr−1 (25 sr) in the ma-rine boundary layer (MBL) and decreases with the altitude to reach values between 0.02 and 0.025 sr−1(50 and 40 sr) between 2 and 3 km a.m.s.l. The values of BER are similar for the second example in the MBL, but after decreasing be-low 0.02 sr−1in the aerosol layer above the MBL, they sig-nificantly increase above 4 km a.m.s.l. to reach ∼ 0.025 sr−1. These two profiles correspond to the main contributions of aerosol sources encountered during this period: maritime aerosol in the MBL (BER ∼ 0.04 sr−1 or LR ∼ 25 sr), dust (BER ∼ 0.025 sr−1or LR ∼ 40 sr) and biomass burning or lo-cal pollution (BER < 0.02 sr−1or LR > 50 sr).
2.2 Sun photometer
The Cimel® sun photometer is part of the Aerosol Robotic Network (AERONET; http://aeronet.gsfc.nasa.gov/cgi-bin/ type_piece_of_map_opera_v2_new; Holben et al., 1998). It performs measurements of solar light extinction at eight wavelengths in the solar spectrum between 340 and 1020 nm to retrieve the AOT at seven wavelengths. The instrument field of view is about 1◦, and the channel bandwidths are less than 20 nm. The instrument was calibrated prior to and after the campaign by the observation service Pho-tométrie pour le Traitement Opérationnel de Normalisa-tion Satellitaire (PHOTONS; http://loaphotons.univ-lille1. fr/), the French component of AERONET. We have used Level-2 quality-assured data. The AOT is retrieved with a maximal absolute uncertainty of 0.02, independent of the aerosol load. The aerosol optical thickness at the li-dar wavelength of 355 nm (AOT355)has been assessed us-ing the Ångström exponent (Ångström, 1964) and the sun-photometer AOT at 380 and 440 nm. Sun-sun-photometer AOT values at 500 and 675 nm are also used in this work for a bet-ter comparison to satellite products described below. Addi-tionally, these measurements were checked against and com-pleted by a SOLAR Light® Microtops II manual sun pho-tometer, calibrated by PHOTONS shortly before the cam-paign (AERONET instrument no. 695). The AOT accuracy is similar to that of the automated Cimel sun photometer. Nev-ertheless, manual solar targeting induces an additional bias, which leads to an absolute uncertainty of the order of 0.04 as
Figure 3. Temporal evolution between 10 June and 3 July 2013, local time, of the aerosol optical thickness at 500 nm (AOT), the Ångström exponent between 440 and 675 nm (Ang) and the fine-mode fraction (Frac) as derived from the sun-photometer measure-ments at Cap d’en Font. The AERONET products are completed by the Microtops II manual sun-photometer measurements on 10 June.
compared to simultaneous measurements by an automated sun photometer.
3 Temporal continuity of the aerosol optical properties 3.1 Vertically integrated aerosol optical properties
derived from the sun photometer
Both times series of AOT at 500 nm (AOT500)and Ångström exponent between 440 and 675 nm, as directly measured by the sun photometer, are plotted in Fig. 3.
AOT and Ångström exponent both exhibit a strong vari-ability due to the succession of aerosol events of differ-ent types, as revealed by the large range of variation of the Ångström exponent between ∼ 0.4 and 2.15. The fine-mode fraction of AOT also reported in the figure clearly co-varies with the Ångström exponent. The coarse-mode con-tribution is dominant from 16 to 20 June (coarse-mode frac-tion of AOT between 50 and 80 %) and also important on 24–25 June (35–70 %). The AOT appears to be higher with values larger than 0.2 during such periods. The AOT, which is below 0.38 (on 18 June) during the first 2 weeks of cam-paign, significantly increases on 26–28 June, showing several maxima (up to more than 0.6 on 27 June). Variations with particularly large amplitudes appear on the 26 and 27 June. Usually such peaks are due to northern African dust aerosol transport over the western Mediterranean basin (e.g. Moulin et al., 1998; Hamonou et al., 1999). In our case, the Ångström exponent ranging between 1 and 1.6 appears too high to sup-port the hypothesis of a dominant presence of dust parti-cles. Values of the Ångström exponent over 1.5 are typical of pollution-like or biomass burning aerosols (Chazette et al., 2005b), and an average value of 1.80 has been observed for non-dust conditions over the Mediterranean by Paronis
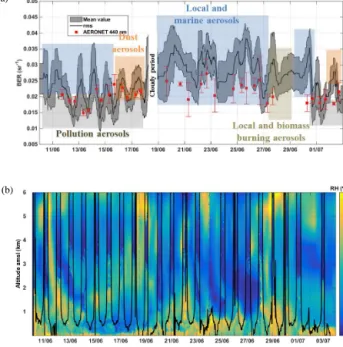
Page 27 sur 35 Figure 4: Temporal evolution of (a) the backscatter-to-extinction ratio (BER) and (b) the 635
relative humidity (RH) between 10 and 29 June 2013. In (a) the root mean square error (rmse) 636
is given by the grey area. The main aerosol categories have been identified in the figure as 637
pollution, dust, local, marine and biomass burning aerosols using BER and PDR values (see 638
text). The sunphotometer-derived BER is superimposed in red with its standard deviation 639
(variability over half a day). In (b) the RH is calculated from lidar measurements using the 640
thermodynamic temperature given by ECMWF analyses. During daytime the RH in the free 641
troposphere is that of ECMWF; the boundary between the two RH determinations is 642
highlighted by the continuous black line. 643
(a)
(b)
Figure 4. Temporal evolution of (a) the backscatter-to-extinction ratio (BER) and (b) the relative humidity (RH) between 10 and 29 June 2013. In (a) the root mean square error (RMSE) is given by the grey area. The main aerosol categories have been identified in the figure as pollution, dust, local, marine and biomass burning aerosols using BER and PDR values (see text). The sun-photometer-derived BER is superimposed in red with its standard deviation (variability over half a day). In (b) the RH is calculated from li-dar measurements using the thermodynamic temperature given by ECMWF analyses. During daytime the RH in the free troposphere is that of ECMWF; the boundary between the two RH determinations is highlighted by the continuous black line.
et al. (1998). Computations by Hamonou et al. (1999) sug-gest that a dust contribution to this AOT cannot be excluded but should be under a 0.45 fraction for the observed range of Ångström exponent. The lowest AOT values observed on 10 June together with a low range of Ångström exponent (0.01–0.21) are typical of a clear marine atmosphere with an aerosol population dominated by sea-salt particles. We note that the uncertainty on the Ångström exponent grows as the AOT decreases. For AOT < 0.15, the meaning of the Ångström exponent is subject to caution.
3.2 Aerosol optical properties derived from the ground-based lidar WALI
The temporal evolutions of the BER derived from both the lidar measurements and the sun photometer are compared in Fig. 4. The sun-photometer-derived column-integrated BER of the aerosols can be computed at 440 nm from the single scattering albedo and the backscatter phase function derived from the operational algorithm of AERONET (Dubovik and King, 2000). The root mean square error (RMSE in grey area) on the lidar-derived BER, determined as the
variabil-ity over 20 min, is close to 0.004 sr−1on average, which is comparable with the one retrieved by Chazette et al. (2012b) with a similar lidar system set-up in Minorca in the 2012 autumn season. We note a good coherence with the BER at 440 nm derived by the AERONET sun photometer. Yet, the sun-photometer-derived BER seems to be underestimated by ∼0.004–0.01 sr−1comparatively with the lidar between 19 and 26 June; the larger variability bars at this period are due to a lighter aerosol load (see Fig. 3), which may explain part of this discrepancy. The higher values of BER seen by the lidar would also be consistent with the hygroscopic proper-ties of aerosols within the PBL where the relative humidity significantly increases (Fig. 4b) to reach more than 90 %. In-deed, BER may increase with the growth of aerosols. More-over, the surface wind speed rose on 26 June, with gusts reaching 12 m s−1, which may feed the atmosphere with ma-rine aerosols (Blanchard et al., 1984).
For the sake of checking the consistency between the in-version procedures used during nighttime and daytime, the histograms of the equivalent BER are compared in Fig. 5 for daytime, nighttime and the whole day. These histograms account for all lidar data inverted in cloud-free conditions. The values greater than 0.045 sr−1 are not significant and may represent situations where the inversion process does not converge. Hence, ∼ 10 % of lidar profiles have not been considered in the synthesis. The nighttime BER distribu-tion, with a BER value of 0.024 ± 0.008 sr−1, is only slightly smaller than the daytime distribution (0.026 ± 0.007 sr−1). Hence, the BER values are deemed consistent between day-time and nightday-time, and the synthesis on the entire experi-ment period shows an average of 0.024 ± 0.008 sr−1(LR ∼ 41.7 ± 14 sr).
The temporal evolutions of the vertical profile of aerosol extinction coefficient and PDR are shown in Fig. 6. PDR is an effective parameter to separate the contribution of the more spherical particles from the ones due to dust-like aerosols (e.g. Chazette et al., 2012b). Between 16 and 19 June the PDR value is between 10 and 27 %, which is representa-tive of non-spherical dust-like aerosols (Müller et al., 2007; Tesche et al., 2011) as identified in Fig. 4a for BER between ∼0.021 and 0.028 sr−1. Except between 26 and 28 June, the aerosol content is dominated by spherical particles. Between 26 and 28 June a depolarizing layer is observed between ∼5 and 7 km a.m.s.l. The PDR ranges between 8 and 14 % suggesting that dust aerosols were mixed with other aerosol sources or were processed during their transport to Minorca. We will further discuss this case in Sect. 4. When considering the temporal evolution of AOT also given in Fig. 6a, we note that lidar- and sun-photometer-derived AOTs significantly differ on several occasions, especially in the cloudy periods (11, 20, 24, 25 and 27 June). This is due to residual cloud layers in the lidar profiles, which are not seen on the line of sight of the sun photometer, with a positive bias explained by the higher BER of these thin layers. In addition, from 26 to 28 June, the presence of high-altitude aerosol layers also
Figure 5. Backscatter-to-extinction ratio (BER) retrieved from (a) the synergy of the WALI lidar and the sun photome-ter during daytime, (b) the coupling between the elastic and N2–Raman channels during nighttime, and (c) the synthesis of
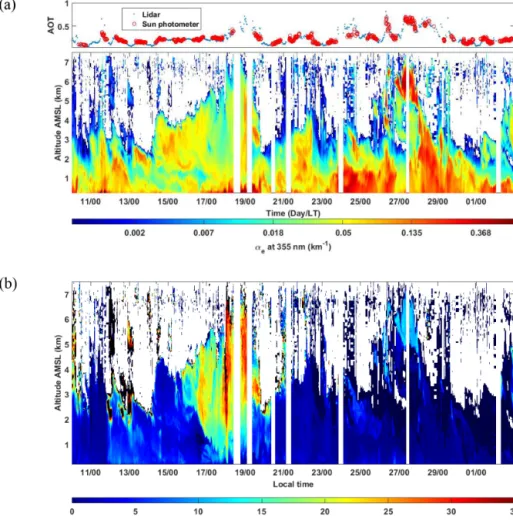
Figure 6. (a) The temporal evolution of the vertical profile of the aerosol extinction coefficient at 355 nm (αe). The top panel shows AOT
at 355 nm derived from the sun photometer (red circles) and lidar measurements (blue points). (b) The temporal evolution of the particulate depolarization ratio vertical profile at 355 nm (PDR). Time white stripes correspond to periods filtered out by visual examination of the lidar signal to identify the occurrence of clouds.
probably causes a strong heterogeneity of the aerosol BER in the tropospheric column (see Fig. 2b), which may explain part of the previous discrepancies because the aerosol types may be very different against the altitude. This shows the limited relevance of the notion of column-equivalent BER in heterogeneous cases.
3.3 Evidence of contributions by aerosol type as discriminated by lidar
The temporal evolution of the observed aerosol species can be derived from the analysis of the equivalent BER and PDR. Indeed, these two parameters, only calculated from the li-dar profiles, are sufficiently discriminating to identify the main aerosol types in most cases (Burton et al., 2012). Three aerosol types are considered: (i) dust-like aerosols with val-ues of BER and PDR centred on 0.022 sr−1 and 20 %, re-spectively, (ii) pollution aerosols with BER and PDR centred on 0.015 sr−1and 2 %, respectively, and (iii) marine aerosols
with mean values of BER and PDR centred on 0.04 sr−1and 0 %, respectively. For each aerosol type, literature sometimes reports a large range of values, as shown in Tables 1 and 3 of Dieudonné et al. (2015) for dust and pollution aerosols, re-spectively. These authors report at the same wavelength BER from 0.013 to 0.026 sr−1and PDR from 13 to 25 % for pure dust or dusty mix (0.011–0.017 sr−1and 3–5 %, respectively, for pollution) aerosols. This range of values includes the li-dar observations performed by Groß et al. (2011) in Cabo Verde (off western Africa) with BER = 0.017–0.020 sr−1and PDR = 24–27 %. The same authors report BER from 0.042 to 0.053 sr−1and PDR from 1 to 2 % for marine aerosols. Figure 7 gives the temporal evolution of the aerosol type af-ter defining a specific colour map as a function of BER and PDR. The lidar profiles were here averaged during 1 h with a vertical resolution of ∼ 30 m. The aerosol backscatter coeffi-cient (ABC) is coded by colour density: the more saturated, the larger the ABC (white corresponds to ABC = 0). A spe-cific colour scale is affected to the couple of variables BER
Page 31 sur 35
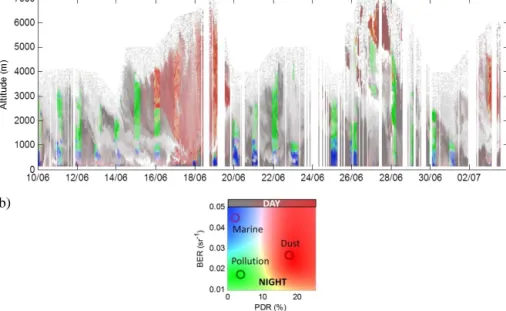
Figure 7: a) Results of aerosol speciation as given by lidar-derived extinction, PDR and BER,
653
with backscatter coefficient coded as saturation (no saturation, white = 0, full saturation = 5
654
10-6 m-1.sr-1); b) Key for the colours of the above. Nighttime: dust-, pollution- and marine-like
655
aerosols coded as red, green and blue respectively. Daytime: PDR coded as the saturation of
656
red (top of the colour key). Intermediate colours and grey thus designate undetermined layers
657
where aerosol mixing may occur.
658
(a)
(b)
Figure 7. (a) Results of aerosol speciation as given by lidar-derived extinction, PDR and BER, with backscatter coefficient coded as saturation (no saturation, white = 0, full saturation = 5 10−6m−1sr−1); (b) key for the colours of the above. Nighttime: dust-, pollution- and marine-like aerosols coded as red, green and blue respectively. Daytime: PDR coded as the saturation of red (top of the colour key). Intermediate colours and grey thus designate undetermined layers where aerosol mixing may occur.
and PDR during nighttime. As the inversion using the N2– Raman channel is not possible when the sun is up, the colour map has been only associated with the PDR during daytime. Such a graphic representation allows the refinement of the identification of the aerosol types that are presented in Fig. 4a. The higher BERs retrieved in Fig. 4a between 19 and 26 June are due to a larger contribution of reflective aerosols in the lower layers, likely sea salt particles, which may also be very hydrophilic. Pollution aerosols are present all along the measurement period except during the dust event be-tween 16 and 19 June. It is more difficult to attribute the layer above 5 km a.m.s.l. during the night of 26–27 June to a sin-gle aerosol source because depolarization is observed simul-taneously with low BER. This layer arrives above a layer of biomass burning or polluted aerosols which spread between ∼3 and 5 km a.m.s.l. A succession of pollution plumes orig-inated from different locations along the Spanish coast con-tributes to the aerosol pollution load in the lower free tro-posphere over Minorca according to the air mass trajectories (not shown). The intermittent plumes, lifted as the PBL de-velops over Spain each afternoon, explain the periodic be-haviour observed in Fig. 4a for the temporal evolution of the column-equivalent BER. However for the 26–27 June period the long-range transport, revealed by the back trajectories discussed hereafter, also shows a link with the North Ameri-can biomass burning aerosol sources. Note that long-range transport of biomass burning aerosols has always demon-strated to be a significant aerosol source over Europe (e.g. Fiebig et al., 2003; Müller et al., 2005). This temporal evo-lution of aerosol types based on the unique analysis of the
lidar data is quite consistent with the column-integrated ob-servations of the AERONET sun photometer, as discussed in Sect. 3.1 and reported in Fig. 3.
3.4 Regional representativeness as seen by spaceborne measurements
The observations conducted from the Minorca station are rel-evant to the local atmospheric column. In the following we put them in a more regional context using the measurements performed by SEVIRI (e.g. Bennouna et al., 2009) and the spaceborne instrument Moderate Resolution Imaging Spec-troradiometers (MODIS; Salmonson et al., 1989; King et al., 1992; http://modis.gsfc.nasa.gov). The MODIS data above land (few data are available above sea due to sun glitter) and the SEVIRI data above sea are combined in a single map to check the reliability in terms of continuity between sea and continent.
The spatial resolution of the MYD04_L2 product of MODIS is 10 × 10 km2 at nadir. The predicted uncertainty on the AOT at 550 nm over land is ±0.15 × AOT ± 0.05. The spatial and temporal resolutions of SEVIRI measurements are 10 × 10 km2and 15 min, respectively. The uncertainty on the SEVIRI-derived AOT is very dependent on the aerosol type (Bennouna et al., 2009). Compared to AERONET prod-ucts from coastal stations, Thieuleux et al. (2005) do not highlight any significant bias on the AOT at 550 nm derived from SEVIRI for values between ∼ 0.07 and 1. Their com-parison based on observations in 2003 indicates that the SE-VIRI AOT product is of somewhat lower quality at the sun-photometer sites directly affected by a desert dust plume
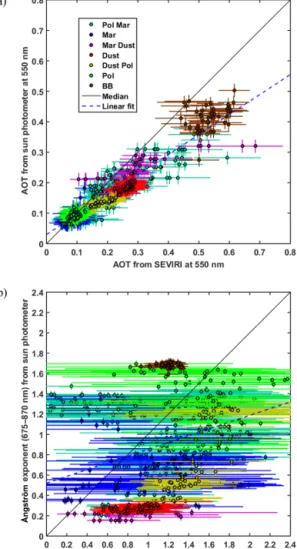
Figure 8. (a) Scatter plots between SEVIRI and the ground-based sun photometer of Minorca for the aerosol optical thickness AOT at 550 nm. The dotted line corresponds to the best fit against both retrievals. (b) The Ångström exponent for similar spectral ranges. A total of 846 coincident data pairs between 10 and 30 June are available for comparison. To the four aerosol types identified in Fig. 7, three mixed types are added which are all distinguished by their colour: pollution (Pol), dust (Dust), marine (Mar) and biomass burning (BB), mixing of pollution and marine (Pol Mar), marine and dust (Mar Dust), dust and pollution (Dust Pol). The black solid curve represents the identity line.
from northern Africa. This is attributed to the fact that the aerosol models used to compute the look-up table do not in-clude a specific desert dust model. Bréon et al. (2011) re-port a bias of 0.07 from their more exhaustive evaluation with AERONET sun photometers over the period from June 2005 to December 2010. From a similar linear fitting be-tween MODIS and AERONET, they found a smaller bias of ∼0.02 and a correlation slope close to 1.
Figure 8 shows the inter-comparison between quarter-hourly products from SEVIRI and from the coincident AERONET sun photometer of Minorca, including the AOT
at 550 nm (Fig. 8a) and the Ångström exponent (Fig. 8b, computed between 630 and 810 nm, and 675 and 870 nm for SEVIRI and the sun photometer, respectively). For the AOT, a linear least square fit highlights a significant devia-tion from the identity line with a factor of 0.65. The addi-tive bias is low, posiaddi-tive and close to 0.03. The mean RMSE is ∼ 0.066. The main discrepancies are mostly observed for the highest AOTs, occurring between 17–19 and 26–28 June when marine and dust aerosol are mixed and when biomass burning aerosols arrived above the site. The latter case is likely also associated with aerosol mixing. The discrepan-cies can be due to the resulting difficulty of the inversion process to identify a proper aerosol model, even for dust par-ticles which never completely prevail in terms of AOT. We note the larger dispersions for the mixing of marine particles with dust or pollution aerosols. In the following, we have cor-rected by −35 % the SEVIRI AOT550product. Whereas the sun-photometer-derived Ångström exponent seems coherent with our previous classification, our results suggest that the SEVIRI Ångström exponent product (Fig. 8b) has relatively large discrepancies at all AOTs, mostly related to aerosol type and microphysical properties. The dispersion is lower for the dust (red in the figure) and biomass burning (brown in the figure) events, but with overestimation and under-estimation, respectively. Consequently, the SEVIRI-derived AOT550 product over ocean, which relies on the evaluated Ångström exponent, should be carefully checked before use. Note that these conclusions on both AOT and Ångström ex-ponent cannot be generalized to other areas or other time pe-riods without further investigation.
The situations with the strongest AOT contrasts above the western Mediterranean basin are shown in Fig. 9. We can note the very good continuity, after the correction of the SEVERI-derived AOT, between sea and continent (MODIS-derived AOT). The main aerosol events are linked with either the highest PDR observed between 16 and 19 June, or the highest-altitude transport (above 5 km a.m.s.l.) between 26 and 28 June. The first event is due to desert dust aerosols off the Moroccan and Algerian coasts (see also Fig. 4). The sec-ond event reveals a plume crossing the Mediterranean from north to south and will be discussed hereafter. It is associated with a decrease of the BER after 26 June as shown in Fig. 4a.
4 Discussion
The pollution transport events observed at Minorca in the first part of the campaign, 12–18 June (Fig. 4), are associ-ated with the lowest values of the BER. To investigate their origins, we ran the HYbrid Single-Particle Lagrangian In-tegrated Trajectory (HYSPLIT) model (Draxler and Rolph, 2014) with 3-hourly archived meteorological data provided by the US National Center for Environmental Prediction (NCEP) Global Data Assimilation System (GDAS) at the horizontal resolution of 0.5◦. Two-day back trajectories (not
Page 34 sur 35
Figure 9: AOT composition between the MODIS observations over land and SEVIRI over
667
sea. The SEVIRI AOT was corrected by a factor 0.65 as identified from comparisons with the
668
sunphotometer reported in Figure 8. Top-left panel (a) is for 17 June, top-right (b) for 26 June,
669
bottom-left (c) for 27 June, and bottom-right (d) for 28 June. For 28 June the nighttime
670
CALIOP ground track (at about 2 UTC) is marked by a continuous grey line.
671
(a)
(c)
(b)
(d)
Figure 9. AOT composition between the MODIS observations over land and SEVIRI over sea. The SEVIRI AOT was corrected by a factor 0.65 as identified from comparisons with the sun photometer reported in Fig. 8: (a) 17 June, (b) 26 June, (c) 27 June and (d) 28 June. For 28 June the nighttime CALIOP ground track (at about 02:00 UTC) is marked by a continuous grey line.
shown) clearly trace those polluted air masses back to Spain. Still in the same period, we note an increase of the BER during nighttime. It may be due to a higher relative con-tribution of hygroscopic aerosols below 1 km a.m.s.l. as ex-plained in Sect. 3. Between 18 and 26 June (Fig. 4), the BER reaches ∼ 0.04 sr−1(LR = 25 sr) as observed by Flamant et al. (2000) for marine aerosols over the open ocean. Never-theless, we also note weak-medium surface wind speeds be-tween 2 and 8 m s−1, which are not favourable to a strong contribution of sea salt particles in the lower troposphere.
Satellite data show the arrival of an African dust plume from the Alboran Sea over the Balearic Islands starting slowly on 15 June and leaving Minorca on 19 June. The AOT slightly increases from 16 to 18 June, when the dens-est part of the dust plume passes over Minorca, to reach AOT355=0.25 ± 0.05. As highlighted by 3-day back tra-jectories (not shown), the dust plume came from Morocco and Algeria, as also illustrated by the satellite image in Fig. 9a. Moreover, measurements of the Cloud-Aerosol LI-dar with Orthogonal Polarization (CALIOP, PC-SCI-202.03, Vaughan et al., 2004) on 16 June highlight dust aerosols be-low 37.3◦ of latitude and polluted-dust aerosols above this latitude, which confirm the classification given in Fig. 7. In the dust layer above 1 km a.m.s.l., the PDR is 20 ± 5 % and the mean BER (LR) is 0.024 ± 0.002 sr−1 (∼ 41.7 ± 4 sr). Note that, as shown Fig. 2a and previously discussed, the BER significantly evolves within the low and medium tropo-sphere from 0.04 sr−1(LR = 25 sr) in the MBL to ∼ 0.020– 0.025 sr−1 (LR ∼ 50–40 sr) in the dust layer situated above ∼2 km a.m.s.l. An intermediate peak is observed in the BER profile between 1 and 2 km a.m.s.l. associated with smaller
values of the aerosol extinction coefficient (Fig. 6). This in-termediate layer is associated with PDR < 2 % and may be mainly affected by both marine and pollution aerosols.
The high-altitude aerosol event observed between 4 and 7 km a.m.s.l. above the western Mediterranean basin from 26 to 28 June is not usual in its nature since it results from a very turbid plume (AOT550>0.6) arriving from the NE At-lantic as visible on the Bay of Biscay on 26 June in Fig. 10. Formenti et al. (2002) have already documented with air-borne measurements such an event of 10-day aged haze lay-ers from Canadian fires over the eastern Mediterranean in August 1998. Seven-day back trajectories have been com-puted with the HYSPLIT model (Fig. 10). The back trajec-tories are superimposed on a MODIS AOT image combin-ing data from 24 June 2013. Dense aerosol plumes appear all along a transport pathway over the North Atlantic, with a dark red colour associated with AOT550values larger than 1. Note that the AOT even reaches 5 for many pixels, maybe because cloud contribution is also included as can be seen in the true colour image available on https://earthdata.nasa.gov/ labs/worldview/. As shown in Fig. 10, the biomass burning plume observed at 6 km over Minorca on 27 June crossed the Atlantic Ocean at altitudes between 4 and 8 km a.m.s.l. The plume is associated with forest fires occurring in Canada and Colorado.
The possible source regions are discussed in detail in the companion paper of Ancellet et al. (2016). It includes contri-butions from two different plumes: biomass burning aerosol from North America and dust transported westward over the Atlantic by the trade winds. Trajectories from the other plume detected close to 4 km a.m.s.l. over Minorca by the
li-Page 35 sur 35 672
673
Figure 10: 27 back trajectories from Menorca (39°51′44″N, 4°15′30″E). The back trajectories 674
have been computed using the ensemble mode of the HYSPLIT model (courtesy of NOAA 675
Air Resources Laboratory; http://www.arl.noaa.gov). The end location of the air mass 676
trajectories is at 6 km amsl in the plume detected by the WALI lidar on 27 June, 2013 over 677
Menorca (see Figure 6a). The top panel presents the location of each back trajectory 678
superimposed over the MODIS-derived AOT at 550 nm of 24 June, 2013, for several orbits. 679
The bottom panel shows the altitude of the back trajectories against time. 680
(a)
(b)
Figure 10. 27 back trajectories from Minorca (39◦5104400N, 4◦1503000E). The back trajectories have been computed using the ensemble mode of the HYSPLIT model (courtesy of NOAA Air Resources Laboratory; http://www.arl.noaa.gov). The end location of the air mass trajectories is at 6 km a.m.s.l. in the plume detected by the WALI lidar on 27 June 2013 over Minorca (see Fig. 6a). The top panel presents the location of each back trajectory super-imposed over the MODIS-derived AOT at 550 nm of 24 June 2013, for several orbits. The bottom panel shows the altitude of the back trajectories against time.
dar on 28 June (Fig. 6) also come from North America with little contribution from the Atlantic Saharan dust. The North American aerosol event of 26–27 June is characterized by AOT355=0.18 ± 0.16 above Minorca. It represents ∼ 50 % of the total mean columnar AOT (AOT355=0.41 ± 0.12) en-countered during this day. It is associated with a moister air mass, with a WVMR close to 1–2 g kg−1, comparatively to the clean free mid-troposphere (0.5 g kg−1), as derived from the H2O–Raman lidar channel. The uplifting of air masses from the lower troposphere occurs either above North America or above the Atlantic Ocean as discussed in Ancel-let et al. (2016). The equivalent BER has been assessed to be 0.023 ± 0.002 sr−1(LR ∼ 43.5 ± 4 sr) and corresponds to about the mean value of the vertical profile of BER given in Fig. 2b. As previously, the values retrieved in the MBL corre-spond to marine aerosols. The BER in the mixture of biomass burning aerosol and dust is determined as 0.025 ± 0.002 sr−1 (LR ∼ 40 ± 3 sr) with a PDR between 8 and 14 %. PDR val-ues between 8 and 18 % were measured over Cyprus by the lidar of Limassol (Nisantzi et al., 2014) for almost fresh biomass burning aerosols mixed with dust-like particles up-lifted by thermal convection and transported above the li-dar site. However, the dust observed over Cyprus presents a larger BER than the one generally derived over the Sahara. Groß et al. (2011) also report larger values of PDR (18–22 %) for a mixture of biomass burning and Saharan dust aerosol
over Cabo Verde with BER between 0.014 and 0.016 sr−1 (LR between 60 and 70 sr). In our case, the aerosols are more aged (at least 7 days) and may be more spherical due to water vapour condensation during transport over the At-lantic Ocean. We note cloud formation along some filaments created from the initial plume (not shown). Such a phe-nomenon decreases the PDR. Nevertheless, the value of PDR is higher and may indicate the presence of dust-like particles within the biomass burning plume. The high vertical reso-lution of the CALIOP lidar (30–60 m) can be processed to derive aerosol type and optical properties of the aerosol lay-ers (e.g. Vaughan et al., 2004; Thomason et al., 2007; Kim et al., 2008; Berthier et al., 2006) as the PDR. The 8–14 % PDR measured at 355 nm by the WALI lidar appears com-parable to the 10 % PDR at 532 nm observed by CALIOP (the ground track is given in Fig. 9d) off the Mediterranean Spanish coast at 1◦E in a layer between 38 and 39◦N on
28 June, 02:00 UTC (see Ancellet et al., 2016). Over the At-lantic Ocean (24 June), the aerosol plume is identified by CALIOP measurements either of smoke type or of polluted dust type.
5 Conclusions
Aerosol optical properties in the tropospheric column were derived from the measurements performed continuously, during 3 weeks in June and early July 2013, at Mi-norca during the Chemistry-Aerosol Mediterranean Experi-ment/Aerosol Direct Radiative Effect in the Mediterranean (ChArMEx/ADRIMED) special observation period (SOP-1a). The measurements sampled air masses with very differ-ent aerosol contdiffer-ent and a large range of optical thicknesses (AOT355=0.29 ± 0.17), which is representative of the years 2011–2013 (AOT355=0.24 ± 0.15). There are only a few cases where the aerosol layers are not composed of a mixture of different aerosol types. They originate from the surround-ing sea, the Spanish coastal cities, the northern Africa deserts and even distant forest fires in North America. We have noted that the complex mixing of aerosols likely impacts the re-trieval of the AOT from SEVIRI leading to a relative bias close to 35 %.
The instrumental synergy, coupling either the sun pho-tometer or the N2–Raman channel with the elastic channel, allows a well-constrained processing of the lidar measure-ments, from which we were able to follow the evolution of the aerosol optical properties between night and day. In par-ticular, the continuity of column-equivalent BER measure-ments is ensured. Lidar observations allowed locating scat-tering layers in the troposphere and, in particular, identi-fying a complex aerosol transport from North America in the middle troposphere (between 2 and 7 km a.m.s.l.). Air masses took between 5 and 7 days to arrive over the Mediter-ranean Sea. There has been a great variability in the nature of aerosols in the troposphere from 26 to 28 June 2013. This
variability is evidenced by the BER profile estimated from the Raman lidar WALI, with a strong variance (BER (LR) = 0.024 ± 0.008 sr−1(∼ 41.7 ± 14 sr), above 4 km a.m.s.l. and < 0.02 sr−1(> 50 sr) between 2 and 4 km a.m.s.l.). However, such variability has a weak impact on the AOT measure-ments, be it during nighttime or daytime. We have also observed the presence of depolarizing particles (PDR ∼ 8– 14 %, at 355 nm) in a biomass burning plume originat-ing from North America correspondoriginat-ing to Saharan dust re-circulated over the Atlantic Ocean, as discussed in the com-panion paper by Ancellet et al. (2016).
These results show that an assessment of the radiative bud-get of aerosols over the western Mediterranean basin can be easily performed by considering the average optical proper-ties of the particles. Nevertheless, for the evaluation of atmo-spheric heating rates and possible associated effects on cloud formation, single scattering albedo must be taken into ac-count, which is linked to the vertical evolution of the aerosol types given by our classification. Moreover, the single scat-tering albedo may be constrained by the lidar-derived BER as in Randriamiarisoa et al. (2004) or Raut and Chazette (2008). The latter has indeed been shown in this campaign to be very variable, both in time and altitude, due to the mixing of very different aerosol contributions over the Mediterranean Sea.
Acknowledgements. This work was supported by the French space
agency (CNES) and the Commissariat à l’Energie Atomique (CEA). The campaign at Minorca was also supported by CNRS/INSU and Météo-France through the MISTRALS/ChArMEx programme, and by the Spanish Ministry of Science and Innovation and FEDER funds under the projects TEC2012-34575, UNPC10-4E-442 and CGL2011-13580-E/CLI. Matthieu Jeannot from LPC2E, and François Dulac and Sahar Hassanzadeh from LSCE are acknowl-edged for their technical help during the campaign. Juan Ramon Moreta Gonzalez and Miguel Angel Heredia Jodar from AEMET are acknowledged for AERONET data from Palma.
Edited by: O. Dubovik
References
Ancellet, G., Pelon, J., Totems, J., Chazette, P., Bazureau, A., Sicard, M., Di Iorio, T., Dulac, F., and Mallet, M.: Long range transport and mixing of aerosol sources during the 2013 North American biomass burning episode: analysis of multiple lidar observations in the Western Mediterranean basin, Atmos. Chem. Phys., accepted, 2016.
Ångström, A.: The parameters of atmospheric turbidity, Tellus, 16, 64–75, 1964.
Bennouna, Y. S., de Leeuw, G., Piazzola, J., and Kurmierczyk-Michulec, J.: Aerosol remote sensing over the ocean using MSG-SEVIRI visible images, J. Geophys. Res., 114, D23203, doi:10.1029/2008JD011615, 2009.
Berthier, S., Chazette, P., Couvert, P., Pelon, J., Dulac, F., Thieuleux, F., Moulin, C., and Pain, T.: Desert dust
aerosol columnar properties over ocean and continental Africa from Lidar in-Space Technology Experiment (LITE) and Meteosat synergy, J. Geophys. Res., 111, D21202, doi:10.1029/2005JD006999, 2006.
Blanchard, C. D., Woodcock, A. H., and Cipriano, R. J.: The verti-cal distribution of concentration of sea sealt in the marine atmo-sphere near Hawaii, Tellus B, 36, 118–125, 1984.
Bréon, F.-M. M., Vermeulen, A., and Descloitres, J.: An evaluation of satellite aerosol products against sunphotome-ter measurements, Remote Sens. Environ., 115, 3102–3111, doi:10.1016/j.rse.2011.06.017, 2011.
Burton, S. P., Ferrare, R. A., Hostetler, C. A., Hair, J. W., Rogers, R. R., Obland, M. D., Butler, C. F., Cook, A. L., Harper, D. B., and Froyd, K. D.: Aerosol classification us-ing airborne High Spectral Resolution Lidar measurements – methodology and examples, Atmos. Meas. Tech., 5, 73–98, doi:10.5194/amt-5-73-2012, 2012.
Cachier, H., Aulagnier, F., Sarda, R., Gautier, F., Masclet, P., Be-sombes, J.-L., Marchand, N., Despiau, S., Croci, D., Mallet, M., Laj, P., Marinoni, A., Deveau, P.-A., Roger, J.-C., Putaud, J.-P., Van Dingenen, R., Dell’Acqua, A., Viidanoja, J., Martins-Dos Santos, S., Liousse, C., Cousin, F., Rosset, R., Gardrat, E., and Galy-Lacaux, C.: Aerosol studies during the ESCOMPTE exper-iment: an overview, Atmos. Res., 74, 547–563, 2005.
Chazette, P.: The monsoon aerosol extinction properties at Goa dur-ing INDOEX as measured with lidar, J. Geophys. Res., 108, 4187, doi:10.1029/2002JD002074, 2003.
Chazette, P., Couvert, P., Randriamiarisoa, H., Sanak, J., Bon-sang, B., Moral, P., Berthier, S., Salanave, S., and Toussaint, F.: Three-dimensional surveyof pollution during winter in French Alps valleys, Atmos. Environ., 39, 1035–1047, 2005a.
Chazette, P., Randriamiarisoa, H., Sanak, J., Couvert, P., and Flamant, C.: Optical properties of urban aerosol from air-borne and ground-based in situ measurements performed dur-ing the Etude et Simulation de la Qualité de l’air en Ile de France (ESQUIF) program, J. Geophys. Res., 110, D02206, doi:10.1029/2004JD004810, 2005b.
Chazette, P., Bocquet, M., Royer, P., Winiarek, V., Raut, J. C., Labazuy, P., Gouhier, M., Lardier, M., and Cariou, J. P.: Eyjafjallajökull ash concentrations derived from both li-dar and modeling, J. Geophys. Res.-Atmos., 117, D00U14, doi:10.1029/2011JD015755, 2012a.
Chazette, P., Dabas, A., Sanak, J., Lardier, M., and Royer, P.: French airborne lidar measurements for Eyjafjallajökull ash plume sur-vey, Atmos. Chem. Phys., 12, 7059–7072, doi:10.5194/acp-12-7059-2012, 2012b.
Chazette, P., Marnas, F., and Totems, J.: The mobile Water vapor Aerosol Raman LIdar and its implication in the framework of the HyMeX and ChArMEx programs: application to a dust transport process, Atmos. Meas. Tech., 7, 1629–1647, doi:10.5194/amt-7-1629-2014, 2014.
Cros, B., Durand, P., Cachier, H., Drobinski, P., Fréjafon, E., Kottmeier, C., Perros, P., Peuch, V., Ponche, J.-L., Robin, D., Said, F., Toupance, G., and Wotham, H.: The ESCOMPTE Pro-gram: an overview, Atmos. Res., 69, 241–279, 2004.
Dieudonné, E., Chazette, P., Marnas, F., Totems, J., and Shang, X.: Lidar profiling of aerosol optical properties from Paris to Lake Baikal (Siberia), Atmos. Chem. Phys., 15, 5007–5026, doi:10.5194/acp-15-5007-2015, 2015.
Di Iorio, T., di Sarra, A., Junkermann, W., Cacciani, M., Fiocco, G., and Fuà, D.: Tropospheric aerosols in the Mediterranean: 1. Mi-crophysical and optical properties, J. Geophys. Res., 108, D02201, doi:10.1029/2002JD002815, 2003.
Draxler, R. R. R. and Rolph, G. D. D.: HYSPLIT (HYbrid Single-Particle Lagrangian Integrated Trajectory) Model access via NOAA ARL READY Website, available at: http://www.arl.noaa. gov/HYSPLIT.php (last access: November 2015), NOAA Air Resources Laboratory, College Park, MD, 2014.
Dubovik, O. and King, M. D.: A flexible inversion algorithm for re-trieval of aerosol optical properties from Sun and sky radiance measurements, J. Geophys. Res.-Atmos., 105, 20673–20696, doi:10.1029/2000JD900282, 2000.
Dulac, F. and Chazette, P.: Airborne study of a multi-layer aerosol structure in the eastern Mediterranean observed with the airborne polarized lidar ALEX during a STAAARTE campaign (7 June 1997), Atmos. Chem. Phys., 3, 1817–1831, doi:10.5194/acp-3-1817-2003, 2003.
Fiebig, M., Stohl, A., Wendisch, M., Eckhardt, S., and Petzold, A.: Dependence of solar radiative forcing of forest fire aerosol on ageing and state of mixture, Atmos. Chem. Phys., 3, 881–891, doi:10.5194/acp-3-881-2003, 2003.
Flamant, C., Pelon, J., Chazette, P., Trouillet, V., Quinn, P. K., Frouin, R., Bruneau, D., Francois Leon, J., Bates, T. S., John-son, J., and Livingston, J.: Airborne lidar measurements of aerosol spatial distribution and optical properties over the At-lantic Ocean during a European pollution outbreak of ACE-2, Tellus B, 52, 662–677, doi:10.1034/j.1600-0889.2000.00083.x, 2000.
Formenti, P., Boucher, O., Reiner, T., Sprung, D., Andreae, M. A., Wendisch, M., Wex, H., Kindred, D., Tzortziou, M., Vasaras, A., and Zerefos, C.: STAAARTE-MED 1998 summer airborne mea-surements over the Aegean Sea. 2. Aerosol scattering and ab-sorption, and radiative calculations, J. Geophys. Res., 107, 4451, doi:10.1029/2001JD001536, 2002.
Giorgi, F. and Lionello, P.: Climate change projections for the Mediterranean region, Global Planet. Change, 63, 90–104, doi:10.1016/j.gloplacha.2007.09.005, 2008.
Gobbi, G. P., Barnaba, F., Blumthaler, M., Labow, G., and Her-man, J. L.: Observed effects of particles nonsphericity on the re-trieval of marine and desert dust aerosol optical depth by lidar, Atmos. Res., 61, 1–14, 2000.
Groß, S., Tesche, M., Freudenthaler, V., Toledano, C., Wiegner, M., Ansmann, A., Althausen, D., and Seefeldner, M.: Characteriza-tion of Saharan dust, marine aerosols and mixtures of biomass-burning aerosols and dust by means of multi-wavelength depolar-ization and Raman lidar measurements during SAMUM 2, Tel-lus B, 63, 706–724, 2011.
Hamonou, E., Chazette, P., Balis, D., Dulac, F., Schneider, X., Galani, E., Ancellet, G., and Papayannis, A.: Characteri-zation of the vertical structure of Saharan dust export to the Mediterranean Basin, J. Geophys. Res., 104, 22257, doi:10.1029/1999JD900257, 1999.
Holben, B. N., Eck, T. F., Slutsker, I., Tanré, D., Buis, J. P., Set-zer, A., Vermote, E. F., Reagan, J. A., Kaufman, Y. J., Naka-jima, T., Lavenu, F., Jankowiak, I., and Smirnov, A.: AERONET – a federated instrument network and data archive for aerosol characterization, Remote Sens. Environ., 66, 1–16, 1998.
IPCC: Climate Change 2014: Impacts, Adaptation, and Vulnerabil-ity. Part A: Global and Sectoral Aspects. Contribution of Work-ing Group II to the Fifth Assessment Report of the Intergovern-mental Panel on Climate Change, edited by: Field, C. B., Bar-ros, V. R., Dokken, D. J., Mach, K. J., Mastrandresa, M. D., Bilir, T. E., Chatterjee, M., Ebi, K. L., Estrada, Y. O., Gen-ova, R. C., Girma, B., Kissel, E. S., Levy, A. N., MacCracken, S., Mastrandrea, P. R., and White, L. L., Cambridge University Press, Cambridge, UK and new York, NY, USA, 1132 pp., 2014. Kim, S.-W., Berthier, S., Raut, J.-C., Chazette, P., Dulac, F., and Yoon, S.-C.: Validation of aerosol and cloud layer struc-tures from the space-borne lidar CALIOP using a ground-based lidar in Seoul, Korea, Atmos. Chem. Phys., 8, 3705–3720, doi:10.5194/acp-8-3705-2008, 2008.
King, M. D., Kaufman, Y. J., Menzel, P., and Tanré, D.: Remote-sensing of cloud, aerosol, and water-vapor properties from the Moderate Resolution Imaging Spectroradiometer (MODIS), IEEE T. Geosci. Remote, 30, 2–27, 1992.
Klett, J. D.: Lidar inversion with variable backscatter/extinction ra-tios, Appl. Optics, 24, 1638, doi:10.1364/AO.24.001638, 1985. Lelieveld, J., Berresheim, H., Borrmann, S., Crutzen, P. J.,
Dentener, F. J., Fischer, H., Feichter, J., Flatau, P. J., He-land, J., Holzinger, R., Korrmann, R., Lawrence, M. G., Levin, Z., Markowicz, K. M., Mihalopoulos, N., Minikin, A., Ramanathan, V., de Reus, M., Roelofs, G. J., Scheeren, H. A., Sciare, J., Schlager, H., Schultz, M., Siegmund, P., Steil, B., Stephanou, E. G., Stier, P., Traub, M.,Warneke, C., Williams, J., and Ziereis, H.: Global air pollution crossroads over the Mediter-ranean, Science, 298, 794–799, 2002.
Levin, Z., Teller, A., and Ganor, E.: On the interactions of mineral dust, sea-salt particles, and clouds: a measurement and modeling study from the Mediterranean Israeli Dust Experiment campaign, J. Geophys. Res., 110, D05207, doi:10.1029/2005JD005810, 2005.
Mallet, M., Dulac, F., Formenti, P., Nabat, P., Sciare, J., Roberts, G., Pelon, J., Ancellet, G., Tanré, D., Parol, F., Denjean, C., Brogniez, G., di Sarra, A., Alados-Arboledas, L., Arndt, J., Au-riol, F., Blarel, L., Bourrianne, T., Chazette, P., Chevaillier, S., Claeys, M., D’Anna, B., Derimian, Y., Desboeufs, K., Di Iorio, T., Doussin, J.-F., Durand, P., Féron, A., Freney, E., Gaimoz, C., Goloub, P., Gómez-Amo, J. L., Granados-Muñoz, M. J., Grand, N., Hamonou, E., Jankowiak, I., Jeannot, M., Léon, J.-F., Maillé, M., Mailler, S., Meloni, D., Menut, L., Momboisse, G., Nico-las, J., Podvin, T., Pont, V., Rea, G., Renard, J.-B., Roblou, L., Schepanski, K., Schwarzenboeck, A., Sellegri, K., Sicard, M., Solmon, F., Somot, S., Torres, B, Totems, J., Triquet, S., Verdier, N., Verwaerde, C., Waquet, F., Wenger, J., and Zapf, P.: Overview of the Chemistry-Aerosol Mediterranean Exper-iment/Aerosol Direct Radiative Forcing on the Mediterranean Climate (ChArMEx/ADRIMED) summer 2013 campaign, At-mos. Chem. Phys., 16, 455–504, doi:10.5194/acp-16-455-2016, 2016.
Moulin, C., Lambert, C. E., Dayan, U., Masson, V., Ramonet, M., Bousquet, P., Legrand, M., Balkanski, Y. J., Guelle, W., Marti-corena, B., Bergametti, G., and Dulac, F.: Satellite climatology of African dust transport in the Mediterranean atmosphere, J. Geo-phys. Res., 103, 13137–13144, 1998.
Müller, D., Mattis, I., Ansmann, A., Wandinger, U., Ritter, C., and Kaiser, D.: Raman lidar observations of aged Siberian and
Cana-dian forest fire smoke in the free troposphere over Germany in 2003: Microphysical particle characterization, J. Geophys. Res., 110, D17201, doi:10.1029/2004JD005756, 2005.
Müller, D., Ansmann, A., Mattis, I., Tesche, M., Wandinger, U., Althausen, D., and Pisani, G.: Aerosol-type-dependent lidar ra-tios observed with Raman lidar, J. Geophys. Res.-Atmos., 112, D16202, doi:10.1029/2006JD008292, 2007.
Nabat, P., Somot, S., Mallet, M., Chiapello, I., Morcrette, J. J., Solmon, F., Szopa, S., Dulac, F., Collins, W., Ghan, S., Horowitz, L. W., Lamarque, J. F., Lee, Y. H., Naik, V., Na-gashima, T., Shindell, D., and Skeie, R.: A 4-D climatology (1979–2009) of the monthly tropospheric aerosol optical depth distribution over the Mediterranean region from a comparative evaluation and blending of remote sensing and model products, Atmos. Meas. Tech., 6, 1287–1314, doi:10.5194/amt-6-1287-2013, 2013.
Nabat, P., Somot, S., Mallet, M., Michou, M., Sevault, F., Driouech, F., Meloni, D., di Sarra, A., Di Biagio, C., Formenti, P., Sicard, M., Léon, J.-F., and Bouin, M.-N.: Dust aerosol radiative effects during summer 2012 simulated with a coupled regional aerosol-atmosphere-ocean model over the Mediterranean, Atmos. Chem. Phys., 15, 3303–3326, doi:10.5194/acp-15-3303-2015, 2015. Nisantzi, A., Mamouri, R. E., Ansmann, A., and Hadjimitsis, D.:
Injection of mineral dust into the free troposphere during fire events observed with polarization lidar at Limassol, Cyprus, Atmos. Chem. Phys., 14, 12155–12165, doi:10.5194/acp-14-12155-2014, 2014.
Papayannis, A., Amiridis, V., Mona, L., Tsaknakis, G., Balis, D., Bösenberg, J., Chaikovski, A., De Tomasi, F., Grigorov, I., Mattis, I., Mitev, V., Müller, D., Nickovic, S., Pérez, C., Pietruczuk, A., Pisani, G., Ravetta, F., Rizi, V., Sicard, M., Trickl, T., Wiegner, M., Gerding, M., Mamouri, R. E., D’Amico, G., and Pappalardo, G.: Systematic lidar ob-servations of Saharan dust over Europe in the frame of EARLINET (2000–2002), J. Geophys. Res., 113, D10204, doi:10.1029/2007JD009028, 2008.
Paronis, D., Dulac, F., Chazette, P., Hamonou, E., and Liberti, G. L.: Aerosol optical thickness monitoring in the Mediterranean, J. Aerosol Sci., 29, S671–S672, 1998.
Randriamiarisoa, H., Chazette, P., and Megie, G.: Re-trieving the aerosol single-scattering albedo from the NO2 photolysis rate coefficient, Tellus B, 56, 118–127, doi:10.3402/tellusb.v56i2.16408, 2004.
Raut, J.-C. and Chazette, P.: Radiative budget in the presence of multi-layered aerosol structures in the framework of AMMA SOP-0, Atmos. Chem. Phys., 8, 6839–6864, doi:10.5194/acp-8-6839-2008, 2008.
Royer, P., Chazette, P., Lardier, M., and Sauvage, L.: Aerosol con-tent survey by mini N2-Raman lidar: application to local and long-range transport aerosols, Atmos. Environ., 45, 7487–7495, 2011.
Salmonson, V. V., Barnes, W. L., Maymon, P. W., Montgomery, H. E. and Ostrow, H.: MODIS: Advanced Facility Instrument for Studies of the Earth as a System, IEEE Trans. Geosci. Remote Sens., 27, 145–153, 1989.
Tesche, M., Gross, S., Ansmann, A., Müller, D., Althausen, D., and Freudenthaler, V., and Esselborn, M.: Profiling of Saha-ran dust and biomass-burning smoke with multiwavelength po-larization Raman lidar at Cape Verde, Tellus B, 63, 649–676, doi:10.1111/j.1600-0889.2011.00548.x, 2011.
Thieuleux, F., Moulin, C., Bréon, F. M., Maignan, F., Poitou, J., and Tanré, D.: Remote sensing of aerosols over the oceans using MSG/SEVIRI imagery, Ann. Geophys., 23, 3561–3568, doi:10.5194/angeo-23-3561-2005, 2005.
Thomason, L. W., Pitts, M. C., and Winker, D. M.: CALIPSO obser-vations of stratospheric aerosols: a preliminary assessment, At-mos. Chem. Phys., 7, 5283–5290, doi:10.5194/acp-7-5283-2007, 2007.
Vaughan, M. A., Young, S. A., Winker, D. M., Powell, K. A., Omar, A. H., Liu, Z., Hu, Y., and Hostetler, C. A.: Fully au-tomated analysis of space-based lidar data: an overview of the CALIPSO retrieval algorithms and data products, Proc. SPIE Int. Soc. Opt. Eng., 5575, 16–30, doi:10.1117/12.572024, 2004.