HAL Id: hal-01120307
https://hal.sorbonne-universite.fr/hal-01120307
Submitted on 25 Feb 2015HAL is a multi-disciplinary open access archive for the deposit and dissemination of sci-entific research documents, whether they are pub-lished or not. The documents may come from teaching and research institutions in France or abroad, or from public or private research centers.
L’archive ouverte pluridisciplinaire HAL, est destinée au dépôt et à la diffusion de documents scientifiques de niveau recherche, publiés ou non, émanant des établissements d’enseignement et de recherche français ou étrangers, des laboratoires publics ou privés.
Characteristics of colored dissolved organic matter
(CDOM) in the Western Arctic Ocean: relationships
with microbial activities
Atsushi Matsuoka, Eva Ortega-Retuerta, Annick Bricaud, Kevin R Arrigo,
Marcel Babin
To cite this version:
Atsushi Matsuoka, Eva Ortega-Retuerta, Annick Bricaud, Kevin R Arrigo, Marcel Babin. Character-istics of colored dissolved organic matter (CDOM) in the Western Arctic Ocean: relationships with microbial activities. Deep Sea Research Part II: Topical Studies in Oceanography, Elsevier, 2015, 118 (Part A), pp.44-52. �10.1016/j.dsr2.2015.02.012�. �hal-01120307�
1
Characteristics of colored dissolved organic matter (CDOM) in the Western Arctic 1
Ocean: relationships with microbial activities 2 3 Atsushi Matsuoka1,2,3* 4 * Corresponding author 5 6
Affiliation 1: Takuvik Joint International Laboratory, Département de Biologie, Université Laval, 7
1045, avenue de la Médecine, Québec, QC, G1V 0A6, Canada 8 E-mail : [email protected] 9 Phone : +1 (418) 656 2131 10 Fax : +1 (418) 656 2339 11 12
Affiliation 2: Takuvik Joint International Laboratory, CNRS, 1045, avenue de la Médecine, 13
Québec, QC, G1V 0A6, Canada 14
15
Affiliation 3: Laboratoire d’Océanographie de Villefranche, Université Pierre et Marie Curie 16
(Paris 6)/CNRS, B.P. 8, Villefranche-sur-Mer Cedex, 06238, France 17
18
Eva Ortega-Retuerta1,2,3 19
Affiliation 1: Dpt. Biologia Marina i Oceanografia, Institut de Ciències del Mar-CSIC, 08003 20 Barcelona, Spain 21 E-mail : [email protected] 22 Phone : +34 93 230 96 06 23 Fax : +34 93 230 95 55 24 25
Affiliation 2: Sorbonne Universités, UPMC Paris 06, UMR 7621, Laboratoired’Océanographie 26
2
Microbienne, Observatoire Océanologique, F-66650 Banyuls/mer, France 27
28
Affiliation 3 : CNRS, UMR 7621, Laboratoire d’Océanographie Microbienne, Observatoire 29
Océanologique, F-66650 Banyuls-sur-mer, France 30
31
Annick Bricaud1,2 32
Affiliation 1: Sorbonne Universités, UPMC Paris 06, UMR 7093, LOV, Observatoire 33
Océanographique, F-06230 Villefranche/mer, France 34 E-mail: [email protected] 35 Phone : +33 (0)4 93 76 37 13 36 Fax : +33 (0)4 93 76 37 39 37 38
Affiliation 2: CNRS, UMR 7093, LOV, Observatoire Océanographique, F-06230 39 Villefranche/mer, France 40 41 Kevin R. Arrigo 42
Affiliation: Department of Environmental Earth System Science, Stanford University, Stanford, 43 California, 94305, USA 44 E-mail : [email protected] 45 Phone : +1 (650) 723 3599 46 Fax : +1 (650) 498 5099 47 48 Marcel Babin1,2,3 49
Affiliation 1: Takuvik Joint International Laboratory, Département de Biologie, Université Laval, 50
1045, avenue de la Médecine, Québec, QC, G1V 0A6, Canada 51
E-mail : [email protected] 52
3 Phone : +1 (418) 656 2131 53 Fax : +1 (418) 656 2339 54 55
Affiliation 2: Takuvik Joint International Laboratory, CNRS, 1045, avenue de la Médecine, 56
Québec, QC, G1V 0A6, Canada 57
58
Affiliation 3: Laboratoire d’Océanographie de Villefranche, Université Pierre et Marie 59
Curie(Paris 6)/CNRS, B.P. 8, Villefranche-sur-Mer Cedex, 06238, France 60
61
Abstract 62
Colored dissolved organic matter (CDOM), a significant fraction of dissolved organic carbon 63
(DOC), plays various roles in physical and biogeochemical processes in natural waters. In the Arctic 64
Ocean, CDOM is abundant because of major input by large rivers. To better understand the 65
processes that drive variations in CDOM, light absorption coefficients of CDOM [aCDOM(λ), m-1]
66
were extensively documented together with temperature, salinity, chlorophyll a, nitrate 67
concentrations, and bacterial production (BP) and abundance (BA) in the Western Arctic Ocean 68
(WAO) from early to late summer as part of the MALINA and the ICESCAPE expeditions. The 69
data set covered contrasting situations, from bloom to post-bloom conditions and from river-70
influenced to oceanic water masses. While CDOM photobleaching occurred in the surface layer (< 71
20 m), we observed significantly lower spectral slopes for CDOM absorption spectra (SCDOM) in
72
addition to higher aCDOM(440) in the layer below (intermediate layer: 30.7 < salinity < 33.9). In
73
particular, the low SCDOM values were found in the Chukchi Sea and the western part of the Beaufort
74
Sea, which coincided with high BP and BA values. Considering the high primary production 75
observed in these areas during our cruises (Arrigo et al., 2012), we hypothesize that SCDOM
76
variations reflect the degradation of phytoplankton that is associated with heterotrophic bacterial 77
activity. In our datasets, a simple regression analysis showed that SCDOM was significantly correlated
4
with BP and BA. A principal component analysis further supported this conclusion. From our field 79
observations, it was shown that variations in aCDOM(440) and SCDOM result to a large extent from
80
bacterial activity, at least in the WAO. 81
1. Introduction 82
Examining the budget of dissolved organic carbon (DOC) in the Arctic Ocean is crucial to 83
improving our understanding of modifications in the carbon cycle resulting from ongoing global 84
warming. While this warming likely induces thawing of permafrost containing a huge amount of 85
DOC, which is subsequently delivered by river discharge into the Arctic Ocean (Peterson et al., 86
2002; McClelland et al., 2006; Raymond et al., 2007), the long-term trend in the DOC budget of the 87
Pan-Arctic Ocean has yet to be established. In recent studies, Matsuoka et al. (2013, 2014) 88
developed a semi-analytical algorithm to quantitatively estimate DOC concentrations for Arctic 89
coastal waters using satellite remote sensing data, which allows the continuous monitoring of 90
variability in DOC concentrations. In contrast, knowledge about the production and the removal 91
processes gained from field observations using traditional methods is limited temporally and 92
geographically (Bussmann, 1999; Garneau et al., 2008; Kirchman et al., 2009; Ortega-Retuerta et 93
al., 2012). This prevents us from understanding the balance between these processes. 94
Light absorption by the colored fraction of dissolved organic matter (CDOM) provides useful 95
information about biogeochemical processes (Carder et al., 1989; Nelson et al., 1998; Miller et al., 96
2002; Nelson et al., 2004, 2007; Matsuoka et al., 2012). While microbial activity is highly variable 97
in natural environments (e.g., Azam et al., 1983), the link between heterotrophic bacterial 98
production and CDOM absorption was reported in the Sargasso Sea (Nelson et al., 1998). More 99
recently, Matsuoka et al. (2012) suggested that lower spectral slopes of CDOM absorption spectra 100
observed in some Arctic Ocean water masses resulted from heterotrophic microbial activity. 101
However, a direct relationship between CDOM and bacteria has not been well documented. 102
The objective of this study is to examine the relationships between CDOM absorption properties 103
and heterotrophic bacterial production (BP) and abundance (BA) in the Western Arctic Ocean 104
5
(WAO) as well as their link with environmental variables (i.e., temperature, salinity, and nitrate and 105
chlorophyll a concentrations). 106
107
2. Datasets and methods 108
Data were collected during three cruises in the WAO (Figure 1): the joint France-Canada-USA 109
Arctic campaign, MALINA (30 July to 27 August 2009), and the National Aeronautics and Space 110
Administration (NASA) ICESCAPE cruises in 2010 and 2011 (referred to as ICESCAPE 2010: 15 111
June to 22 July 2010 and ICESCAPE 2011: 25 June to 29 July 2011, respectively). While waters in 112
the Mackenzie shelf-basin area during the MALINA cruise were oligotrophic and typical of post-113
bloom conditions (Ortega-Retuerta et al., 2012), waters in the Chukchi-Beaufort Seas during the 114
ICESCAPE cruises were highly productive (Arrigo et al., 2012). To examine the general 115
characteristics in the WAO, these three datasets were combined and used in this study. 116
Temperature and salinity profiles were obtained using a SBE-911 plus (Seabird) conductivity-117
temperature-depth (CTD) probe. Chlorophyll a (chl a) and phaeopigment concentrations (mg m-3) 118
were determined fluorometrically (Holm-Hansen et al., 1965). Nitrate concentrations (NO3, µmol
119
kg-1) were measured following Grasshoff et al. (1999) for MALINA and Armstrong et al. (1967) for 120
ICESCAPE cruises. Oxygen concentrations (Oxy, µmol kg-1) were measured following Carpenter 121
(1965) with modifications by Culberson et al. (1991). 122
Apparent oxygen utilization (AOU, µmol kg-1) was calculated by referring solubility of oxygen 123
for well-mixed winter waters having temperature and salinity of -1.8 °C and 31, respectively. These 124
reference data were proven to be valid for western Arctic waters (Matsuoka et al., 2012). 125
126
2.1. CDOM absorption 127
Details of the method used for measurement of CDOM absorption are documented in Matsuoka 128
et al. (2012). Briefly, water samples were filtered using 0.2 µm pore-size filters immediately after 129
sampling. Absorption coefficients of CDOM (aCDOM(λ), m-1) were determined from 200 to 735 nm
6
in 1-nm increments using a liquid waveguide system (UltraPath, World Precision Instruments, Inc.). 131
The spectral slope of aCDOM(λ) (SCDOM, nm-1) was calculated by nonlinear regression of the data
132
from 350 to 500 nm (Babin et al., 2003; Matsuoka et al., 2011, 2012). 133
A previous study (Helms et al., 2008) showed that the spectral slopes (S275-295 and S350-400, nm-1
134
for both) corresponding to two distinct wavelength ranges (i.e., 275-295 nm and 350-400 nm, 135
respectively) and their ratio (SR, dimensionless) provide insights into sources (e.g., marine or
136
terrestrial sources; Carder et al., 1989; Nelson et al., 2007) and/or local processes affecting the 137
CDOM distribution (e.g., lateral transport, vertical mixing, photo-bleaching, heterotrophic bacterial 138
alteration; Nelson et al., 1998, 2004; Matsuoka et al., 2012; Yamashita et al., 2013). These slope 139
parameters were calculated for our Arctic datasets by fitting a linear model to CDOM absorption 140
coefficients in the two distinct spectral ranges (Helms et al., 2008). 141
142
2.2. Bacterial abundance 143
Heterotrophic prokaryotes, including bacteria and archaea, are abbreviated throughout the 144
manuscript as “bacteria”. Samples were fixed with glutaraldehyde (0.25% final concentration) and 145
stored at -80ºC until processing. During MALINA, bacterial cells (BA) were counted aboard the 146
ship by flow cytometry using a FACS ARIA (Becton, Dickinson and company) equipped with 488 147
nm and 633 nm lasers and a standard filter setup (Ortega-Retuerta et al., 2012). During ICESCAPE 148
2010, bacterial cells were counted by flow cytometry at the home laboratory using a BD FACS 149
Calibur Flow Cytometer (Becton, Dickinson and company). During ICESCAPE 2011, bacterial 150
cells were counted aboard the ship using an Accuri C6 (Becton, Dickinson and company) equipped 151
with a 488 nm laser. In all cases, samples were thawed and SYBR Green-I was added at a final 152
dilution of 1:10,000. Samples were incubated in the dark for 15 min before analysis. Bacterial cells 153
were identified on a plot of green fluorescence (515-545 nm) versus right angle light scatter (SSC), 154
using the green fluorescence as a threshold parameter. High nucleic acid (HNA) and low nucleic 155
acid (LNA) bacteria were discriminated according to their green fluorescence and counted 156
7
separately (Marie et al., 1997). HNA cells have often been considered as active bacteria (Gasol et al., 157 1999). 158 159 2.3. Bacterial production 160
Bacterial production (BP) was measured following Ortega-Retuerta et al. (2012). Briefly BP was 161
measured by 3H-leucine incorporation (Smith and Azam, 1992). Samples (1.5 mL in triplicate plus 162
one killed control) were added to sterile microcentrifuge tubes, containing 20-30 nM [4,5-3 H]-163
leucine. This concentration was sufficient to saturate bacterial leucine uptake (data not shown). 164
Incorporation rates were measured after 2-h incubations at in situ temperature, and incubations were 165
stopped by the addition of trichloroacetic acid (5% final concentration). Leucine incorporation rates 166
were converted to carbon production using the conversion factor of 1.5 kg C produced per mole of 167
leucine incorporated (Kirchman, 1993), considering no isotope dilution. 168 169 2.4. Statistical analyses 170 2.4.1. Regression analysis 171
To examine a direct relationship between two variables, several regression analyses were 172
performed. Because the two variables were random (or not controlled), Model II regression was 173
applied in this study (Legendre and Legendre, 1998). 174
175
2.4.2. Principal component analysis 176
For a dataset containing several variables, a multiple regression analysis is not always the best 177
method for examining the relationships among the variables. Principal component analysis (PCA) is 178
preferable because it summarizes, in a few dimensions, most of the variability present in a 179
dispersion matrix of a large number of variables (Legendre and Legendre, 1998), and has been 180
applied to a large number of oceanographic studies (e.g., Legendre and Legendre, 1998; Uitz et al., 181
2008; Suzuki et al., 2012). We thus applied this method to our datasets. 182
8 183
2.5. Sea ice concentration 184
Daily sea ice concentrations data acquired by the Defense Meteorological Satellite Program 185
(DMSP) SSM/I passive microwave sensor (25-km spatial resolution) were downloaded from the 186
National Snow and Ice Data Center (NSIDC) at
187
ftp://sidads.colorado.edu/pub/DATASETS/nsidc0051_gsfc_nasateam_seaice/. Daily images (29 for 188
MALINA, 38 for ICESCAPE2010, and 35 for ICESCAPE2011) were averaged to generate an 189
image of mean sea ice concentrations for each cruise (Figure 2). 190
191
3. Results and discussion 192
3.1. Vertical distribution of CDOM 193
To examine the vertical distribution of CDOM absorption properties in the WAO, aCDOM(440)
194
and SCDOM were plotted against depth (Figure 3). At depth < 150 m, aCDOM(440) values were highly
195
variable for early to middle summer (ICESCAPE2010 and 2011 data: blue crosses and red 196
diamonds in Figure 3a and c). Values for late summer (MALINA data: black circles in Figure 3a), 197
however, were less variable and low near the surface (down to 0.0197 m-1), except for river waters 198
that showed significantly higher values (up to 1.08 m-1; see arrow in Figure 3a). At depth > 150 m, 199
all data tended to decrease with depth, approaching 0.0277 ± 0.0025 m-1 (dotted rectangle in Figure 200
3c). This type of profile was similar to that reported by Guéguen et al. (2012), who suggested that 201
the maximal values around 150 m are associated with microbial activity (see sections 3.3 and 3.4). 202
While determination of the origin of CDOM (e.g., production by phytoplankton, heterotrophic 203
bacteria, etc) is still challenging using our dataset alone, we acknowledge that phytoplankton 204
especially at the deep chlorophyll maximum is one of the CDOM sources (Matsuoka et al, 2012). 205
Similarly to aCDOM(440), SCDOM values for early-middle summer varied widely at depths < 150
206
m (Figure 3b). In contrast, those values showed less variability in late summer and were highest 207
near the surface (up to 0.022 nm-1; Figure 3b and d). At depths > 150 m, all SCDOM values
9
approached 0.0167 ± 0.0005 nm-1 with increasing depth (dotted rectangle in Figure 3d). 209
For surface waters, our results thus showed that aCDOM(440) values decreased in association with
210
increases in SCDOM from early to late summer (for up to 2.5 months). It is well known that as a
211
result of solar irradiation, high-weight molecules are transported into low-weight molecules that 212
absorb light in the shorter spectral wavelengths, a phenomenon called photo-bleaching. The spectral 213
slope therefore increases after the photo-bleaching (Twardowski and Donaghay, 2002). The 214
timescale is likely one to three months (Granskog et al., 2009). Satellite-derived sea ice 215
concentration images further showed that surface waters at most of our sampling stations were ice-216
free and therefore exposed to solar irradiation (Figure 2). All these results demonstrate photo-217
bleaching occurred during our observations. 218
For deep waters, CDOM absorption properties were stable (Figure 3a and b). Because CDOM in 219
these waters is considered to be biologically unavailable or refractory, those absorption values can 220
be considered as an end-member for refractory CDOM. If so, the proportion of CDOM lability 221
could be optically quantified when the other end-member from labile CDOM is obtained. Further 222
work is necessary to examine this issue. 223
224
3.2. Relationship between CDOM and hydrography 225
Because salinity can be a good proxy of Arctic Ocean hydrography (e.g., Carmack et al., 1989; 226
Macdonald et al., 1989; Matsuoka et al., 2012), relationships between CDOM absorption properties 227
(i.e., aCDOM(440) and SCDOM) and salinity were examined (Figure 4). At salinity < 28, two types of
228
waters were distinguished: 1) river waters with a strong negative correlation between aCDOM(440)
229
and salinity and 2) ice-melt waters showing both low aCDOM(440) and salinity (Figure 4a; see also
230
Matsuoka et al., 2012). These waters were observed in the Mackenzie shelf-basin area in the late 231
summer (black circles: MALINA cruise); river waters samples were collected in the Mackenzie 232
River mouth, while ice melt waters samples were taken near the sea ice, far away from the river 233
mouth (> 300 km). Data points at salinities < 28 located in the Chukchi-Beaufort Seas in mid-234
10
summer (red diamonds: ICESCAPE 2011 cruise) were not far away from the negative aCDOM(440)
235
versus salinity relationship for MALINA cruise (Figures 4a and b). In this salinity range, SCDOM
236
exhibited low variability (0.0196 ± 0.0011; Figure 4b), which is consistent with the value reported 237
by Matsuoka et al. (2012) (0.0192 ± 0.0011). 238
At salinities > 28, aCDOM(440) values for the MALINA cruise tended to be lower than those for
239
the ICESCAPE 2010&2011 cruises (early-middle summer) conducted in the Chukchi-Beaufort Seas 240
(Figure 4c). This was especially true in the surface layer (i.e., 28 < salinity < 30.7), where the lower 241
aCDOM(440) values for the MALINA cruise corresponded to slightly but significantly higher SCDOM
242
values (0.0189 ± 0.0006) compared to those for the ICESCAPE 2010&2011 cruises (0.0182 ± 243
0.0004 and 0.0183 ± 0.0012, respectively) (T-test, p < 0.0001; Figure 4c and d), which suggests 244
that photo-bleaching occurred from early-middle to late summer (Nelson et al., 1998; Twardowski 245
and Donaghay, 2002, Matsuoka et al., 2011; see also Figure 3). In other words, CDOM in the 246
Chukchi-Beaufort Seas observed during the early-middle summer cruises might have been 247
relatively new because of in situ production and/or input from the Bering Sea (Matsuoka et al., 248
2011; Shen et al., 2012). 249
The negative relationship between aCDOM(440) and salinity in the Lower Halocline Water (LHW:
250
33.9 < salinity < 34.7) and Atlantic Layer (AL: salinity > 34.7; our water samples were always 251
collected at depths shallower than 850 m) was very similar among cruises (Figure 4c). This 252
relationship was likely stable across ice-free seasons and areas of the WAO. So the aCDOM(440)
253
versus salinity relationship could be specific to these waters. 254
In the intermediate layer between the surface and the LHW+AL layers (i.e., 30.7 < salinity < 255
33.9), aCDOM(440) values for the ICESCAPE 2010&2011 cruise in the Chukchi-Beaufort Seas were
256
significantly higher than those for MALINA in the Mackenzie shelf-basin area (T-test, p < 0.0001). 257
Correspondingly, SCDOM values in the intermediate layer were much lower for the ICESCAPE
258
2010&2011 cruises than for the MALINA cruise (T-test, p < 0.0001; Figure 4d). Based on field 259
observations, Nelson et al. (1998) suggested that bacteria produce CDOM when taking up dissolved 260
11
organic carbon (DOC), which is also consistent with results from laboratory experiments. Moran et 261
al. (2000), Helms et al. (2008), and Ortega-Retuerta et al. (2009) observed that heterotrophic 262
bacterial activity is associated with a decrease in the spectral slope of CDOM absorption over time. 263
Note, however, that this result is contrary to the one obtained by Nelson et al., 2004. This contrast 264
might originate from differences in substrate of organic matter utilized by bacteria and/or in distinct 265
bacterial assemblages. Considering these findings, we hypothesized that the significantly low SCDOM
266
values observed in this study are associated with heterotrophic microbial activity. 267
To test this hypothesis, a vertical section of CDOM absorption properties, as well as salinity and 268
phaeopigments in the intermediate layer (i.e., 30.7 < salinity < 33.9), along the transect from the 269
Kotzebue Sound (KS) to the Chukchi Hotspot (CH) was further analyzed (Figure 5). The transect 270
covered both river-influenced and biologically productive areas sampled during the ICESCAPE 271
2010 cruise (see Figure 1 for location). Waters showing high aCDOM(440) and low salinity values
272
were observed in the surface layer of the KS, indicating river-influenced waters (Figure 5a and b). 273
Further offshore, this trend was no longer observed in the surface layer of the CH. Relatively high 274
aCDOM(440) values, corresponding to significantly low SCDOM values, were observed near the bottom
275
of the CH. Interestingly, the low SCDOM values were associated with high concentrations of
276
phaeopigments (r2= 0.70, p < 0.0001; Figure 5c and d); BP measurements are not shown here 277
because of the limited number of data points along this transect. Because phaeopigments reflect 278
degradation products of phytoplankton intermediated by bacteria, this result partly supports our 279
hypothesis that both the high aCDOM(440) and low SCDOM values observed in this study resulted from
280
heterotrophic microbial activity. 281
282
3.3. Relationship between the spectral slope of CDOM absorption and bacteria 283
To examine the direct relationship between the spectral slope of CDOM absorption and bacteria, 284
SCDOM was regressed against BP and BA (Figure 6; chl a concentrations, temperature and nitrate
285
concentrations were also regressed against SCDOM). There was a weak but significant negative
12
correlation between BP and SCDOM (Figure 6a; r2 = 0.20, p < 0.0001). The coefficient of
287
determination for this relationship was the second highest following the BP versus chl a relationship 288
(r2 = 0.24, p < 0.0001; Table 1). Temperature showed the third highest correlation with slightly 289
lower coefficient of determination (r2 = 0.18, p < 0.0001). Significant correlations were not found 290
for BP versus salinity or nitrate concentrations. 291
SCDOM was negatively correlated with BA (Figure 6b; r2 = 0.26, p < 0.0001). The coefficient of
292
determination for this relationship was the highest, followed by BA versus chl a (r2 = 0.22, p < 293
0.0001; Table 1). Similarly to BP, temperature showed the third highest correlation with BA (r2 = 294
0.17, p < 0.0001). No significant correlations were found between BA and either salinity or NO3
295
concentration. These results suggest that low SCDOM values were generally associated with high BP
296
and BA in our environments. 297
A similar regression analysis was performed for the spectral parameters S275-295, S350-400, and SR,
298
as done by Helms et al. (2008). Although results using S350-400 were similar to those using SCDOM
299
(Table 2), none of them revealed higher correlations with BP and BA than SCDOM; SCDOM is a better
300
variable to reflect bacterial activity. 301
302
3.4. Multiple relationships among variables 303
To examine relationships among several variables, a PCA analysis was performed. The extracted 304
axes of the PCA (Figure 7) can be interpreted as follows. Principal Component 1 (PC1) made the 305
largest contribution, explaining 30.9 % of total variance. The positive component was strongly 306
related to chl a, aCDOM(440), BA, and BP and had a weak relationship with temperature and salinity.
307
Thus, the positive PC1 was considered to reflect production of organic matter. More interestingly, 308
SCDOM alone showed the opposite trend compared to the above-mentioned variables (i.e., production
309
of organic matter), suggesting that negative PC1 might reflect the decomposition of organic matter. 310
Principal Component 2 (PC2) explained 21.4 % of total variance. The negative component was 311
strongly related to NO3 concentration and apparent oxygen utilization (AOU) and was weakly
13
related to salinity. NO3 and AOU were tightly correlated, consistent with recent findings by
313
Matsuoka et al. (2012) for these two variables in the salinity range of 30.7-33.9 (or approximately 314
50-200 m depth; see their Figures 3c and d). Thus, negative PC2 was considered to reflect the 315
aphotic zone. In contrast, the positive PC2 might reflect the euphotic zone, which is further 316
supported by the fact that this component was weak but related to the production of organic matter. 317
Note that result of salinity in the PCA analysis is not surprising and can be explained as follows. 318
First, salinity exhibited an opposite trend compared to that shown by SCDOM. This general trend is
319
shown in Figure 4. Second, this variable had a negative direction in PC2. This result is consistent 320
with our discussion that negative PC2 represents the aphotic zone, showing higher salinity. 321
Furthermore, Figure 7 provides important information: Because only SCDOM showed opposite
322
direction compared to parameters related to production of organic matter, this variable might be 323
considered to reflect the degradation products of organic matter. 324
As expected, SCDOM was negatively correlated with BP and BA (Figure 6), which is consistent
325
with the result of simple regression analysis (Figure 6 and Table 1). Similarly, SCDOM was negatively
326
correlated with chl a and phaeopigments (p < 0.0001 for both). By taking into account the findings 327
in Figures 5-7, our results suggest that variations in SCDOM reflect the degradation of phytoplankton
328
that is associated with heterotrophic bacterial activity. 329
330
4. Conclusions 331
This study demonstrated that variations in the spectral slope pf CDOM absorption (SCDOM) are
332
partly explained by bacterial production (BP) and bacterial abundance (BA) variations. A simple 333
regression analysis showed that SCDOM was related to both BA and BP, which was further supported
334
by PCA analysis. Bacterial abundance and production is likely dependent on bioavailability of 335
DOM (e.g., Moran et al., 2000; Helms et al., 2008; Ortega-Retuerta et al., 2009). The spectral slope 336
of CDOM reflects to some extent the level of DOC availability (Moran et al., 2000; Helms et al., 337
2008; Ortega-Retuerta et al., 2009). Therefore, it is consistent that SCDOM is significantly correlated
14
with bacterial activity. Further work is necessary to better understand changes in CDOM cycling in 339
the Arctic Ocean. 340
341
Acknowledgements 342
We are grateful to the captain and crews of the Canadian Icebreaker CCGS Amundsen and the 343
US icebreaker USCGC Healy. CTD deployment and data processing were made by Y. Gratton, L. 344
Prieur, and C. Marec for MALINA and J. Swift and R. S. Pickart for ICESCAPE cruises. Water 345
samples from a small boat were provided by S. B. Hooker. Fluorometric chlorophyll a 346
concentrations were measured by S. Bélanger and A. Mignot for MALINA and K. R. Arrigo, M. 347
Mills, G. van Dijken, Z. Brown, M. Palmer, and K. Lowry for ICESCAPE cruises. Nitrate 348
concentrations were provided by J. E. Tremblay, P. Raimbault, N. Garcia, and J. Gagnon for 349
MALINA and S. Becker for ICESCAPE cruises. Technical supports by Q. Allison, S. Tolley, S. 350
Hiller, S. Laney, and S. Roberts are much appreciated. Bacterial abundance and production data 351
during MALINA were kindly provided by D. Marie, F. Joux and W.H. Jeffrey. Comments from two 352
anonymous reviewers greatly improved the manuscript. This study was conducted as part of the 353
MALINA Scientific Program funded by ANR (Agence nationale de la recherche), INSU-CNRS 354
(Institut national des sciences de l'univers – Centre national de la recherche scientifique), CNES 355
(Centre national d'études spatiales) and ESA (European Space Agency). This research was also 356
supported by the Ocean Biology and Biogeochemistry Program and the Cryosphere Science 357
Program of the National Aeronautic and Space Administration (NNX10AF42G to K. Arrigo). We 358
also thank a joint contribution to the research programs of UMI Takuvik, ArcticNet (Network 359
Centres of Excellence of Canada) and the Canada Excellence Research Chair in Remote Sensing of 360
Canada's New Arctic Frontier. 361
362
References 363
Armstrong, F.A. Stearns, J., C. R., and Strickland, J. D. H., 1967, The measurement of upwelling 364
15
and subsequent biological processes by means of the Technicon AutoAnalyzer™ and 365
associated equipment. Deep-Sea Res. 14(3): 381-389. 366
Arrigo, K. R., Perovich, D.K., Pickart, R.S., Brown, Z.W., van Dijken, G.L., Lowry, K.E., Mills, 367
M.M., Palmer, M.A., Balch, W.M., Bahr, F., Bates, N.R., Benitez-Nelson, C., Bowler, B., 368
Brownlee, E., Ehn, J.K., Frey, K.E., Garley, R., Laney, S.R., Lubelczyk, L., Mathis, J., 369
Matsuoka, A., Mitchell, B.G., Moore, G.W.K., Ortega-Retuerta, E., Pal, S., Polashenski, 370
C.M., Reynolds, R.A., Schieber, B., Sosik, H.M., Stephens, M., and Swift, J.H., 2012, 371
Massive Phytoplankton Blooms Under Arctic Sea Ice, Science, 10.1126/science.1215065. 372
Azam, F., Fenchel, T., Field, J.G., Gray, J.S., Meyer-Rei, L.A., and Thingstad F., 1983, The 373
Ecological Role of Water-Column Microbes in the Sea, Mar. Ecol. Prog. Ser., 10, 257-263. 374
Babin, M., Stramski, D., Ferrari, G. M., Claustre, H., Bricaud, A., Obolensky, G., and Hoepffner, 375
N., 2003, Variations in the light absorption coefficients of phytoplankton, nonalgal particles, 376
and dissolved organic matter in coastal waters around Europe, J. Geophys. Res., 108, 377
doi:10.1029/2001JC00082. 378
Bussmann, I., 1999, Bacterial utilization of humic substances from the Arctic Ocean, Aquat. Microb. 379
Ecol., 19, 37-45. 380
Carmack, E.C., Macdonald, R.W., and Papadakis, J.E., 1989, Water mass structure and boundaries 381
in the Mackenzie shelf estuary, J. Geophys. Res., 94, 18043–18055. 382
Carder, K.L., Steward, R.G., Harvey, G.R., and Ortner, P.B., 1989, Marine humic and fulvic 383
acids: Their effects on remote sensing of ocean chlorophyll, Limnol. Oceanogr., 34, 68–81. 384
Carpenter, J.H., 1965, The accuracy of the Winkler method for dissolved oxygen, Limnol. 385
Oceanogr., 10, 135-140. 386
Culberson, C.H., 1991, Dissolved Oxygen, WHP Operations and Methods, Unpublished manuscript, 387
15 pp. 388
Ducklow, H.W., 1992, Factors regulating bottom-up control of bacterial biomass in open ocean 389
plankton communities, Ergeb. Limnol., 37, 207–217. 390
16
Garneau, M.-E., Roy S., Lovejoy, C., Gratton, Y., and Vincent W.F., 2008, Seasonal dynamics of 391
bacterial biomass and production in a coastal arctic ecosystem: Franklin Bay, western 392
Canadian Arctic, J. Geophys. Res., 113, C07S91, doi:10.1029/2007JC004281. 393
Gasol, J.M., Zweifel, U.L., Peters, F., Fuhrman, J.A., Hagstrom, A., 1999, Significance of size and 394
nucleic acid content heterogeneity as measured by flow cytometry in natural planktonic 395
bacteria. Appl. Environ. Microbiol. 65, 4475-4483. 396
Guéguen, C. McLaughlin, F. A., Carmack, E. C., Itoh, M. Narita, H., and Nishino, S., 2012, The 397
nature of colored dissolved organic matter in the southern Canada Basin and East Siberian 398
Sea, Deep-Sea Res., II, 81-84, 102-113. 399
Granskog, M., Macdonald, R. W., Kuzyk, Z. Z. A., Senneville, S., Mundy, C.-J., Barber, D., Stern, 400
G. A., and Saucier, F., 2009, Coastal conduit in southwestern Hudson Bay (Canada) in 401
summer: Rapid transit of freshwater and significant loss if colored dissolved organic matter, 402
J. Geophys. Res., 114, C08012, doi:10.1029/2009JC005270. 403
Grasshoff, K., Kremling, K. and Ehrhardt, M. (Eds.), 1999, Methods of seawater analysis, New 404
York, Wiley-VCH. 405
Helms, J.R., Stubbins, A., Ritchie, J.D., Minor, E.C., Kieber, D. J., and Mopper, K., 2008, 406
Absorption spectral slopes and slope ratios as indicators of molecular weight, sources, and 407
photobleaching of chromophoric dissolved organic matter, Limnol. Oceangr., 53, 955– 408
969. 409
Holm-Hansen, O., Lorenzen, C.J., Holmes, R.W., and Strickland, J.D.H., 1965, Fluorometric 410
Determination of Chlorophyll, J. Cons. perm. int. Explor. Mer., 30, 3-15. 411
Kirchman, D.L., Moran, X.A.G., and Ducklow, H., 2009, Microbial growth in the polar oceans – 412
role od temperature and potential impact of climate change, Nature Rev., 7, 451-459. 413
Kirchman, D.L., 1993, Leucine incorporation as a measure of biomass production by heterotrophic 414
bacteria, in: PF, K. (Ed.), Handbook of methods in aquatic microbial ecology. Lewis 415
Publishers, Boca Raton, pp. 509-512. 416
17
Legendre, P., and Legendre, L., 1998, Numerical Ecology, New York. 417
Marie, D., Partensky, F., Jacquet, S., Vaulot, D., 1997, Enumeration and cell cycle analysis of 418
natural populations of marine picoplankton by flow cytometry using the nucleic acid stain 419
SYBR Green I. Appl. Environ. Microbiol. 63, 186-193. 420
Matsuoka, A., Bricaud, A., Benner, R., Para, J., Sempere, R., Prieur, L., Bélanger, S., and Babin, M., 421
2012, Tracing the transport of colored dissolved organic matter in water masses of the 422
Southern Beaufort Sea: relationship with hydrographic characteristics, Biogeosciences, 9, 423
doi: 10.5194/bg-9-925-2012. 424
Matsuoka, A., Hill, V., Huot, Y., Bricaud, A., and Babin, M., 2011, Seasonal variability in the light 425
absorption properties of western Arctic waters: parameterization of the individual 426
components of absorption for ocean color applications, J. Geophys. Res., 116, 427
doi:10.1029/2009JC005594. 428
Matsuoka, A., Hooker, S.B., Bricaud, A., Gentili, B., and Babin, M., 2013, Estimating absorption 429
coefficients of colored dissolved organic matter (CDOM) using a semi-analytical algorithm 430
for southern Beaufort Sea waters: applications to deriving concentrations of dissolved 431
organic carbon from space, Biogensciences, 10, doi: 10.5194/bg-10-917-2013. 432
Matsuoka, A., Babin, M., Doxaran, D., Hooker, S.B., Mitchell, B.G., Bélanger, S., and Bricaud, A., 433
2014, A systhesis of light absorption properties of the Arctic Ocean: application to semi-434
analytical estimates of dissolved organic carbon concentrations from space, Biogeosci., 11, 435
3131-3147, doi:10.5194/bg-11-3131-2014. 436
Macdonald, R.W., Carmack, E.C., McLaughlin, F.A., Iseki, K., Macdonald, D.M., and O’Brien, 437
M.C., 1989, Composition and modification of water masses in the Mackenzie shelf estuary, 438
J. Geophys. Res., 94, 18057–18070. 439
McClelland, J.W., Déry, S.J., Peterson, B.J., Holmes, R.M., and Wood, E.F., 2006, A pan-arctic 440
evaluation of changes in river discharge during the latter half of the 20th century, Geophys. 441
Res. Lettr., 33, L06715, doi:10.1029/2006GL025753. 442
18
Moran, M.A., Sheldon, W. M. Jr., and Zepp, R. G., 2000, Carbon loss and optical property changes 443
during long-term photochemical and biological degradation of estuarine dissolved organic 444
matter, Limnol. Oceanogr., 45(6), 1254-1264. 445
Miller, W.L., Moran, M.A., Sheldon, W.M., Zepp, R.G., and Opsahl, S., 2002, Determination of 446
apparent quantum yield spectra for the formation of biologically labile photoproducts, 447
Limnol. Oceanogr., 47, 343–352. 448
Nelson, N.B., Siegel, D.A., Michaels, A.F., 1998, Seasonal dynamics of colored dissolved 449
material in the Sargasso Sea, Deep Sea Research Part 1, 45, 931-957. 450
Nelson, N. B., Carlson, C. A., and Steinberg, D. K., 2004, Production of chromophoric dissolved 451
organic matter by Sargasso Sea microbes, Mar. Chem., 89, 273-287. 452
Nelson, N.B., Siegel, D.A., Carlson, C.A., Swan, C., Smethie, W.M. Jr., and Khatiwala, S., 2007, 453
Hydrography of chromophoric dissolved organic matter in the North Atlantic, Deep Sea 454
Research Part 1, 54, 710-731. 455
Ortega-Retuerta, E., Jeffrey, W.H., Babin, M., Bélanger, S., Benner, R., Marie, D., Matsuoka, A., 456
Raimbault, P., and Joux, F., 2012, Carbon fluxes in the Canadian Arctic: patterns and 457
drivers of bacterial abundance. Production and respiration on the Beaufort Sea margin, Bio 458
geosci., 9, 3679-3692. 459
Ortega-Retuerta, E., Frazer, T.K., Duarte, C.M., Ruiz-Halpern, S., Tovar-Sanchez, A., Arrieta, J.M., 460
and Reche, I., 2009, Biogeneration of chromophoric dissolved organic matter by bacteria 461
and krill in the Southern Ocean, Limnol. Oceanogr., 54(6), 1941-1950. 462
Peterson, B.J., Holmes, R.M., McClelland, J.W., Vorosmarty, C.J., Lammers, R.B., Shiklomanov, 463
A.I., Shiklomanov, I.A., and Rahmstorf, S., 2002, Increasing river discharge to the Arctic 464
Ocean, Science, 298, 2171-2173. 465
Raymond, P.A., McClelland, J.W., Holmes, R.M., Zhulidov, A.V., Mull, K., Peterson, B.J., Striegl, 466
R.G., Aiken, G.R., and Gurtovaya T.Y., 2007, Flux and age of dissolved organic carbon 467
exported to the Arctic Ocean: A carbon isotopic study of the five largest arctic rivers, 468
19
Global. Biogeochem. Cycles., 21, GB4011, doi:10.1029/2007GB002934. 469
Shen, Y., Fichot, C.G., and Benner, R., 2012, Dissolved organic matter composition and 470
bioavailability reflect ecosystem productivity in the Western Arctic Ocean, Biogeosci., 9, 471
4993-5005. 472
Smith, D.C., Azam, F., 1992, A simple, economical method for measuring bacterial protein 473
synthesis rates in seawater using 3H-leucine. Mar Microb Food Webs 6, 107-114. 474
Suzuki, K.W., Kasai, A., Nakayama, K., and Tanaka, M., 2012, Year-round accumulation of 475
particulate organic matter in the estuarine turbidity maximum: comparative observations in 476
three macrotidal estuaries (Chikugo, Midori, and Kuma Rivers), southwestern Japan, J. 477
Oceanogr., 68, 453-471. 478
Twardowski, M.S., and Donaghay, P.L., 2002, Photobleaching of aquatic dissolved materials: 479
Absorption removal, spectral alteration, and their interrelationship, J. Geophys. Res., 480
107(C8), 3091, 10.1029/1999JC000281. 481
Uitz, J., Huot, Y., Bruyant, F., Babin, M., and Claustre, H., 2008, Relating phytoplankton 482
photophysiological properties to community structure on large scales, Limnol. Oceangr., 483
53(2), 614-630. 484
Yamashita, Y., Nosaka, Y., Suzuki, K., Ogawa, H., Takahashi, K., and Saito, H., 2013, 485
Photobleaching as a factor controlling spectral characteristics of chromophoric dissolved 486
organic matter in open ocean, Biogeosci., 10, 7207-7217, doi:10.5194/bg-10-7207-2013. 487
20
Figure captions 489
Figure 1. Locations of sampling stations for ICESCAPE 2010 (blue crosses), ICESCAPE 2011 (red 490
diamonds), and MALINA (black circles) cruises in the Arctic Ocean. A transect from 491
Kotzebue Sound (KS) to the Chukchi Hotspot (CH) is shown as a black line. Vertical 492
sections of CDOM absorption properties as well as salinity and phaeopigment 493
concentrations along this transect in the intermediate layer (i.e., 30.7 < salinity < 33.9) are 494
shown in Figure 5. 495
Figure 2. Mean sea ice concentration images provided by the using satellite microwave sensor, 496
DMSP SSM/I, during (a) MALINA, (b) ICESCAPE2010, and (c) ICESCAPE2011 cruises. 497
These images were generated by averaging daily images available during each cruise. 498
Sampling stations are also displayed with white circles, yellow crosses, and red diamonds, 499
respectively. 500
Figure 3. Vertical profiles of (a) CDOM absorption coefficients at 440 nm (aCDOM(440), m-1) and (b)
501
their spectral slope (SCDOM, nm-1). X-axis for (a) is log-transformed to show variability in
502
both low and high aCDOM(440) values. Mean profiles of (c) aCDOM(440) and (d) SCDOM with
503
10-m intervals. Standard deviations are shown as horizontal bars. 504
Figure 4. Upper panels: CDOM absorption coefficients at 440 nm as a function of salinity (S) for 505
(a) the whole salinity range and (c) for S ≥ 28. A linear fit provided by Matsuoka et al. 506
(2012) is shown in grey. Data points along this fit correspond to river-influenced waters. 507
Data points for ice melt waters are shown in the circle in (a). Lower panels: spectral slope of 508
CDOM absorption coefficients, SCDOM as a function of salinity for (b) the whole salinity
509
range and (d) for S ≥ 28. 510
Figure 5. Vertical sections of (a) salinity, CDOM absorption properties (b) aCDOM(440) and (c)
511
SCDOM, and (d) phaeopigment concentrations along the transect from Kotzebue Sound (KS)
512
to the Chukchi Hotspot (CH). 513
Figure 6. Relationship between SCDOM and (a) bacterial production (BP, µg C m-3 d-1) and (b)
21
bacterial abundance (BA, cells ml-1). 515
Figure 7. Biplot of principal component analysis (PCA). The important features of this plot are as 516
follows: 1) direction of each arrow represents contribution to principal component 1 (PC1: 517
x-axis) and 2 (PC2: y-axis) for a given variable and 2) magnitude of an arrow represents the 518
strength of the variable to the components. For example, BP and chl a concentrations 519
showed a similar direction, suggesting they are related to each other and to positive PC1. 520
This result is consistent with the direct regression analysis (Figure 6 and Table 1). The 521
positive PC1 reflects production of organic matter (section 3.4). Thus, BP and chl a 522
concentrations can be considered as contributors to the production of organic matter. See 523
section 3.4 for details. 524
525
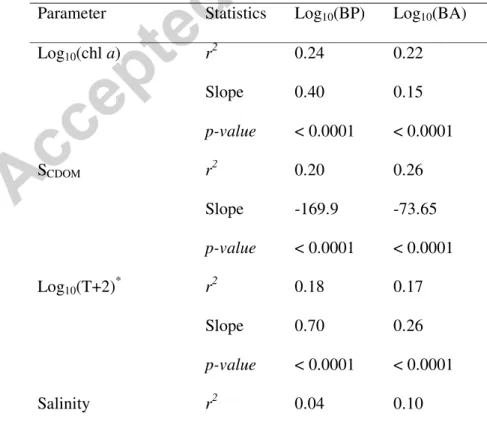
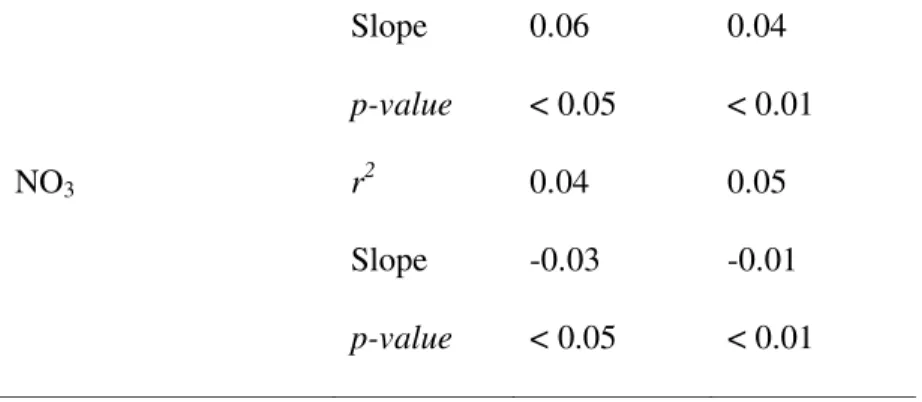
Table 1. Summary of the Model II regression analysis for bacterial production (BP, µgC m-3 d-1) and 526
abundance (BA, cells ml-1) as a function of chlorophyll a (chl a, mg m-3) concentrations, spectral 527
slope of CDOM (SCDOM, nm-1), temperature (T, degrees C), salinity, and nitrate (NO3, µmol kg-1)
528
concentrations. A total of 133 samples were used for each regression analysis. 529
Parameter Statistics Log10(BP) Log10(BA)
Log10(chl a) r2 0.24 0.22 Slope 0.40 0.15 p-value < 0.0001 < 0.0001 SCDOM r2 0.20 0.26 Slope -169.9 -73.65 p-value < 0.0001 < 0.0001 Log10(T+2) * r2 0.18 0.17 Slope 0.70 0.26 p-value < 0.0001 < 0.0001 Salinity r2 0.04 0.10
22 Slope 0.06 0.04 p-value < 0.05 < 0.01 NO3 r2 0.04 0.05 Slope -0.03 -0.01 p-value < 0.05 < 0.01 530 *
For conversion to a base 10 logarithm, 2 was added to T. 531
532
Table 2. Determination coefficients between bacterial variables (BP or BA) and spectral slope 533
parameters (S275-295, S350-400, and its ratio SR) proposed by Helms et al. (2008).
534
r2 Log10(BP) Log10(BA)
S275-295 0.11 0.12 S350-400 0.19 0.23 SR 0.03 0.04 535 536 537 538
23 539 Figure 1 540 Matsuoka et al. 541 542 543 544 545
24 546 547 Figure 2 548 Matsuoka et al. 549 550
25 551 552 553 Figure 3 554 Matsuoka et al. 555 556 557
26 558 559 Figure 4 560 Matsuoka et al. 561 562 563 564
27 565 566 Figure 5 567 Matsuoka et al. 568 569 570
28 571 572 573 Figure 6 574 Matsuoka et al. 575 576
29 577 578 Figure 7 579 Matsuoka et al. 580 −2 −1 0 1 2 − 2 − 1 0 1 PC1 (30.9%) P C 2 ( 2 1 .4 % ) SCDOM AOU NO3 Sal achl aCDOM(440) T BP BA −2 −1 0 1 2 − 2 − 1 0 1