HAL Id: halshs-02284843
https://halshs.archives-ouvertes.fr/halshs-02284843
Submitted on 12 Sep 2019
HAL is a multi-disciplinary open access
archive for the deposit and dissemination of
sci-entific research documents, whether they are
pub-lished or not. The documents may come from
teaching and research institutions in France or
abroad, or from public or private research centers.
L’archive ouverte pluridisciplinaire HAL, est
destinée au dépôt et à la diffusion de documents
scientifiques de niveau recherche, publiés ou non,
émanant des établissements d’enseignement et de
recherche français ou étrangers, des laboratoires
publics ou privés.
Using Foursquare data to reveal spatial and temporal
patterns in London
Maarten Vanhoof, Antonia Godoy-Lorite, Roberto Murcio, Iacopo Iacopini,
Natalia Zdanowska, Juste Raimbault, Richard Milton, Elsa Arcaute, Mike
Batty
To cite this version:
Maarten Vanhoof, Antonia Godoy-Lorite, Roberto Murcio, Iacopo Iacopini, Natalia Zdanowska, et
al.. Using Foursquare data to reveal spatial and temporal patterns in London. NetMob 2019, Jul
2019, Oxford, United Kingdom. �halshs-02284843�
Using Foursquare data to reveal spatial and temporal patterns in London.
Maarten Vanhoof
1∗, Antonia Godoy-Lorite
1, Roberto Murcio
1, Iacopo Iacopini
2,1, Natalia
Zdanowska
1, Juste Raimbault
3,1, Richard Milton
1, Elsa Arcaute
1, Mike Batty
11
Centre for Advanced Spatial Analysis, University College London, London, UK
2School of Mathematical Sciences, Queen Mary University of London, London, UK
3Institut des Syst`emes Complexes, National Centre for Scientific Research (CNRS), Paris, France
1
Introduction
Understanding the functional structure of contemporary cities can find many applications ranging from urban planning to lo-cal governance regarding inequality issues. This exploration is often constrained by the availability of large-scale data at fine spatio-temporal resolution. Longitudinal data, such as the Foursquare data, allow researchers to explore different aspects of the functional structure of cities, such as the role of places and the human mobility that occurs between them. However, never mind their size, this type of data is often in-complete, capturing only parts of the functional city due to the biases in the data collection that might represent a part of the population only.
In this paper we explore how Foursquare data can help unveil aspects of the functional structure of London. We explore the spatial pattern of venue locations and visit patterns captured in the Foursquare data. We also touch upon the temporal pat-terns of these data, as well as the interactions between cate-gories of places (as derived by the semantic information that comes with the venues). Our findings reveal some of the char-acteristics and limitations of the Foursquare data with regard to investigating the functional structure of London and other cities.
2
Brief description of data and data handling
In this report we mostly focus our attention on London. We deployed both movement and venue data. Based on the cat-egory tree retrieved from the Foursquare api, we were able to classify the venues to higher level categories. It should be noted that, within this category tree, not all categories have the same depth of branches or number of leaves; and that venues in the data can be classified at different depths of the tree. As such, one can use this category tree only one-directional and it seems wise to evaluate at the highest level only. Those highest categories, and their number of available venues in the London data are in table 1.
To perform our analysis we used open source software, more specifically Python and GIS. If wished for, our codes can be made available on Github to wider audience.
∗
Highest level of category Number of venues
Food 7340
Nightlife Spot 3169 Shop and Service 3012
NaN 2929
Travel and Transport 2643 Professional and Other Places 1352 Outdoors and Recreation 1114 Arts and Entertainment 828 College and University 256
Event 37
Residence 9
Table 1: Number of venues in London per highest category in the Foursquare category tree.
3
Venue locations
By investigating the location of London venues, one can distinguish a spatial pattern in which more venues are ob-served in Central London compared to it’s surrounding neigh-bourhoods (figure 1 top). One exception to this pattern is Heathrow Airport in the west, where a high number of Foursquare venues is observed despite its remote location from Central London. The map of the diversity of venues, as given by the entropy of observed categories per LSOA level (a low level administrative boundary in the UK), shows a pat-tern in line with the number of venues (figure 1 middle). In-deed, the higher diversity of venues in observed in Central London gradually fades out when moving away from it. It is known, however, that entropy values are related to volume and so when normalising entropy by the number of venues, the spatial pattern changes in an interesting way. In fact, af-ter normalising the entropy by the number of venues (figure 1 bottom) one can observe that both London city centre and some remote areas around the City depict very low entropy scores. In Central London, this is due to the high amount of venues observed which brings down the normalised entropy to a large degree. Regarding the remote areas, this is due to a very low number of observations in the first place (as can also be observed in figure 1 top). At the same time, several areas away from Central London display a high normalised entropy, or thus a high diversity of venue categories, despite having a limited number of Foursquare venues.
Figure 1: Number of Foursquare venues (top), entropy of Foursquare venue categories (middle top), normalised entropy of Foursquare venue categories (middle bottom), and number of reg-istered companies in the Companies House dataset (bottom) for all LSOA administrative regions in London.
In a way, this finding stresses the importance of diversified functional activity in areas that are away from Central Lon-don. One outstanding question is whether limited number of venues in these areas correspond to a diminishing presence of such venues or simply by a diminishing popularity of these areas on the Foursquare platform. A quick comparison be-tween the number of Foursquare venues and the number of registered companies in London -as can be found in United Kingdom’s government registrar of companies, Companies House - does not offer a closing answer to this question. The spatial pattern of registered companies appears to be similar to the one of Foursquare venues (figure 1 top vs. bottom), and the distribution of the number of Foursquare venues per reg-istered company for all LSOAs in London is narrow around 2 percent expressing differences between areas when it comes to Foursquare coverage (figure 2). The latter of course does not mean that the Foursquare venues cover companies of all types and sorts, but further investigation is needed in order to better understand this ”popularity bias”. Concluding, one could roughly say that there are three types of areas when it comes to Foursquare venues location in London. Areas that have a lot of venues and diversity (e.g. Central London), areas that have a limited but diversified number of venues (some of the out-of-centre areas) and areas that have little to no venues in the data (e.g. the South-East region of London). Although it is unclear what drives the presence of venues in the Foursquare data, there probably exists a ”popularity bias” which calls for a better understanding.
0.00
0.02
0.04
0.06
0.08
0.10
# Forsquare/# Registered venues per LSOA
0
20
40
60
Figure 2: PDF for the number of Foursquare venues over number of registered companies per LSOA.
4
Spatial patterns of categories
Having investigated the diversity of venue categories in ar-eas, the next logical question is whether spatial patterns per category differ much from one another, and if these spatial patterns might form a reflection of the popularity bias. Fig-ure 3 shows the location of different venues according to their highest level category. Clearly, spatial patterns differ by cate-gory. For example, the outdoor and recreation pattern depicts a remarkable uniform distribution over the city as the cate-gory includes places such as parks or sporting grounds which are typically provided by local authorities to their inhabitants.
Venues in the food, and shops and services categories, are mostly located in Central London and around main roads or local centres. They reflect elements of accessibility and ac-cess to a market in order for these venues to function. An-other patterns is that of colleges and universities, which are entirely grouped in Central London, expressing their higher-level functional role, their historical character, and their inde-pendence from local planning or market demand.
Figure 3: Spatial patterns of venues with different categories in Lon-don
5
Hotspots of movements
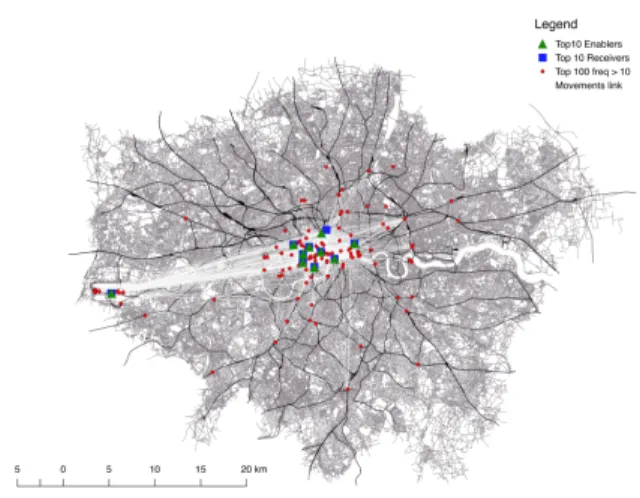
The movement data provided by Foursquare allows us to add a behavioural component to the location information of venues. To mine this potential, we perform a hot-spot anal-ysis of the venue pairs that were most observed in the pro-vided movement data. For London, we had access to a total of 7,650,994 pairs (Venue i to Venue j) that were subsequently visited by Foursquare users. We define our hot-spots on the number of check-ins that happened for each pair during the whole period the data was provided for. Focusing on pairs with more than 1000 check-ins renders a set of 101 pairs of venues (figure 4). As can be observed, most of them reflect micro-movements located in Central London and Heathrow Airport. Nevertheless, some of the pairs depict movements towards train stations or towards outside venues such as Croy-don (an extensive night-time and shopping district) or Wim-bledon (famous for its tennis competition).
Finally, we defined two types of venues from these hot-spots, Enablers and Receivers. An Enabler venue is drawn from the Venue i subset and ranks high in frequency (the amount of months-different times combinations this venue was observed in the data) and check-ins. On the other hand, a Receiver venue also ranks high in these characteristics but is drawn form venue j. The top ten Enables and receivers are shown in (figure 4). They are Heathrow airport, train stations, Harrods, Hyde Park, Marble Arch, and Piccadilly. From these ten, nine are at the same time Enablers/Receivers; St. Pancras is only enabler and Euston is only receiver.
Examining hot-spots for different periods of the day re-veals some different patterns too. The morning check-ins, for example, are done mostly at train stations, whereas some ar-eas like Oxford Street (a shopping area) are fundamentally midday locations and others, like Kensington are mostly af-ternoon/night areas. Some of these patterns can be investi-gated for an area of central London depicted in figure 5).
Figure 4: Hot-spots of pairs of venues in London based in the Foursquare movement data. Top 10 Enablers and Receivers are dis-played as well
Figure 5: Hot-spots of pairs of venues in London based in the Foursquare movement data. Top 10 Enablers and Receivers are dis-played as well
6
Transition matrix between categories
The analysis of movements between pairs of venues and their relation to the time of the days makes one wonder whether, at the very high level, one could detect temporal patterns be-tween categories of venues. Are movements bebe-tween trans-port venues and universities more likely to occur during day-time? Is there a seasonal pattern that can be distinguished for the movement between outdoor locations and venues in the category food?
To investigate this, we constructed transition matrices be-tween all high-level categories based on the movement data. In the case of London, most movements occurred between venues in the categories of food, travel & transport, and shop & service. Interestingly, these high-level transition matrices are not influenced by the different seasons in a year (figure 6). And they were only influenced to a limited degree by the time of the day as can be observed in figure 7. In London, for example, interactions with the food category are limited in the morning, but pop up throughout the day and peak in the night period. We found the limited sensitivity to seasons and time of the day to be the case for London, but also for the different other cities available in the Foursquare data such as Istanbul, Tokyo, or Jakarta.
What did reveal though, is that the transition matrices be-tween different cities differ as can be observed in figure 8. In most cities the food, travel & transport, and shop & service remain the major categories, but the degree of their interac-tion differs. In Istanbul for example, food is by far the main category while travel & transport are almost non existent. The inverse is observed in Tokyo where travel & transport is by far the main category and food is almost non existent. Interestingly, the importance of other categories is different between cities. In Istanbul outdoor& recreation places are rather prominent, while in Jakarta professional places pop up more than in any other city. Without further investigation it is difficult to detect the reasons for these differences, but they could be: a different usage of Foursquare in cities, a differ-ent amount of venues from differdiffer-ent categories in the cities, and a different functional composition of the cities. Each city thus has its own specific pattern of interactions between venue categories, enabling and limiting the study of their functional structure in different ways.
Figure 6: Transition matrices between the different high-level cate-gories of venues for the different seasons in the Foursquare data for London
Figure 7: Transition matrices between the different high-level cate-gories of venues for different times of the day in the Foursquare data for London
7
Small conclusion
In this report, we have briefly discussed the foursquare data and their potential to offer a view on the functional struc-tures on contemporary cities like London. Exploring the foursquare venue locations we touched upon the idea of understanding functions and the diversification of function within different city areas to better understand their role in the city as a whole. The spatial patterns of individual cat-egories serve as a good for this example. Nevertheless we reckon that, given the way the foursquare data is collected, some sort of popularity bias exists within the data. Validation with external databases is necessary to better understand this bias, and so we touched upon such validation by comparing the number of foursquare venues in London with the num-ber of firms in London based on the xxxx database on firms in London. Combining the location, functional aspect of the venues with the movement data provided by users interaction with venues we added a behavioural component to our anal-ysis. The analysis of hot-spot of movement pairs allowed us to better understand popular movement patterns in London. In general, we found hot-spots of movement often to be re-lated to tourism movements (airport-center shuttle, Harrods) and places of transport (the many train stations in London). A closer look at places that serve as enablers and receivers, we note that throughout different periods of the day, different places become more important. Functional places, in other words, are depending on the rhythm of the day. This might not be surprising, but when studied in more depth, it will re-veal some interesting information on the functioning of places in the city.
Finally, we also investigated the sensitivity of larger pat-terns of functional interactions to time. More specifically, we wondered whether interactions, as described by the pairs of venues, between high-level categories would differ signifi-cantly at city scale over the time periods of season or even different times of the days. For London, we found these high level interactions, as expressed by the transition matrices, to be little to not influenced by time periods. We found a similar insensitivity for other cities in the data, such as New York or Jakarta. We did, however, find differences in the gen-eral structure of the high level transition matrices between cities. The reasons for these differences can only be hypoth-esised, but could relate to different city structures or usage of Foursquare, meaning that the interpretation of functional structures in cities based on foursquare data might be city de-pendent.
8
Future work
Some ideas for further work we came up with are:
• Elaborate an investigation of the popularity bias by vali-dation foursquare venues with a register of existing com-panies
• Follow check-ins through day. After aggregating by time of the day the hotspot locations, record Venuei
-Venuej time (let’s say Morning). Then look at all
Venuej-Venuekpairs and keep those with time=Midday;
then took V enuek-V enuem pairs and keep pairs with
time=Afternoon and so on. This only works if we as-sume that check-ins happen the same day and only for walkable location, like from Harrods to Hyde Park to Marble Arch or follow locations from train stations. • Use the patterns of the high-level transition matrices
to identify similarities and differences between cities worldwide (unsupervised learning). Investigate whether similarities relate to i) types of Foursquare usage, ii) functional structure of the city and 3) the morphologi-cal patterns of the cities.
Figure 8: Transition matrices between the different high-level cate-gories of venues for different cities based on the foursquare data