HAL Id: hal-01066422
https://hal.archives-ouvertes.fr/hal-01066422
Submitted on 19 Sep 2014HAL is a multi-disciplinary open access archive for the deposit and dissemination of sci-entific research documents, whether they are pub-lished or not. The documents may come from teaching and research institutions in France or abroad, or from public or private research centers.
L’archive ouverte pluridisciplinaire HAL, est destinée au dépôt et à la diffusion de documents scientifiques de niveau recherche, publiés ou non, émanant des établissements d’enseignement et de recherche français ou étrangers, des laboratoires publics ou privés.
Moldavia (Romania)
Robin Brigand, Olivier Weller
To cite this version:
Robin Brigand, Olivier Weller. Neolithic and Chalcolithic settlement patterns in central Moldavia (Romania). Documenta Praehistorica, Ljubljana University Press, Faculty of Arts, 2013, 40, pp.195-207. �10.4312/dp.40.15�. �hal-01066422�
Neolithic and Chalcolithic settlement patterns
in central Moldavia (Romania)
Robin Brigand
1, Olivier Weller
21 Lab. Trajectories (UMR 8215), Nanterre, FR< ARHEOINVEST Platform, Univ. A. I. Cuza, Ias¸i, RO
robinbrigand@yahoo.fr
2 CNRS, Lab. Trajectories (UMR 8215), Univ. Paris 1 Panthéon-Sorbonne, Maison de l’Archéologie et de l’Ethnologie, Nanterre, FR
olivier.weller@mae.cnrs.fr
Introduction
Towards the end of the 6th and especially during
the 5thmillennium, an evolution of social and
eco-nomic needs is perceived in Romanian Moldavia. This is observed through the densification and di-versification of settlement patterns, as well as an increasing exploitation of natural resources strictly correlated to the expansion of exchange networks. This transfer of ideas and objects occurs in the con-text of the assertion of major cultural groups of
Cen-tral and Eastern Balkans in a largely amended social and economic framework.
The intensification of agricultural production arising in a territorial framework largely organised around stable settlements, generally fortified and dispersed, is similar to a Neolithic ‘second revolution’. From a terminological point of view, it leads to the Chalco-lithic period (second half of the 5th millennium),
ABSTRACT – Despite a long tradition of studies of the Moldavian Neolithic and Chalcolithic
cultu-res, the analysis of the territorial behaviour of human communities remains underexploited. This work combines concepts used in landscape archaeology with the potential of the Geographic Infor-mation System (GIS) to mobilise archaeological artefacts in a large-scale setting and for many the-matic purposes. This paper aims to compare the spatial and temporal distributions of archaeolo-gical evidence in central Moldavia. Applying integrated approaches through GIS analysis, it explores the natural, economic and social phenomena involved in territorial trajectories during the Later Pre-history (6000–3500 BC). In the chronological framework of the Star≠evo-Cris, Linear Pottery, Precu-cuteni and CuPrecu-cuteni cultures, different types of spatial analysis are computed in order to underline territorial control and supply strategies in an area well known for its density of its fortified settle-ments, extremely rich soils and abundance of salt springs.
IZVLE∞EK – Kljub dolgi tradiciji ∏tudija neolitskih in halkolitskih kultur v Moldaviji je delovanje
≠lo-ve∏kih skupnosti v prostoru ∏e vedno premalo raziskano. To omogo≠ajo koncepti prostorske arheolo-gije v povezavi z geografskimi informacijskimi sistemi (GIS), s katerimi povezujemo arheolo∏ke ar-tefakte na ve≠jem obmo≠ju v mnoge tematske sklope. V ≠lanku primerjamo prostorsko in ≠asovno razprostranjenost arheolo∏kih zapisov v centralni Moldaviji. Z uporabo integriranega pristopa preko analize GIS raziskujemo naravne, ekolo∏ke in dru∫bene fenomene, ki so bili vklju≠eni v teritorialne trajektorije v mlaj∏i prazgodovini (6000–3500 BC). Predstavljamo razli≠ne tipe prostorskih analiz v kontekstu kultur Star≠evo - Cris, Linearno-trakaste keramike, Precucuteni in Cucuteni, da bi pouda-rili pomen nadzora skupnosti nad ozemljem in strategije oskrbe na podro≠ju, ki je znano po veliki gostoti utrjenih naselbin, po zelo rodovitni zemlji in ∏tevilnih slanih izvirih.
which corresponds to the thriving of economic struc-tures and production processes. Our research con-sists in a global approach to Later Prehistory settle-ments patterns that persisted for almost three mil-lennia, in order to underline the nature and dyna-mics of settlements in the long term. The study will first assess the structuring resources of settlements (primarily salt and soil), before offering viewpoints on how to broaden our understanding of the territo-rial strategies of Neolithic and Chalcolithic Molda-vian communities.
Study area
The study area covers 8900km2, from the Eastern
Carpathians Mountains to the River Prut (Fig. 1). It covers Neamt and Iasi Counties and clearly distinct geographical environments: the Eastern Carpathi-ans Mountains (more precisely the flysch zone); the Carpathian Depression and Sub Carpathian hills (Su-ceava Plateau); and the Moldavian Plain. Yet, this study does not dwell on the mountainous zone of the Carpathians, as it was indeed little occupied by Later Prehistoric communities, due to rugged areas and steep slopes. The transitional area with the Car-pathian Depression, bounded by the confluence of the Siret and Moldova rivers, is marked by outcrops of Aquitanian and Tortonian salt deposits (Velcea,
Savu 1982.239–243).
Many salt springs (Fig. 2A) and chlorinated waters with sodium originate from this salt belt. Many old and recent studies (Merutiu 1912; Sandru 1952;
Monah 2002; Weller, Brigand and Alexianu 2007; 2010) have specified the nature, chemical composi-tion and distribucomposi-tion of these resources. In the de-pression, the Sub Carpathian hills composed of sand-stone, marl, clay and conglomerate deposits can be found between 200 and 300m a.s.l.; while they can be found up to 300 to 350m in the glacis areas
(Lu-pascu 1996.17–28). In structural terms, the Molda-vian Plain is a monocline oriented NW-SE, bounded in the west and south by ‘cuesta landforms’, steep slopes exceeding 250m. Sarmatian deposits (clay and marl) can be found only on very steep slopes affected by erosive trends (Ba˘ca˘uanu 1968.77–82). They are covered by loess deposits on ridges, pla-teaus or gentle slopes. To the south, the Central Pla-teau is made of more resistant sandstones and lime-stone bedrocks, thus explaining the more rugged re-lief.
Soils and their agronomic potential are a record of geological heritage and anthropic management. Two
main categories have been defined by climatic zon-ing (Ba˘ca˘uanu 1968; Lupascu 1996):
Type 1. The level of alluvial clay, made up of brown and grey steppe soils, occasionally found on the pla-teaus that limit the Moldavian Plain (west and south). They are most commonly found in the Carpathian Depression.
Type 2. The level of mollisols (chernozem) that pre-dominate in the Moldavian Plain and the Bistrita Valley, which includes the backs of cuestas and low interfluves, terraces and lower parts. Steep slopes heighten the probability of landslides, more so in the Moldavian Plain. The intensification of agricul-tural and deforestation activities were the principal causes of accelerated erosion. In lower areas, hydro-morphic and saline soils are common (Ba˘ca˘uanu
1968.81).
Landsat remote sensing data acquired on 05/13/ 2003 were used to distinguish soil patterns and cur-rent land use (Fig. 1). The enhanced multispectral image (using the 15m pixel size panchromatic image) and its classification, along with the use of a soil map published in 1990, enabled us to obtain good information on soil moisture and the main soil cate-gories. Brown soils (soil type I) are commonly found in the Carpathian Depression; Chernozem (soils type II) seem to be widespread in the Moldavian Plain as well as in the Carpathian Depression alluvial plain. The first clearings were made through slash-and-burn by the first farming groups in the Neolithic era. According to Lupascu (1996), the intensification of agriculture and pastoral land use since the Neolithic were the main cause for the processes that formed the specific characteristics of soil such as chernozem. Paleo-environmental analyses should probably en-lighten us on this matter. Due in part to the lack of sampling areas likely to trap organic material in se-diment cores to reconstruct changes in the Holocene, these are as yet too few to be significant
(Carciuma-ru, Monah 1987; Volontir 1990; Danuet al. 2010). However, they suggest the long-term stability of for-est composition, canopy coverage being reduced since the later sub-boreal climate.
Archaeological data
The mapping and geographical analysis of settlement patterns has been made possible by the use of geo-graphical information systems or GIS to put archaeo-logical databases into a spatial framework. Since the
end of the 19thcentury, various stakeholders have
contributed to a general knowledge about the prehi-storic archaeology of Moldavia. Important publica-tions are now part of the institutional historiogra-phy of the Neolithic and Chalcolithic cultures
(Zaha-ria et al. 1970; Chirica, Tanasachi 1984; Monah,
Cucos 1985; Marinescu-Bîlcu 1993; Cucos 1999; Popovici 2000; Ursulescu 2000; Va˘leanu 2003;
Bog-hian 2004; Bem 2007). Our study has benefited from these numerous inventories, while sharing with local researchers and field prospectors (among others, G. Dumitroaia, R. Munteanu and D. Garva˘n from the History and Archaeology Museum of Piatra Neamt; D. Monah, V. Cotiuga˘ and A. Asa˘ndulesei from the Iasi Institute and University). Given the complex hi-story of research and the undeniable wealth of data,
Fig. 1. Study area: topographic profile, land cover, stream reconstruction, salt spring and archaeologi-cal sites (6000–3500 BC).
an exhaustive yet critical database has been created for Neamt and Iasi counties. All the available infor-mation has been stored in an SQL environment da-tabase.
Reliability
The aim is to assess the validity of archaeological in-formation. A confirmed settlement must be distingui-shed from a duplicate or uncertain one. As field sur-veys are rarely coordinated, a large set of points overlap, thus needing to be eliminated. For instance, only 603 archaeological sites referred to 6000–3500 BC out of a total of 737 could be calibrated to the Neolithic and Chalcolithic periods.
Quality
This is an important section, as it allows the initial data classification to be built (Fig. 1). The issue of archaeological classification has greatly mobilised scientific communities. Researchers started to use to-pographical criteria in order to distinguish between different types of archaeological site in the 1970s (Zaharia et al. 1970.32–34; Monah, Cucos 1985.
42–43). A look at former inventories shows a more or less elaborate classification between higher, lower and medium positions. These, however, are not al-ways relevant, given that their variability depends
on territorial topography. A single topographical cri-terion cannot establish a valid hierarchy; it must ne-cessarily be associated with other data, such as the nature and quantities of archaeological artefacts. Four standard types were retained in the study:
●Occupations (49%). The lowest level – also the
lar-gest group – is constituted by small sites that provi-ded only a limited number of ceramic remains, with no obvious element of domestic architecture or ma-terials of quality. This probably includes temporary sites characterised by high mobility. Yet, they are often poorly delineated and insufficiently surveyed.
●Settlements (42%). Simple settlements (28%)
dis-play architectural structures (benches or abundant clay wall) and artefacts of quality (figurines, painted ceramics, bone, millstone and flint tools). They dif-fer from hilltop settlements (14%), which are limi-ted by steep slopes forming a headland opening on-to a wide site. Low terrace settlements, closed on one side, are considered as simple settlements rather than hilltop ones.
●Fortified settlements (7%). These include sites
cha-racterised by man-made fortifications, with abundant archaeological remains and house remains (Fig. 2B,
Fig. 2. Fortified settlements, salt spring exploitation and current landscape: A Ha˘la˘bu-toaia-Tolici (Petricani, Ne-amt) salt spring and archae-ological deposit in the back-ground; B Ferma de Vaci-Valea Seaca˘ (Ba˘lta˘testi, Ne-amt) dating to Cucuteni A; C Precucuteni and Cucuteni enclosed settlement of Va˘leni (Piatra Neamt) up to Bistri-ta River; D the BistriBistri-ta valley in the southern part of Pia-tra Neamt; E Valea Oii flu-vial landform and two Cu-cuteni A settlements on low (bottom left corner) and high (right) eroded terraces
(Filia-ssi, Ba˘lta˘ti, Iassi). Photo: O.
Weller (A, B, C, D) and A. Asa˘ndulesei (E).
2C, 2E). Due to the temporary or reuse aspect of these constructions, numerous fortified structures can no longer be detected.
●Salt exploitation (2%). Eight salt springs give the
most direct and accurate indications of salt exploita-tion, which dates to the Neolithic and Chalcolithic pe-riods (Dumitroaia 1994; Weller, Dumitroaia 2005;
Welleret al. 2007). The evidence of exploitation com-prises salt moulds, ceramic containers for salt-water crystallisation, and charcoal (an indication of salt production by burning). Six other salt springs con-tained indirect remains of salt exploitation during Later Prehistory.
Discovery
A reliable piece of evidence on research dynamics in this area has been provided by the relatively large number of excavated sites: 104 have been found (17%). The inclusion of surface surveyed sites is ju-stified by the elaboration of archaeological mapping. However, difficulties arise when it comes to analy-sing the settlement pattern and comparing all sites because the data are uneven.
Chronology
Site excavation provides a relative chronological fra-mework. Dating a site from archaeological remains collected by field survey raises doubts as to how re-presentative and reliable they are for periodic maps. Significant and recurring observations have been made for almost a century in Neamt and Iasi coun-ties, making an evaluation of the dynamics of set-tlement patterns possible: Star≠evo-Cris (10%), 6000– 5300 BC; Linear Pottery (3%), 5300–5000 BC; Precu-cuteni (10%), 5000–4600 BC; CuPrecu-cuteni (77%), 4600– 3500 BC (Fig. 3). The Cucuteni period is divided into two or three phases.
● The highest number of archaeological sites is in
the Cucuteni A period (4600–4100 BC): 261 sites (43%), of which 184 are no longer occupied.
●Concerning the Cucuteni A–B period (4100–3850
BC), researchers have noted the very low number of sites for this period: 38 sites (6%) in our study. This reflects the lack of abundant painted ceramics, rather than a decline in the numbers of settlements (Zaharia et al. 1970.32–34; Monah-Cucos 1985.42–
43; Va˘leanu 2003.49–51). More than half of these sites were dated after scheduled archaeological ex-cavation.
●As our study took a particular interest in the long
term, it seemed appropriate to group together Cucu-teni A–B and CucuCucu-teni B sites (4100–3500 BC) with 193 sites (32%), because it is difficult to discriminate between both periods on the sole basis of material collected by field survey. Besides, almost all Cucu-teni A–B sites extend to the CucuCucu-teni B. Added to Cu-cuteni B, the number of sites is 203 (34%). Almost 79 sites (17% from all Cucuteni sites) were occupied from the Cucuteni A to Cucuteni A–B/B pe-riod. These present stable, generally significant sites from an economic, social and territorial point of view due to their appeal over a thousand years.
Geo-referencing
Surveyed sites have been mapped by differential GPS or precisely located on cadastral maps (14%). The other sites were located with the use of descri-ptions found in archaeological inventories, discus-sions with field prospectors, and with the combined use of topographical maps and orthophotographs. The position of 54% of archaeological points can be mapped within a spatial margin of error of about 50m. Some 28% of sites are located within a 50– 200m spectrum, and 4% remain inaccurate. The lat-ter are not taken into account for several spatial ana-lyses, which require an accurate topographic preci-sion, such as viewshed analyses.
Starting from this pattern of dots, a series of spatial analyses were undertaken, relying on a wealth of specialised literature (Wheatley, Gillings 2002;
Co-nolly, Lake 2006; Rodier 2011), as well as on seve-ral European programmes on spatial process model-ling (van der Leeuw et al. 2003; Gandini et al. 2012) and some experiments carried out in Neamt County (Weller et al. 2011; Brigand, Weller 2012) and the Bahluiet Valley (Brigand et al. 2012, Asa˘ndulesei et al. 2012).
Fig. 3. Quantitative evolution of settlement num-bers (in percentages) between Star≠evo-Criss and Cucuteni A–B/B.
Spatial analysis
The study of Neolithic and Chalcolithic settlement patterns relies on several GIS tools that produce di-stribution and density maps, such as a visibility ana-lysis. We should point out that these pioneering works on archaeological Moldavian data are essen-tially based on field survey results: their contempo-raneity beyond wide chronological and cultural pha-ses cannot be accurately aspha-sessed. The main point of this study is to go beyond the lack of available infor-mation in order to identify the multiple polarities and spatial/temporal dynamics of Late Prehistoric settlements. Let us briefly outline the spatial metho-dological background.
Density and dynamics
A density study is based on kernel density estima-tion. It provides an estimate of site density defined
by a moving window. This method has been well known since the 1980s (Silverman 1986) and has been mainly used for archaeological applications in intra- or inter-sites analysis (Baxter et al. 1995;
Wheatley, Gillings 2002.186–187; Conolly, Lake 2006.175–177; Alexakiset al. 2011; Nuninger et al.
2012). As this has been discussed elsewhere (Weller et al. 2011.73–75; Brigand et al. 2012.19–21), it is not presented in this article.
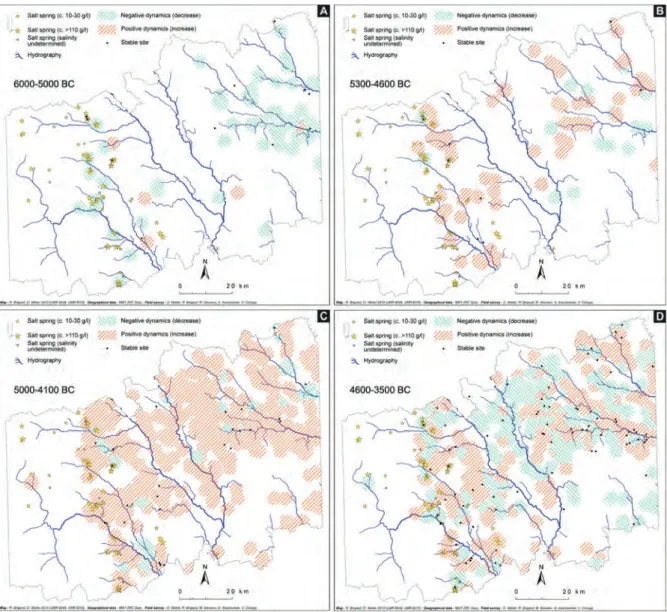
Using density maps that allow a broad view by chro-nological-cultural period, differential density maps have been proposed in order to visualise evolutions between two sequences (Fig. 4). These maps, whe-ther the instability is negative or positive, are obtai-ned by subtracting site density. Negative values cor-respond to decreasing sites or abandonment areas; conversely, positive values correspond to increasing sites (new site or a rise in a site’s status). Medium
Fig. 4. Maps of the change in occupation density between: A Star≠evo-Criss and Linear Pottery; B Linear Pottery and Precucuteni; C Precucuteni and Cucuteni A; D Cucuteni A and Cucuteni A–B/B.
values emphasise the overall stability in a given place; hence the location of stable sites has been specified.
Visibility analysis
Viewshed analyses are among the classic tools of-fered by the GIS in order to highlight territorial con-trol and areas of strategic interest (Wheathley,
Gil-lings 2002.202–216; Conolly, Lake 2006.225–233). Visibility analyses determine areas that can theo-retically be seen from one or different observation points. The DEM resolution (25m), elaborated by Kri∏tof O∏tir at the Research Centre of the Slovenian Academy of Sciences and Arts allows for accurate and precise results. Several analyses have been car-ried out based on the theoretical assumption of an observer 1.7m above ground, according to a stan-dard offset. The field of vision is limited to 12km, according to field observation and ethnographic in-formation. This paper assumes that a village, a small group of domestic units, or a herd located in an open landscape are clearly visible from 12km in favourable weather conditions.
● The simplest means of visibility calculation is a
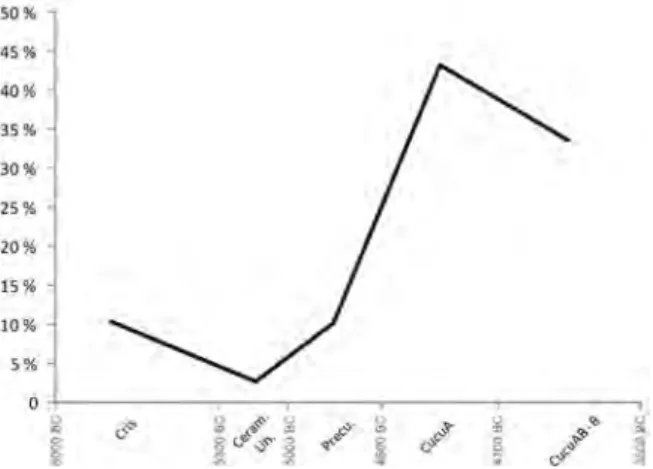
binary map that distinguishes between visible or in-visible target cells from a specified viewpoint. The visible spectrum might be quantified in square kilo-metres, or in percentages: its classification offers a first hierarchy according to the importance of theo-retical visibilities. The average viewshed by chro-nological-cultural period allows for a discussion of its evolution in the long term (Fig. 5). Counting sites that are seen by a contemporary observer offers the possibility of evaluating the viewshed quality and its evolution (Fig. 6). Associating one or more viewshed maps shows which visible values can be seen from at least one viewpoint (Fig. 7).
●The algebraic sum of two or more viewshed maps
creates a cumulative viewshed (Fig. 8). The cell val-ues are then integrated, ranging from 0 to a theore-tical maximum number of viewpoints. This occurs if
at least one cell is visible from all viewpoints. The field of view being given, the maximum values can-not be equal to the number of archaeological sites. Spatial analysis methodology needs to be put into perspective at several levels. The first assesses the spatial organisation of archaeological sites in the light of discriminating environmental parameters: topography, hydrography, soil qualities and salt re-sources. The second highlights the issue of spatial analysis as part of a more general thought process on settlement pattern dynamics between 6000–3500 BC.
Results and discussion
This study aims to show settlement organisation and strategies in an area actively surveyed by the Piatra Neamt Museum and Iasi University field researches.
Regional distribution
Late Prehistoric settlements developed to the east of the Carpathian Mountains. Indeed, the surfacing zone of salt water in the Piedmont area constitutes the western margin of settlements. To the south, the heights of the Central Plateau are not occupied. The vegetation canopies, covering these areas, make field surveys more difficult. Is it possible to suggest that a settlement was absent above an elevation of 500m in currently forested areas?
At most, one may assume that climate, altitude and scarcity of resources for agriculture contributed to low occupation in this area. Yet, in the absence of systematic field surveys of forest land, this hypoth-esis is hard to demonstrate. The few major rescue excavations that have been carried out suggest a li-mited occupation in semi-mountainous environments. The building of Bicaz Lake dam on the Bistrita ex-posed two Cucuteni A sites (Nicola˘escu-Plopsor,
Petrescu-Dîmbovita 1959). The distribution map raises the question of the visibility of archaeological remains. In the agricultural fields of the Moldavian Plain, where anthropogenic pressure on the environ-ment – and consequently on archaeological research – is greatest, a consistent number of sites have been found. Conversely, where land use is dedicated to herbaceous or forests land, the intensity of settle-ment is low or absent. It may thus be inferred that in this case the distribution map does not effecti-vely translate the actual occupation/settlement in Later Prehistory. Despite this fundamental limita-tion, the settlement pattern characteristics highligh-ted by this map should be studied (Fig. 1).
Fig. 5. Changes in the average viewshed by chrono-logical phase.
In accordance with the standards of Later Prehi-story, settlements are closely tied to the stream chan-nels, since they usually stand on the edges of allu-vial or eroded terraces, as well as on the ridges of cuesta landforms running alongside watercourses (Monah, Cucos 1985.41–42; Marinescu-Bîlcu 1993;
Popovici 2000.33; Lazarovici, Lazarovici 2003; Boghian 2004.55–58).
●On the Moldavian Plain (the eastern stretch of the
River Siret), settlements cluster along the Bahlui and Bahluiet valleys and in the downstream part of Târ-gu Frumos. To the south of the Central Plateau, and more precisely on the right bank of the River Bah-luiet, loose settlement patterns have been observed. They do not reach the concentration of other set-tlements close to Târgu Frumos. To the north, a sig-nificant difference appears in the central and north-ern part of the Moldavian Plain: occupation is stru-ctured around several centres (the high valley of Valea Oii – around the eponymous site of Cucuteni culture, the Hârla˘u area, the Jijia Valley and its ma-jor tributaries). On the interfluve of the Bahlui/Ji-jia, several sites correspond to more diffuse territo-rial networks. Few settlements have been documen-ted in the area between the Siret and Moldova ri-vers. These sites are strategically located between the Suceava Plateau and the Moldavian Plain, half-way between the Carpathian Mountains and the high Bahlui/Bahluiet valleys.
●To the west of the Siret, the situation is more
di-verse. On the one hand, the settlements in the Cra-ca˘u and Bistrita valleys are clustered along fluvial corridors. On the other, settlements generally form a more diffuse framework. A greater density of oc-cupation can be observed in areas with salt resour-ces (the Carpathian foothills). In the south of the
Bi-strita Valley, two salt springs with high salinity have remained isolated, with nearby sites situated be-tween 6 and 8km away. The question arises as to why these salt springs remained separated from the nearest settlements since the settlements in the Cra-ca˘u/Bistrita valley were located close to the stream confluence. This fact might indicate that control of access to a resource was more important than direct settlement near that resource. This fact is confirmed by observation alongside Târgu Neamt or Piatra Neamt: hilltop and fortified settlements are located downstream, at the mouth of the valleys that lead to salt springs, even though the edges of river terraces are in general preferred to marshlands and flood plains.
Most settlements are located where agricultural pro-spects are more favourable to cultivation. Whether on the Moldovian Plain or in the Sub Carpathian De-pression, archaeological sites are strictly linked to the availability of soils suitable for agriculture (Fig. 1). Areas of settlement are generally established on chernozem (soil type II), more precisely along the eastern bank of the Siret. In the western part, brown soils (soil type I) are favoured over chernozem for settlement. Whatever the area, the establishment of sites was always made at a meeting point between several types of soil, in order to use various and op-timal ways to exploit resources.
Proximity of fluvial corridors and availability of wa-ter, as well as easier territorial control were sought. Viewshed maps, whether multiple (Fig. 7) or cumu-lative (Fig. 8), tend to show this fact, although a ge-neral trend towards hilltop settlement is observed between the earlier Neolithic and Chalcolithic peri-ods.
Settlement pattern dynamics
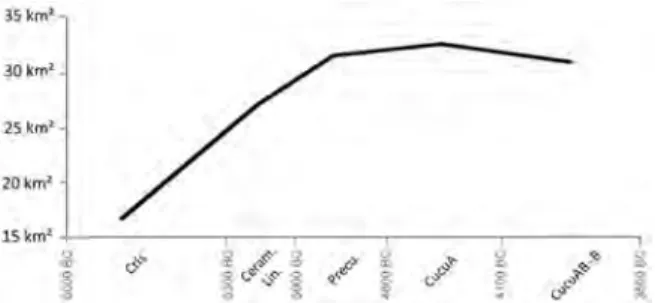
The evolution of settlement patterns between 6000 and 3500 BC is well established (Fig. 3, Fig. 4). The principal phases of occupation are as follows: 1. a marked decline in the number of sites between Star-≠evo-Cris and Linear Pottery; 2. a continuous in-crease during the mid-Neolithic up to the Early Chal-colithic (Precucuteni); 3. a true explosion in the num-ber of sites during the first stage of the Cucuteni period; 4. a marked a decline between 4100 and 3500 BC (Cucuteni A–B/B).
●The Star≠evo-Cris (6000–5300 BC) is
characteri-sed by settlements occurring on fertile lowlands and first terraces close to stream confluences. Viewsheds are reduced (Fig. 5), the average viewshed being
Fig. 6. Changes in the average of visual links by chronological phase.
close to 18km2, and the need for intervisibility is
almost non-existent (Fig. 6) as the average level of visual links is close to 0.6. This type of pioneering front is structured by a rural sprawl along major streams – the Bahluiet, Bahlui, Jijia – of the Molda-vian plain (Fig. 8A).
Close to the Carpathian Mountains, occupations, few in number, are concentrated close to salt springs (with maximum distance of 7km). The first indica-tions of crystallised salt production have been doc-umented at some of them (3 certain, 2 uncertain) lo-cated on the north side. These production centres are not connected to major settlements; the springs are neither visually controlled in a direct way, nor are their accesses particularly under control. Regar-ding salt production, we believe that it is not the structuring element of the settlement pattern, even if the availability of this resource is well known and clearly integrated with salt and brine supply net-works. This situation may suggest the existence of seasonal or temporary movements in search of salt water, as in transhumance. Only a few settlements would be stable (Bistrita Valley), perhaps at the end of this first phase of Neolithisation.
●Between Star≠evo-Cris and Linear Pottery (5300–
5000 BC), a significant general reduction is obser-ved in the number of sites (Fig. 4A), including those close to salt springs. The scarcity of Linear Pottery archaeological sites may be due to the research con-ditions rather than an actual decline in settlement numbers.
Despite the low number, the emergence of the first important settlements can be observed. These are located strategically: on hilltops and locations close to stream confluences, with good visibility of the sur-rounding area – average visibility coverage is close to 27km2 (Fig. 5). Implantations are scarcely
dis-tributed, which in turn produces a low level of in-tervisibility (Fig. 6) – the average level of visual links is close to 1.
Compared to the Star≠evo-Cris period, the end of the 6thmillennium shows a strengthening of
terri-torial control over river corridors. Salt resources are also exploited in the northern and central foothill area, even if few dwellings have been documented close to it, except for the early occupation of Târpe-sti-Râpa lui Bodai which relates to contemporary and continuous salt exploitation from Ha˘la˘butoaia at Tolici; Traian-Dealul Viei and Dealul Fântânilor connected to the Bistrita/Craca˘u confluence on one hand and the proximity of the Negritesti salt springs on the other. Small and probably seasonal occupa-tions emerge during this period. This reflects the first settlement differentiation, where major sites were surrounded by small occupations.
●The Precucuteni period (5000–4600 BC), is
cha-racterised by a slight increase in the number of sites (Fig. 4B), which takes the numbers back to the Star≠evo-Cris site numbers through an intensifica-tion of previous dynamics. Increased territorial con-trol is observed, since the viewshed average (33km2)
is at its highest level (Fig. 5). Most high terraces are
Fig. 7. Multiple viewshed map in the Târgu Neamt (left) and Piatra Neamt areas (right) respectively du-ring Precucuteni and Cucuteni A–B/B.
occupied, especially in stream confluence areas, but also on the western Carpathian terraces. On the Mol-davian Plain, settlement patterns were strengthened along major rivers (Bahluiet, Bahlui, Jijia), as if in a refocusing of settlements.
Settlement patterns during the Precucuteni period seem to be strictly integrated into a territorial orga-nisation in which fortified sites are surrounded by secondary occupations, which are probably seasonal and directly visible, as highlighted by the high
ave-rage of visual links –3.6 (Fig. 6). Set-tlements are clearly concentrated in several key areas: near stream con-fluences, river terraces, and salt springs. Incorporated in a well-struc-tured settlement network, exploit-ed salt springs are under the strict supervision of communities, which appear to have specialised to some extent in salt production.
The hilltop settlement of Tolici-Sipot Mohorâtu, for instance, is located up-stream from the confluence of the ‘salt’ valley – Valea Slatina – and the Tolici Valley, which leads to the Târ-pesti-Râpa lui Bodai fortified settle-ment, located 4km downstream (Fig. 7, left). Close to the salt spring, this site appears to have served as an in-termediate point between the ex-ploited spring and the main settle-ment of Râpa lui Bodai. Further examples underline the fact that, while salt springs do not need to be clearly visible from settlements, con-trol of their accessibility and the main valley is still more or less en-sured.
Always in the northeastern part of Piatra Neamt – the southeastern part of Targu Neamt – the central Topoli-ta Valley is toTopoli-tally controlled by the Râpa lui Bodai and Dealul Valea Sea-ca˘ sites, which are mutually visible. This settlement model is not only re-lated to control of the salt springs exploited upstream, but also to those along the main river corridor – for example, in the lower Bistrita/Cra-ca˘u Valley. Conversely, several salt rich areas, such as Oglinzi salt springs, are poorly connected to the main settlement pattern.
●Between the Precucuteni and the Cucuteni A
pe-riod (4600–4100 BC) some sites in secondary valley sectors were abandoned, but many new sites were created, colonising the entire regional ecosystem, ei-ther near salt springs or along major river systems and their tributaries (Fig. 4C). A substantial increase in settlement numbers and above all the spread of new colonies in semi-mountainous areas (such as
wet-Fig. 8. Cumulative viewshed of the Star≠evo-Cris sites (A) and Cucu-teni sites stable between 4600 and 3500 (B).
land ecosystems) is noticeable. Cucutenian settle-ments were generally established on the edges of river terraces, above marshlands and floodplains, for optimal control of fluvial corridors, as evidenced in the high average visibility – 32km2 (Fig. 6).
The emergence of a new territorial organisation can be observed. It was based on a strong hierarchy, highlighted by a variety of archaeological sites, whether fortified, hilltop or open settlements, and several satellite occupations. Between the Cucuteni A and Cucuteni A–B/B period (Fig. 3, Fig. 4D), a si-gnificant decline in the number of settlements sug-gests, both in the foothill areas and in the Molda-vian Plain, a shrinkage and concentration of settle-ments according to specific choices regarding terri-torial control and land resources. Numerous sites were indeed deserted, even in areas with several salt springs, yet many new settlements appeared in adjacent sectors, as if the population had moved then resettled elsewhere (Fig. 7, right). High, mid-dle and low terraces are consistently favoured, al-though a slight reduction in the average viewshed might be observed – 31km2 (Fig. 5). Nonetheless,
the highest average visual link (4.7) would seem to imply that specialisation and complementary sites were continuing and even progressing (Fig. 6). The distribution of stable settlements over the Cucu-teni period underlines that territorial trends be-tween the Cucuteni A and Cucuteni A–B/B period were in accordance with a very well organised terri-torial network. These new spatial configurations were not the result of new organisational models, but rather of the strengthening of past trends. This is clear from a comparison of settlement patterns during the Early Neolithic (6000–5300 BC) and Chal-colithic (4600–3500 BC), in which the polarities are more or less the same (Fig. 8B). The evolving trends were more precise territorial control in rela-tion to exchange networks and an enhancement of the appropriation of natural resources corresponding to the development of craft specialisations (specific pastoralism, crop production, salt production, etc.). Conclusion
It has been asserted that the penetration and disse-mination of early Moldavian agro-pastoral communi-ties followed the general trends observed in Eastern and southeastern Europe (Ursulescu 1995; Tasi≤
2002): a Neolithisation process closely connected with salt springs and rich soils. The distribution of salt resources in the foothills of the Carpathian
Mountains marks the western limit of a settlement pattern structured by salt and brine supplies and salt production areas in the upper reaches of secon-dary valleys. The importance of fortified settlements close to salt resource is explained by the need to con-trol accesses to salt production sites and circulation networks through the main fluvial corridors. To the west of the Siret Valley, e.g., in areas charac-terised by fertile, well-drained black soils, agricul-tural colonisation has been observed, especially du-ring the Cucuteni A period. This region was thus able to support a very dense settlement pattern es-tablished around high and fortified settlements. Be-ing located in a dominant position, they controlled both hydrographic networks and a set of secondary settlements.
The increase in settlement numbers during the sec-ond part of the 5thmillennium was caused by three
simultaneous factors: population growth released new agents of settlement; the evolution of agricultu-ral and pastoagricultu-ral practices led to greater mobility and specialisation in farming methods; the intensifica-tion of territorial hierarchies led to the emergence of federating centres and formalised trade (Lichardus,
Lichardus-Itten 1985).
Land use between the Carpathian Mountains and Ri-ver Prut was highly dependent on two factors: the availability of highly productive soils and the acces-sibility of easily exploitable salt springs. Forms of hu-man settlement seem to have differed, depending on these resources.
In the Moldavian Plain, groups of different status have been observed. Hilltop or fortified settlements enjoy specific access to land resources that is quite different from that found in open sites close to flood-plain river channels. Several seasonal agricultural and/or pastoral occupations gravitate around these two distinct types of settlement. In the foothills area, salt springs were surrounded by many modest occu-pations, for example in the northern area of the study. Ethno-archaeological approaches (Alexianu et al.
2011) allow us to reassess this specific settlement organisation. Indeed, an association of agents who specialised in seasonal salt exploitation may be sug-gested in relation to pastoral activities. This study of the structural process leading to the intensification of environmental uses during the Late Prehistory must be deepened through a global approach aimed at a better understanding of land appropriation processes.
Alexianu A., Weller O., Brigand R., Curca˘ R., Cotiuga˘ V. and Moga I. 2011. Salt springs in today’s rural world. An ethnoarchaeological approach in Moldavia (Romania). In M. Alexianu, O. Weller and R. Curca˘ (eds.),
Archaeo-logy and AnthropoArchaeo-logy of Salt. A Diachronic Approach. BAR IS 2191. Archaeopress. Oxford: 7–23.
Alexakis D., Sarris A., Astaras T. and Albanakis K. 2011. Integrated GIS, remote sensing and geomorphologic ap-proaches for the reconstruction of the landscape habita-tion of Thessaly during the Neolithic period. Journal of
Archaeological Science 38: 89–100.
Ba˘ca˘uanu V. 1968. Cîmpia Moldovei. Studiu
geomorfo-logic. Ed. Academiei Republicii Socialiste România. Bucha-rest.
Baxter M. J., Beardah C. C. and Wright R. V. S. 1995. Some archaeological applications of kernel density estimates.
Journal of Archaeological Science 24: 347–354. Bem C. 2007. Traian-Dealul Fântânilor. Fenomenul
Cu-cuteni A–B. Ed. Cetatea de Scaun. Târgoviste.
Boghian D. 2004. Comunita˘tile cucuteniene din
bazin-ul Bahluibazin-ului. Ed. Universita˘tii “Stefan cel Mare”. Suceava. Brigand R., Asa˘ndulesei A., Weller O. and Cotiuga˘ V. 2012. Contribution à l’étude du peuplement chalcolithique des basins hydrographiques des Bahluiet et Valea Oii (dép. Iasi). Dacia. Revue d’Archéologie et d’Histoire Ancienne
N.S. 56: 5–32.
Brigand R., Weller O. 2012. Natural resources and settle-ments dynamics during Later Prehistory in central Molda-via (Romania). An integrated GIS for spatial archaeolog-ical studies. In V. Cotiuga˘and, S. Caliniuc (eds.),
Interdi-sciplinarity Research in Archaeology. Proceedings of the First Arheoinvest Congress, 10–11 June 2011, Iasi, Ro-mania. BAR IS 2433. Archaeopress. Oxford: 1–18.
Cârciumaru M., Monah D. 1987. Déterminations paléobo-taniques pour les cultures Precucuteni et Cucuteni. In M. Petrescu-Dîmbovita, N. Ursulescu, D. Monah and V. Chi-rica (eds.), La civilization de Cucuteni en contexte
euro-péen. Bibliotheca Archaeologica Iassensis 1. Iasi: 167–174. Chirica V., Tanasachi M. 1984. Repertoriul arheologic al
judetului Iasi. Vol. 1–2. Institutul de Istorie si Arheologie “A. D. Xenopol”. Ed. Universita˘tii “Al. I. Cuza”. Iasi. Conolly J., Lake M. 2006. Geographic Information
Sy-stems in archaeology. Cambridge Manuals in Archaeo-logy. Cambridge University Press. Cambridge.
Cucos S. 1999. Faza Cucuteni B în zona subcarpatica˘ a
Moldovei. Bibliotheca Memoriae Antiquitatis VI. Ed. Con-stantin Matasa˘. Piatra Neamt.
Danu M., Weller O. and Gauthier E. 2010. Human impact and vegetation history on salt spring exploitation (Ha˘la˘-butoaia-Tolici, Petricani, Neamt, Romania). International
Journal of Conservation Science 1(3): 167–173. Dumitroaia G. 1994. Depunerile Neo-Eneolitice de la Lun-ca si Oglinzi, judetul Neamt. Memoria Antiquitatis 19: 7–
82.
Gandini C., Favory F., Nuninger L. (eds.) 2012. Settlement
pattern, production and trades from Neolithic to Middle Ages. Archaedyn. BAR IS 2370. Archaeopress. Oxford. Lazarovici G., Lazarovici C.-M. 2003. The Neo-Eneolithic architecture in Banat, Transylvania and Moldavia. In D. V. Grammenos (ed.), Recent Research in the Prehistory
of the Balkans. Publications of the Archaeological Insti-tute of Northern Greece 3. Thessaloniki: 369–486. Lichardus J., Lichardus-Itten M. 1985. La Protohistoire de
l’Europe. Le Néolithique et le Chalcolithique. Nouvelle Clio, Presses Universitaires de France. Paris.
References
This project is supported by the CNRS, the French Foreign Office, the Franche-Comté and Panthéon-Sorbonne Universities and developed in association with the History and Archaeology Museum in Piatra Neamt (Archaeological Centre of Research on Cucuteni Culture). In Iasi County, our research has proceeded with the close collaboration of A. I. Cuza University, the ARHEOINVEST Platform and the Archaeological Institute. This contribution is also a result of a post-doctoral scholarship (CommScie POSDRU 89/1.5/S/ 63663) and has ben-efited from a project in Romania directed by M. Alexianu (CNCS, PN–II–ID–PCE–2011– 3–0825). We also want to thank the Archaedyn programme for the methodological contributions, the MSHE C. N. Ledoux (USR 3124, Besançon) and the ARHEOINVEST Platform for providing technical support.
ACKNOWLEDGEMENTS
∴
∴
Lupascu G. 1996. Depresiunea Craca˘u-Bistrita. Studiu
pedogeografic. Ed. Corson. Iasi.
Merutiu V. 1912. Sarea în pa˘mântul roma˘nesc. Buletinul
Societa˘tii Regale Române de Geografie 33(1–2): 69–162. Marinescu-Bîlcu S. 1993. Les Carpates orientales et la Mol-davie. In J. Kozłowski (ed.), Atlas du Néolithique
euro-péen. Vol. I: L’Europe orientale. Études et recherches ar-chéologiques de l’Université de Liège (ERAUL) 45. Liège: 191–241.
Monah D., Cucos S. 1985. Aseza˘rile culturii Cucuteni
din Romania. Ed. Junimea. Iasi.
Monah D. 2002. L’exploitation préhistorique du sel dans les Carpates orientales. In O. Weller (ed.), Archéologie du
sel. Techniques et sociétés. Internationale Archäologie, ASTK 3, Verlag Marie Leidorf GmbH. Rahden: 135–146. Nicola˘escu-Plopsor C. S., M. Petrescu-Dîmbovita 1959. Principalele rezultate ale cerceta˘rilor arheologice de la Bi-caz. Materiale si cerceta˘ri arheologice 5: 45–60. Nuninger L., Saligny L., O∏tir K., Poirier N., Fovet E., Gan-dini C., Gauthier E., Kokalj Z. and Tolle F. 2012. Models and tools for territorial dynamics studies. In C. Gandini, F. Favory and L. Nuninger (eds.), Settlement pattern,
production and trades from Neolithic to Middle Ages. Archaedyn. BAR IS 2370. Archaeopress. Oxford: 23–37. Popovici D. N. 2000. Cultura Cucuteni faza A.
Reperto-riul aseza˘rilor. Bibliotheca Memoriae Antiquitatis VIII. Ed. Constantin Matasa˘. Piatra Neamt.
Rodier X. (ed.) 2011. Information spatiale et
archéolo-gie. Errance, Paris.
Sandru I. 1952. Contributii geografico-economice asupra exploata˘rii slatinelor în Bucovina de Sud. Studii si
Cer-ceta˘ri Stiintifice 3(1–4): 407–428.
Silverman B. W. 1986. Density estimation for statistics
and data analysis. Chapman & Hall. London.
Tasi≤ N. 2002. Salt trade in the Neolithic of southeast Eu-rope. In O. Weller (ed.), Archéologie du sel. Techniques
et sociétés. Internationale Archäologie, ASTK 3, Verlag Marie Leidorf GmbH. Rahden: 147–152.
Ursulescu N. 1995. L’utilisation des sources sales dans le Néolithique de la Moldavie (Roumanie). In M. Otte (ed.),
Nature et Culture. Études et recherches archéologiques de l’Université de Liège (ERAUL) 68. Liège: 487–495.
2000. Contribustii privind Neoliticul si Eneoliticul din
regiunile est-carpatice al României. Ed. Universita˘tii “Al. I. Cuza”. Iasi.
Va˘leanu M.-C. 2003. Aseza˘ri Neo-Eneolitice din
Moldo-va. Ed. Helios. Iasi.
van der Leeuw S., Favory F. and Fiches J.-L. (eds.) 2003.
Archéologie et systèmes socio-environnementaux: étu-des multiscalaires sur la vallée du Rhône dans le pro-gramme ARCHEOMEDES. Monographie du CRA. CNRS Editions. Paris.
Velcea V., Savu A. 1982. Geografia Carpatilor si a
sub-carpatilor Românesti. Ed. didactica˘si pedagogica˘. Bucha-rest.
Volontir N. 1990. Dinamica învelisului vegetal si modifi-ca˘rile climatice în holocen din tinutul de SE al Republicii Moldova. Lucra˘rile Seminarului Geografic “Dimitrie
Cantemir” 10: 65–71.
Weller O., Brigand R. and Alexianu M. 2007. Cerceta˘ri si-stematice asupra izvoarelor de apa˘ sa˘ra˘ta˘ din Moldova. Bilantul exploa˘rilor din anii 2004–2007 efectuate în spe-cial în judetul Neamt. Memoria Antiquitatis 24: 121–190. 2010. Recherches systématiques autour des sources salées de Moldavie. Bilan des prospections 2008–2010.
Memoria Antiquitatis 25–26: 437–504.
Weller O., Brigand R., Nuninger L. and Dumitroaia G. 2011. Spatial Analysis of Prehistoric Salt Exploitation in Eastern Carpathians (Romania). In M. Alexianu, O. Weller and R. Curca˘ (eds.), Archaeology and Anthropology of Salt. A
Diachronic Approach. BAR IS 2191. Archaeopress. Ox-ford: 69–80.
Weller O., Dumitroaia G. 2005. The earliest salt produc-tion in the world: an early Neolithic exploitaproduc-tion in
Poia-na Slatinei-Lunca, Romania. Antiquity 79(306): http:// www.antiquity.ac.uk/projgall/weller/
Wheatley D., Gillings M. 2002. Spatial Technology and
Archaeology. The Archaeological Applications of GIS. Taylor & Francis. London.
Zaharia N., Petrescu-Dîmbovita M. and Zaharia E. 1970.
Aseza˘ri din Moldova. De la Paleolitic si pîna˘în secolul al XVIII–lea. Ed. Academiei Republicii Socialiste România. Bucharest.