DEPARTEMENT DE GENIE DES PROCEDES
N° D’ORDRE : D….. /2015
THESE
Présentée pour obtenirLE DIPLOME DE DOCTORAT EN SCIENCES
SPECIALITE : GENIE DES PROCEDES
Par
BOUHADJAR Sâadia Ilhem
MEMBRANE BASED INTEGRATED ANAEROBIC-AEROBIC
PROCESS FOR THE TREATMENT OF TEXTILE WASTEWATER
Soutenue le devant la commission d’examen:
Président : N. BENDERDOUCHE Professeur Université de Mostaganem Examinateur : B. BESTANI Professeur Université de Mostaganem Examinateur : D. BENACHOUR Professeur Université de Sétif-1
Examinateur : A. FIGOLI Docteur Université de Calabria, Italie Encadreur : M. DJENNAD Professeur Université de Mostaganem Co-Encadreur : J. HOINKIS Professeur Université de Karlsruhe, Allemagne
1
DEDICATION
To the person from whom I learnt that success has to be deserved and not inherited, “Sidi Khaled Bentounes”
To those who believed in me since my childhood, their love, their support, their education their sacrifice, made me understand what does family mean,
“My parents”
To the one whom without him I can never imagine my life, his fun, his love, his support in hard as in good times,
“My brother” To my spiritual energy, my eternal love,
“Grandmothers and Grandfathers” To my best friends for ever,
“ Nesrine”, “ Zora” To my spiritual family…
2
ACKNOWLEGMENTS
My special gratefulness goes to the German Academic Exchange Service (DAAD), for the financial support, giving me such the chance to realise my PhD work in the frame of an exchange programme between Karlsruhe University of Applied Sciences, Germany and Mostaganem University, Algeria.
I would like to express my profound and deep thanks to Prof. Jan Hoinkis, Department of Sensor Systems Technology, Faculty of Electrical Engineering and Electronics, Karlsruhe University of Applied Sciences, Karlsruhe, Germany. Without his assistance and guidance throughout this thesis, as well as his expert knowledge, it would have been impossible to complete this thesis.
To the person who made my dreams coming true, supported till the last minute that this scholarship can make part of my professional life, Prof. Dr. Mhamed Djennad, Mostaganem University. Who even the geographical distance, he has been present following the advancement of my work step by step. Many deep thanks therefore.
To all my professors and teachers that contributed directly or indirectly to enrich my knowledge since school time till the university.
My special thanks go to the staff of Mostaganem University, professors, administration and colleagues for their support in and outside Algeria.
I would also like to express a special thanks to Shamim Ahmed Deowan, for his support and his high level knowledge in MBR technology that enriched my understanding to the thesis subject. Not only scientifically, the person he is, made our work from a laboratory team to a familiar atmosphere.
This thesis gave the chance to know nice people through the world especially in Italy. Thereby I mean ITM, CNR team in Calabria, for their vast support regarding membrane characterization field, beside this, their hospitality enchanted our scientific team with an amazing spirit. Alberto, Francesco, Alessandra, Alfredo, Fitim, Paola, you just made it special, many thanks therefore.
3 Many thanks to Daniel from Swansea University for his special support, that I had the chance to know through BioNexGen project, (2010-2014) for realizing SEM images that made the scientific value of this thesis more valuable.
Thanks to Margarita Aleksandrova who carried out all the equipment calibration and was always more than happy to assist with lab work when help was required. Her clear explanations of the lab machinery helped greatly in general understanding and on how to correctly carry out the measurements. It was a pleasure to work with her in the same team, for the nice person she is.
Thanks to my colleague Stefan Schmidt who, although being involved in his thesis, he provided valuable assistance when it was required. Attending conferences and summer schools together was always a pleasure in a scientific friendly atmosphere.
I would also like to mention my various other lab partners throughout this thesis; Catherine, Torsten and Michael for helping out in their respective fields, everyone played a part in my completion of this thesis. Without their support understanding the technical structure of the fermenter and the different sensors used during this work, the experimental work of this thesis would never have seen light.
Lubna, Vu, Son, Stephen, Xiayon; master and bachelor students that made the company in the laboratory so special so international.
Deep thanks for Mrs Brandt, Mrs Broda, Mr Wernthal, Mr Westermann for their technical support in logistic, when needed. Their assistance was not only for my thesis fruitful, but helped amazingly, that I could improve my German skills.
And finally I would like to thank all those that I might have forgotten to mention their names, but my thesis will always testimony their nice contribution to the realization of this work.
4
CONTENTS
1. REVIEW ON MEMBRANE BIOREACTORS (MBRS) FOR THE TREATMENT OF TEXTILE WASTEWATER
1.1. Introduction 24
1.2. Textile wastewater 27
1.2.1. Azo dyes 30
1.2.2. Anthraquinone dye 31
1.3. Treatment methods for textile wastewater 31
1.3.1. Aerobic biological processes 33
1.3.1.1. Bacterial processes 33
1.3.1.2. Fungi 34
1.3.2. Anaerobic biological processes 34 1.3.3. Physical chemical processes 38
1.3.3.1. Chemical methods 38
1.3.3.2. Physical methods 39
1.4. Membrane bioreactor (MBR) technology and textile wastewater treatment 41
1.4.1 Membrane processes 41
1.4.2. Membrane Materials 44
1.4.3. Technical membrane modules 45 1.4.4. Membrane system operations modes 47
1.4.5. MBR configurations 48
1.4.6. Factors affecting MBR technology 50
1.4.6.1. Membrane fouling 51
1.4.7. Applications of MBR 52
1.4.7.1. MBR Technology in wastewater treatment 52 1.4.7.2. MBR Technology in textile wastewater
5 2. MATERIALS AND METHODS
2.1 Experimental set-up: Side Stream Membrane Bioreactor unit (SSMBR) 79
2.2 Model Textile Dye Wastewater (MTDW) 81
2.3 Spectrophotometer method (UV-VIS) 83
2.4 COD measurement 85
2.5 BOD5 85
2.6 TOC 85
2.7 Sonicated reactor sample 86
2.8 Nitrogen (N-) compounds 86
2.8.1 Total-N 86
2.8.2 Ammonium NH4+-N 87
2.8.3 Nitrate NO3—N 87
2.9 Mixed Liquor Suspended Solids (MLSS) 87
2.10 pH sensor 88
2.11 Conductivity sensor 88
2.12 Dissolved oxygen sensor 88
2.13 Theoretical calculation of the MTDW 88
2.13.1 Chemical Oxygen Demand (COD) 88
2.13.2 Total Nitrogen (TN) 89
2.13.3 Total Organic Carbon (TOC) 90
2.13.4 Total Inorganic Carbon (TIC) 91
2.14 Membrane Materials 91
2.15 Characterization of membranes 95
2.15.1 Scan Electron Microscopy (SEM) 95
2.15.2 Atomic Force Microscopy (AFM) 95
2.15.3 Cross flow membrane testing cell 95
2.15.4 Porosoty 97
2.15.5 Molecular weight cut-off (MWCO) 98
6
3. EXPERIMENTAL RESULTS
3.1. Water permeability and fouling test
3.1.1. Commercial membranes 102
3.1.1.1. UF 102
3.1.1.2. NF 106
3.1.2. Novel membranes 108
3.1.2.1. Novel PBM membrane based on DTAB 108
3.1.2.2. Novel PBM membrane based on AUTEAB 111
3.2. Treatment under aerobic conditions
3.2.1. Water permeability 115
3.2.2. COD removal efficiency 117
3.2.3. COD in feed and COD in reactor 118
3.2.4. COD to TOC removal efficiency (ratio) 119
3.2.5. COD and TOC removal efficiency 120
3.2.6. Nitrogen balance 121
3.2.7. Hydraulic Retention Time (HRT) 121
3.2.8. Organic Loading Rate (OLR) 122
3.2.9. F/M Ratio 123
3.2.10. Mixed Liquor Suspended Solids (MLSS )and Turbidity 124
3.2.11. pH value 125
3.2.12. Conductivity 125
3.2.13. CO2 and O2 in exhaust air 126
3.2.14. Temperature 126
7 3.3. Treatment under anaerobic conditions
3.3.1. Water Permeability 130
3.3.2. COD removal efficiency 132
3.3.2.1.COD in reactor 134
3.3.2.2.COD Rejection and CH4 Production 134
3.3.3.TOC Rejection 135
3.3.3.1.TOC vs COD removal efficiency 136
3.3.4. Nitrogen (N) balance 137
3.3.5. Hydraulic Retention Time (HRT) 138
3.3.6. OLR 138
3.3.7. F/M Ratio 140
3.3.8. MLSS 140
3.3.9. pH 141
3.3.10.CH4 in Exhaust Gas and Volatile Fatty Acid (VFA) Comparison 142
3.3.11.CH4 in Exhaust Gas and NaOH Dosing 143
3.3.12. CO2/CH4 concentration in Exhaust Gas 144
3.3.13. Colour removal efficiency 144
3.4. Aerobic MBR as part of an integrated anaerobic/aerobic MBR process
3.4.1. Water permeability 147
3.4.2. COD removal efficiency 147
3.4.3. TOC in feed and removal efficiency 148
3.4.4 COD and TOC removal efficiency 149
3.4.5. TN balance 149
3.4.6. Hydraulic Retention Time (HRT) 150
3.4.7. OLR 151
3.4.8. F/M Ratio 151
3.4.9. Mixed Liquor Suspended Solids (MLSS) 152
3.4.10. pH 152
3.4.11. CO2 and O2 in exhaust air 153
3.4.12. Temperature 154
3.4.13. Colour removal efficiency 154
8 Appendix
Membrane characterisation by SEM und AFM 160
UF NF AUTEAB DTAB
Visual impressions 168
4. CONCLUSION AND OUTLOOK
Conclusion 172
9
SUMMARY
Chemical and allied process industries use water extensively, thus making them water intensive industries. These needs for water are satisfied using the following sources: Surface water groundwater, desalinated seawater, recycled water (industrial wastewater and urban sewage) (Ranade, Bhandari, 2014). This raises the question whether these sources are enough for the future generations? Is our water consumption reasonable? How can we improve sustainable treatment methods for the wastewater we produce? These questions were the starting point of this thesis, for which the main objective is to find a sustainable solution for the treatment and reuse of wastewater in the textile industry which is among the most serious problems in the wastewater sectors. Wastewater from dyeing and finishing processes in the manufacturing industry constitute a substantial source of pollution which exhibits intense colour, high COD, fluctuating pH and suspended particles (Merzouk et al., 2008).
The choice of this subject is based on the fact that, textile industry in Algeria constitutes one of the main activities in the manufacturing sector , what leads to a huge water consumption, and consequently a high loaded wastewater effluent that needs being treated either for reuse, or for discharge respecting the legal environmental regulations. For instance the industry in Béjaia (a coastal town in Algeria) is growing quickly and discharges around 80.000 m3 every day with a large part contributed by the textile industry (Merzouk et al., 2008). This is an example that illustrates how pressing it is to study more efficient and economical water treatment process in this sector.
This thesis represents a scientific collaboration between the University of Mostaganem, Algeria and the Karlsruhe University of Applied Sciences, Germany. The whole experimental work has been conducted at the Karlsruhe University that offered the ground for profound research in the field of “Membrane Bioreactor (MBR) technology for textile wastewater treatment”, which is regarded as a promising , efficient and sustainable process, providing a sufficient water quality for reuse (Judd et al., 2003). The MBR technology is a combination of the biological degradation process and membrane filtration technology (micro- and ultrafiltration, MF, UF) and it has proved to be very effective in a variety of cases especially for high strength and low-biodegradable wastewater as in the case of textile wastewater. However, up to now textile wastewater treated by aerobic MBR typically could not comply with the reuse standard due to its high colour concentration, and therefore combination of the MBR with a downstream nanofiltration (NF) or reverse osmosis (RO) process is proposed, in
10 order to enhance the water permeate quality (Huang et al., 2009). Besides non-compliance of reuse standards MBR technology faces membrane fouling, which adversely affects performance of the treatment process (Iversen et al., 2009). Therefore this PhD thesis basically aims to study a combined aerobic/anaerobic MBR process since it is known from previous studies that anaerobic treatment of textile wastewater can significantly contribute to decolourisation particularly in the case of azo dyes (Stolz, 2001). Beside the use of conventional commercially available membranes, this work studied novel antifouling membranes. For this purpose two categories of membranes have been tested in a side stream MBR unit mainly commercial membranes (UF,NF) and novel membranes developed through collaboration of the Institute on Membrane Technology (ITM), Cosenza, Italy and the Karlsruhe University of Applied Sciences. The active layer of the commercial membrane is based on polyethersulfone (PES) and is supplied by the company Microdyn-Nadir (Microdyn-Nadir, 2014). The novel membranes were developed by modifying the commercial UF PES with a nanostructured coating through polymerisable bicontinuous microemulsion (PBM) process, where the main goal is to achieve higher hydrophilicity and anti-microbial properties in order to increase its resistance to fouling (Galiano, 2014). All the membranes have been tested at first under aerobic conditions (first step), secondly under anaerobic conditions (second step); and finally, these membranes have been tested in a combined process, where the anaerobic effluent, has been used as influent for being treated under aerobic conditions (third step).
The experimental work, has been performed in a side stream MBR unit from the company Sartorius with a reactor volume of 20 L and an external flat sheet membrane module, with an area of 0,00856m2. In order to keep the wastewater quality constant a model textile wastewater (MTWW) composed of two dyes: Acid Red 4 (Red) and Remazol Brilliant Blue R (Blue), as well as NaCl, NaHCO3, Glucose, a detergent and NH4Cl was used (Bouhadjar et
al.,2015). The purpose of these experiments was to study membrane performance (e.g. flux, permeability) and the resulting quality of treated wastewater in terms of e.g. COD removal and colour removal efficiency. To deepen the study, all used membranes have been investigated through characterisation methods such as AFM and SEM image analyses. In parallel for conducting fouling tests with a model fouling (humic acid, HA) a lab scale cross flow unit has been used as well. Besides study of operational parameters of the MBR treatment processes this work intended to be a tool for preselecting suitable membranes which will subsequently be further studied in submerged MBR which is typically used for
large-11 scale applications. It is worth mentioning that in parallel a PhD work carried out in the same research group at the University of Applied Sciences Karlsruhe studied performance of the same commercial and novel anti fouling membranes on long-term (6 months) in a small submerged MBR (Deowan, 2014). A study comparing performance of both side-stream and submerged MBR has been published (Bouhadjar et al.,2015).
The experimental period of this work started by December 2012 and ended by the end of June 2015, where the operating conditions have been fixed according to each step; firstly for the aerobic step: Temperature 20±2 °C , TMP 0,3-0,5 bar , pH 7,5±0,5, permeate flux 5-15 L/(m2 h), HRT145-200 h , MLSS 6-8 g/L , secondly for the anaerobic step Temperature 36±2 °C , TMP 0,1-0,3 bar, pH 7,5±0,5, permeate flux 2-20 L/(m2 h), HRT 117-1400 h , MLSS 12-16 g/L, within these trials membrane performance and permeate water quality, have been analysed by online and offline measurement. For this purpose TOC, colour and COD removal efficiency, the total nitrogen balance (TN in permeate, NH4+, NO3-), MLSS (mixed liquor
suspended solid), colour and COD measurements in the reactor have been the offline measurements; whereas the online parameters were pH, turbidity, dissolved oxygen, conductivity, temperature, air flow, feed, retentate and permeate pressure, cross flow, exhaust gas CO2 and O2, CH4 (during the anaerobic trial). The data were saved by the software
running the fermenter unit, and represented in graphics that allow controlling the process during the whole experimental time.
The present work has been divided as follows: First part: aerobic trials for 1 year Second part: anaerobic trials for 1 year
Third part: combined (integrated anaerobic-aerobic ) for trials 2,5 months
The purpose of the first aerobic step was to test the different membranes basically in terms of water permeability as well as COD and colour rejection. It is worth to mention that during this part a complete nitrification has been noticed, on the other hand we concluded that it is not an easy task to degrade azo dye (Red) under aerobic conditions, since the Red colour rejection showed 40% only for all the different membranes being tested during this part. Therefore during the second part the MTWW was treated under anaerobic conditions and the feed COD was increased from 2400 mg/L to 7000mg/L by adding more glucose as C-source since a higher COD level for anaerobic is preferred for anaerobic treatment. Regarding the anaerobic
12 treatment part, we had unexpectedly high permeability values in comparison to the one got within the aerobic trials, increasing from 25 L/(m2 h bar) during the aerobic trials to 200 L/(m2 h bar) during the anaerobic trials, this can be attributed to the high temperature for the anaerobic conditions, this fact was supported by the cross flow unit results, by the use of the model foulant HA. The elimination of the dyes was improved from 40% to almost 100% for the Red dye and from 50% to 85% for the Blue dye by moving from aerobic to anaerobic conditions respectively. Our target was not only having an improved elimination of the dyes but also producing biogas (CH4), however, methane production was very low since the
methanogenesis step has been inhibited. This inhibition has been indicted by occurrence of high amounts of short-chain fatty acid such as acetic acid and valeric acid. By the end of this step we realised that the acclimation time that has to be given for the biological population responsible on the degradation under anaerobic conditions, needs more time for being adapted with the operating conditions in order to produce considerable methane flow because of the dye inhibition, another reason that slowed down the methane production is that the experiments have been realised in a laboratory scale unit, which means the influent flux, may not be enough for a detectable methane flux by the methane sensor. Regarding the third part where the collected permeate from the anaerobic treatment was used as feed for aerobic treatment, called integrated anaerobic-aerobic process, a complete nitrification has been observed for all the membrane samples through the commercial as well as the novel membrane (for this step only one of the novel membrane has been tested for some technical reasons, being detailed in the PhD work): It is worth mentioning that no significant changes have been noticed in term of colour rejection during this part, since almost the whole dye amount in the MTWW has been rejected by upfront anaerobic treatment. But was remarkable is that a significant increase in term of COD rejection efficiency could be achieved from around 80% during the anaerobic trials to almost a complete rejection during the combined process.
To study fouling effect that occurred to all tested membranes, AFM and SEM images have been performed at Swansea University (England) and ITM University (Italy), these images were used to study potential fouling layers and showed consequently inline results in terms of roughness calculated based on AFM images. In general during the whole experimental work, novel membranes and NF performed better against fouling in comparison to the commercial UF.
13 For a clear report of this work, the thesis has been splitted into four main chapters.
Chapter 01: literature review that reported on textile wastewater industry as well as MBR
technology, under the different operating systems mainly aerobic and anaerobic conditions.
Chapter 02: a detailed report regarding all the materials and methods being used for the
experimental work trials during the three steps of this PhD.
Chapter 03: graphics, figures and tables that summarize all the results got within the three
steps, in parallel a discussion in depth comparing our findings to those got through other scientific works close to our field of research.
Chapter 04: conclusion and outlook dealing with future work based on these PhD findings,
and some points that still need to be elaborated and tested under different conditions other than the already performed. The results of this work should be compared in the future to a similar work that would be realised for the treatment of real textile wastewater at an industrial scale.
References:
Bouhadjar, S.I., Deowan, S.A., Galiano, F., Figoli, A., Hoinkis, J., Djennad, M., Performance of commercial membranes in a side-stream and submerged membrane bioreactor for model textile wastewater treatment, Desalination and Water Treatment, (2015) (online available)
Development of Membrane Bioreactor (MBR) Process Applying Novel Low Fouling Membranes,S. A. Deowan, January 2014.
Huang, R., Hoinkis, J., Hu, Q., Koch, F., Treatment of dyeing wastewater by hollow fiber membrane bioreactor, Desalination and Water Treatment, 11 (2009) 1-6
Iversen, V., Mehrez, R., Horng, R.Y., Chen, C.H., Meng, F., Drews, A., Lesjean, B., Ernst, M., Jekel, M., Kraume, M., Fouling mitigation through flocculants and adsorbents addition in membrane bioreactors: Comparing lab and pilot studies, Journal of Membrane Science, 345(2009)21-30.
Judd, S., Jefferson, B., Industrial wastewater recovery and re-use with membranes, Filtr.Sep.,40 (2003) 38-40
Merzouk, B., Khodir, M., Sekki, A., Treatment characteristics of textile wastewater and removal of heavy metals using the electroflotation technique, Desalination, 228 (2008) 245-254.
Preparation and characterization of polymerisable bicontinuous microemulsion membranes for water treatment application, F.Galiano, January 2014.
14 Ranade. V, Bhandari. M, 2014, Industrial wastewater Treatment, Recycling, and
Reuse. p1 (Elsevier).
Stolz, A., Basic and applied aspects in the microbial degradation of azo dyes, Appl Microbial Biotechnol (2001) 56:69-80
www.bionexgen.eu (accessed March 2, 2014)
www. microdyn-nadir.com (accessedMarch 2, 2014)
ABSTRACT
We are surrounded by rich diversity colour in our daily life, we all like wearing colourful clothes, who can imagine among us our world in black and white? Clothes, flowers, rainbow, foods, animals, all remain in black and white; what kind of life would it be? Hence colours are very important in our life. This described beauty can hide harmful impacts in the background, where these colours are produced, if these issues wouldn’t be immediately solved, this can lead definitively to a disaster and transform the world not only to black and white but to a polluted world where future generations would suffer from damages caused unintentionally with the pretext of replying to the high demand, which requires high production. In other words and as Saint Exupery said: “we do not inherit the earth from our ancestors, we merely borrow it from our children”. It is a responsibility before being an issue to resolve, as explained above, colours are important in our life , but their production needs not only a huge amount of water , but produces at the same time incredibly a high level of pollution, it is a matter of water pollution or more specifically, the sector meant here is textile wastewater production. The main concern of this thesis is to deal with a Model Textile Dye Wastewater (MTDW) in a combined process anaerobic-aerobic treatment to membrane filtration technology (MBR) by testing and comparing the performance of commercial available membranes (nanofiltration NF and ultrafiltration UF) to the novel antifouling membranes prepared in the frame of BioNexGen EU Project ( www.bionexgen.eu). The choice of this subject is based on several reasons, one of the most important is that Algeria is long regarded among MENA countries, as a land suffering from water scarcity, at the same time having great and active textile industry sectors that consume water and hamper the environment. On the other hand biological process proving being not only efficient but also economically cheap, but alone is not enough since this step is regarded as the first treatment stage, where COD and BOD levels are reduced, therefore the combination with the membrane filtration technology in order to discard the rest of the pollutant compounds.
15
ABBREVIATIONS
AEO alcohol ethoxylates
AFM Atomic Force Microscopy
AnMBR Anaerobic Membrane Bioreactor APEOs alkylphenol ethoxylates
ASP Activated Sludge Process
AUTEAB Acryloyloxyundecyltriethyl Ammonium Bromide BOD Biochemical Oxygen Demand
CAS Conventional Activated Sludge COD Chemical Oxygen Demand DO Dissolved Oxygen
EGDMA Ethylene Glycol Dimethacrylate EPS Extra-cellular Polymeric Substances F/M Food to Microorganism Ratio FS Flat Sheet
HA Humic Acid
HEMA 2-Hydroxylethyl Methacrylate HF Hollow Fibre
HRT Hydraulic Residence Time
H2O2 Hydrogen peroxide
KDa Kilo Dalton
LAS linear alkylbenzene sulphonates MBR Membrane Bioreactor
MLSS Mixed Liquor Suspended Solids MMA Methylmethacryate
MTDW Model Textile Dye Wastewater MW Molecular Weight
MWCO Molecular Weight Cut Off NF Nanofiltration
NH4+-N Nitrogen concentration in ammonia
NH3--N Nitrogen concentration in nitrate
NO2--N Nirogen concentration in nitrite
16 PE Polyethylene
PES Polythersulfone
PET Polyethylene Terephthalate
PhACs Pharmaceutical Active Compounds PVC Polyvinylchloride
PVDF Polyvinylidene Difluoride PP Polypropylene
RO Reverse Osmosis
SEM Scan Electronic Microscopy SRT Solid Retention Time
TC Total Carbon
TOC Total Organic Carbon TMP Transmembrane Pressure
TMEDA Tetramethylethylene Diamine TN Total Nitrogen
UF Ultrafiltration
UASB Conventional upflow anaerobic sludge blanket WHO World Health Organization
WP Water Permeability
17
LIST OF FIGURES
Figure 1.1.Water scarcity in 2030 based on the Falkenmark Indicator (Source: Wallace, 2000) Figure1.2. Proper perspective for water sustainability (adapted from V.Ranade, M.Bhandari, 2014)
Figure.1.3. Future water demand in Algeria Hamiche et al,. 2014)
Figure.1.4. Schematic of operations involved in textile cotton industry and the main pollutants from each step (adapted from Dos Santos et al., 2007)
Figure.1.5. General chemical structure of azo compounds
Figure.1.6.Anaerobic and aerobic degradation pathways of azo des and aromatic amines (De Jager et al., 2013)
Figure.1.7.General chemical structure of anthraquinone compounds
Figure.1.8. Energy consumption pattern in separation processes. (adapted from Ranade and Bhandari, 2014)
Figure.1.9. Metabolic pathway of anaerobic degradation. (adapted from Khanal, 2008) Figure1.10. Schematic of membrane (adapted from Judd, 2006)
Figure1.11. Membrane processes characteristics (Biwater, 2015) Figure1.12. Membrane material, from lab-scale to industrial scale
Figure1.13. Schematics showing flow through membrane configured as: (a) FS,(b) CT or (MT) and (c) HF( adapted from Judd, 2006)
Figure1.14. Dead-end operating process Figure 1.15. Crossflow operating process
Figure1.16.Membrane Bioreactor (MBR) configurations
Figure 1.17.Inter-relationships between MBR parameters and fouling (adapted from Judd, 2006) Figure1.18. Schematic illustration showing the role of characterization approaches in opening Black Box of membrane fouling (Fangang et al., 2010)
Figure1.19. Membrane cleaning methods
Figure.1.20. Elimination rate of PhACs in MBR and CAS treatment (Radjenovic et al., 2007a)
Figure.1. 21.Number of articles published in journals on AnMBR and UASB (Scopus 2011) Figure 2.1. Simplified diagram for the PhD work
Figure.2.2. Experimental setup of the side stream MBR unit and main screen of the DCU system showing all sensor data
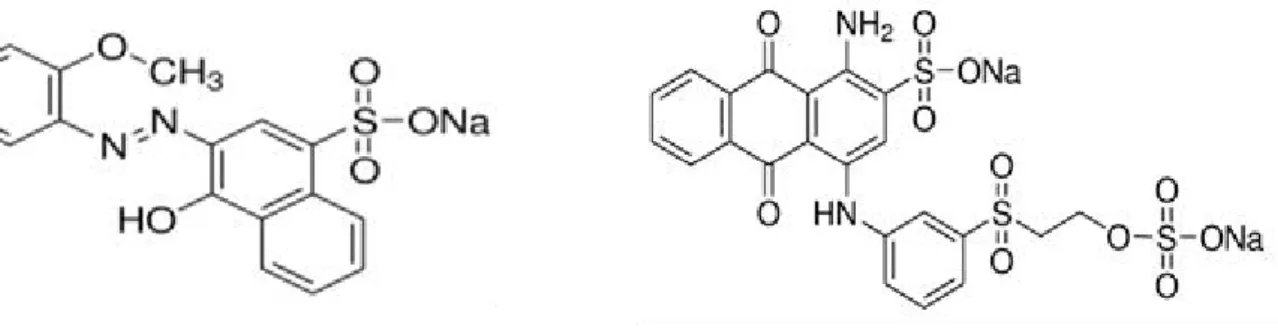
Figure.2.3.Schematic representation of the side stream MBR unit Figure.2.4. Structure of Acid Red4
18 Figure. 2.5. Structure of Remazol BlueR
Figure 2.6. Absorption spectrum of the red dye solution (50mg/L) Figure 2.7. Absorption spectrum of the blue dye solution (50mg/L)
Figure 2.8. Absorption spectrum of the mixed solution of the red and blue dye (50% of each dye)
Figure 2.9. Schematic diagram for TOC measurement process (a) TC measurement, (b)TIC measurement.(adapted from Shimadzu, 2015)
Figure 2.10 AUTEAB Molecular structure of AUTEAB (Galiano, 2014) Figure2.11 DTAB Molecular structure of DTAB (Galiano, 2014)
Figure 2.12 Coating of a commercial UF PES membrane by Polymerisation of Bicontinuous Microemulsions (PBM) (adapted from Galiano, 2014)
Figure.2.13.Experimental setup of the auto-controlled UF cross-flow testing cell.
Figure.2.14 Schematic diagram of the auto-controlled UF cross-flow cell ( modified from SIMA-tec GmbH)
Figure 3.1 Water flux vs. TMP of the commercial UF membrane
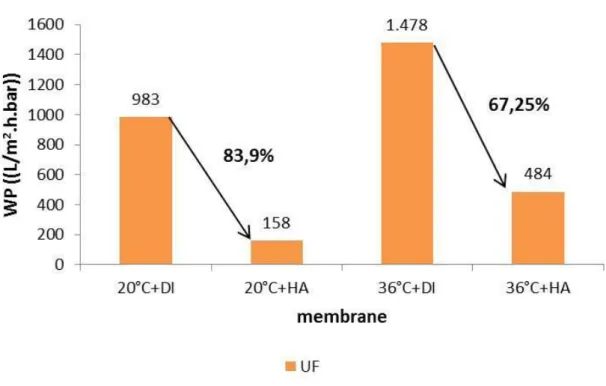
Figure 3.2 Reduction of water permeability for the UF membrane after treatmentwith HA
Figure 3.3 Visual impression of the UF membrane samples after HA treatment
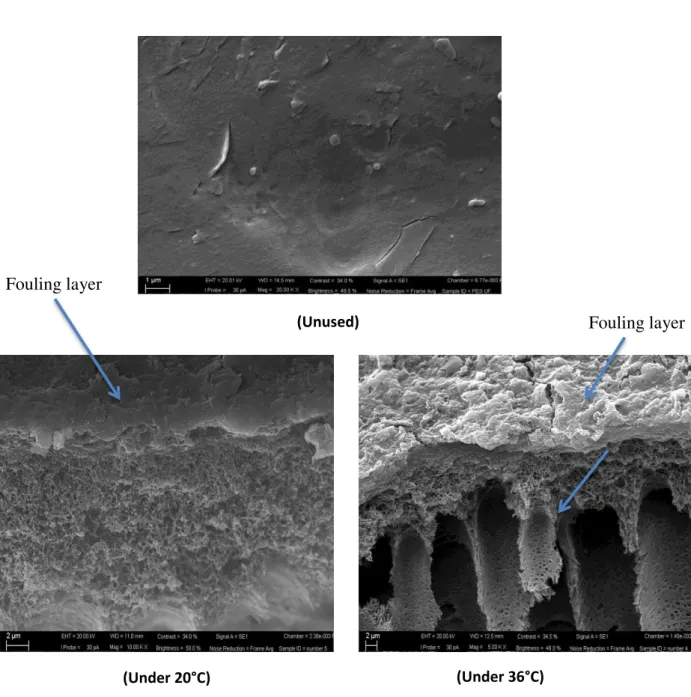
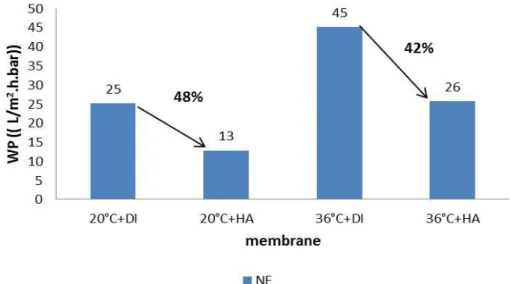
Figure 3.4 SEM images of the UF membrane, unused and after HA treatment Figure 3.5 Water flux vs. TMP of the commercial NF membrane
Figure 3.6 Reduction of water permeability for the NF membrane after treatmentwith HA Figure .3.7. Visual impression of the NF membrane samples after HA treatment
Figure .3.8. SEM images of the NF membrane, unused and after HA treatment Figure 3.9 Water flux vs. TMP of the novel PBM membrane (DTAB based)
Figure 3.10 Reduction of water permeability for the novel PBM membrane (DTAB based) after treatment with HA
Figure 3.11 Visual impression of the novel PBM membrane (DTAB based) after HA treatment
Figure 3.12 SEM images of the novel PBM membrane (DTAB based), unused and after HA treatment
Figure 3.13 Water flux vs. TMP of the novel PBM membrane (AUTEAB based)
Figure 3.14 Reduction of water permeability for the novel PBM membrane (AUTEAB based) after treatment with HA
Figure 3.15 Visual impression of the novel PBM membrane (AUTAB based) after HA treatment
19 Figure 3.16 SEM images of the AUTEAB based membrane, unused and after HA treatment
Figure.3.17. Water permeability for the commercial membranes Figure.3.18. Water permeability for the novel membranes
Figure.3.19. COD removal efficiency for commercial membranes. Figure.3.20. COD removal efficiency for novel membranes.
Figure.3.21. COD values in the reactor vs COD in permeate for commercial and novel membranes
Figure 3.22. TOC correlation to COD for the whole experimental period. Figure.3.23. Comparison of COD to TOC removal efficiency
Figure 3.24 N-compounds in the SSMBR unit during the whole experimental period
Figure 3.25 HRT for commercial and novel membranes during the entire experimental period Figure 3.26 OLR for commercial and novel membranes during the entire experimental period.
Figure.3.27. F/M ratio for commercial and novel membranes during the whole process. Figure.3.28. MLSS vs turbidity during the entire experimental period.
Figure.3.29. pH in feed and in permeate during the whole process
Figure 3.30. Concentration of CO2 and O2 in exhaust air during the entire experimental period
Figure.3.31. Temperature during the whole process.
Figure 3.32.a Red dye removal efficiency for the commercial membranes. Figure 3.32.b Blue dye removal efficiency for the commercial membranes. Figure.3.33. a. Red removal efficiency for novel membranes.
Figure.3.33. b. Blue removal efficiency for novel membranes. Figure.3.34.a. Reactor permeability for each membrane
Figure.3.34.b. Reactor permeability for the whole experimental period Figure .3.35. Comparison of COD in permeate and COD rejection Figure .3.36. COD rejection for each membrane
Figure .3.37. COD in reactor and permeate
Figure .3.38. COD rejection and CH4 production during the experimental period
Figure.3.39. Comparison of TOC in permeate and TOC rejection Figure .3.40. TOC rejection for the tested membranes
Figure .3.41. Comparison of COD and TOC rejection
Figure .3.42. TN in permeate for the entire experimental period Figure .3.43. HRT for the entire experimental period
20 Figure .3.44. OLR for the entire experimental period
Figure .3.45. Comparison of OLR and COD rejection for the entire experimental period Figure.3.46. F/M ratio for the entire experimental period
Figure.3.47. MLSS for the entire experimental period Figure .3.48. pH for the entire experimental period
Figure .3.49. CH4 concentration and VFAs for the entire experimental period
Figure .3.50. CH4 and Total VFA comparison for the entire experimental period
Figure .3.51. CH4 concentration and amount of NaOH dosing for the entire experimental
period
Figure .3.52. CH4 and CO2 concentration for the entire experimental period
Figure .3.53. Red and blue colour rejection for the whole experimental period Figure .3.54. Red colour rejection in each membrane
Figure .3.55. Blue colour rejection in each membrane
Figure .3.56. Water permeability for the anaerobically pretreated wastewater Figure 3.57 COD removal efficiency for the anaerobically pretreated wastewater
Figure .3.58. TOC removal efficiency and TOC in feed for the anaerobically pretreated wastewater
Figure 3.59. Correlation between COD and TOC removal efficiency for the anaerobically pretreated water
Figure .3.60. The TN- balance for the anaerobically pretreated water Figure .3.61. HRT results for the anaerobically pretreated water Figure .3.62. OLR for the anaerobically pretreated water
Figure .3.63. F/M ratio for the anaerobically pretreated water
Figure .3.64. MLSS and turbidity for the anaerobically pretreated water Figure .3.65. pH for the anaerobically pretreated water
Figure .3.66. CO2 and O2 in exhaust gas for the anaerobically pretreated water
Figure .3.67. The correlation between CO2 to the COD removal efficiency for the
anaerobically pretreated water
Figure .3.68. Temperature during the experimental period for the anaerobically pretreated water
Figure .3.69. Colour rejection from feed to permeate of the combined anaerobic/aerobic process
21
LIST OF TABLES
Table.1.1. Wastewater generated, treated and used in Middle East and North Africa (MENA). Table. 1.2 Characterisation of the cotton wet processing (André B.dos Santos et al.,2007) Table 1.3.Conventional textile wastewater treatment processesa
Table.1.4. Colour removal by anaerobic granular sludge under mesophilic conditions
Table.1.5. Advantages and disadvantages of some physical/chemical decolourisation processes applied to textile wastewaters (adapted from Robinson et al., 2001)
Table.1.6. Membrane configurations
Table .1.7. Comparison between SSMBR and SMBR configurations (Visvanathan, 2011) Table.1.8. Treatment performance of lab-scale AnMBRs used for the treatment of various industrial wastewaters.
Table. 1.9 Literature summary of aerobic MBR processes for the treatment of textile wastewater
Table. 1.10. Literature summary of anaerobic MBR processes for the treatment of textile wastewater
Table 2.1. Composition of the Model Textile Dye Wastewater (MTDW) Table 2.2. Characteristics of Model Textile Dye Wastewater (MTDW) Table 2.3. Characteristics of red and blue dyes
Table 2.4. Oxidation reactions for the carbon containing components in the MTDW Table 2.5. Theoretical and measured COD values
Table2.6:Theoretical and measured TOC values
Table 2.7. Technical data of UF and NF membranes from the company MICRODYN-NADIR (Microdyn-Nadir, 2014)
Table 2.8 Preparation conditions of novel membranes
Table.2.9. characterisation of commercial and PBM novel membranes. Table 3.1. Commercial and novel membranes used under aerobic conditions Table. 3.2. Operating conditions of MBR under aerobic conditions
Table 3.3 Preferred ranges of operating parameters in MBR and CAS
Table 3.4. Commercial and novel membranes used under anaerobic conditions Table .3.5. VFA chemical formulae
Table. 3.6. Operating conditions of MBR under aerobic conditions
22 Table 3.8. Characteristics of Model Textile Dye Wastewater (MTDW)
23
CHAPTER 01
24
1.1. Introduction
There is growing evidence of a global water crisis, of which the most obvious manifestation is that 1.2 billion people lack access to safe and affordable water for their domestic use (WHO, 2003). Of the total available water on earth, 97.5% is salty and is not usable for drinking purpose, of the remaining 2.5% of fresh water, only a marginal part, ~1%, is available for human consumption (V.Ranade and M.Bhandari, 2014). Since 1950, the world population has doubled, and water consumption has increased sixfold, this leads to a rapid industrial consumption growth. To a great extent, recently, parts of the world have already started feeling the ”water crunch”. It is believed that by 2030, India, China, and selected countries of Europe and Africa will face water scarcity (Figure 1.1). A recent UN report indicates that by 2025, two-thirds of the population of the world could face water stress (UNEP, 2007)
Since the distribution of water across the globe is not uniform, parts of the world are increasingly facing water scarcity. The reason can be of natural origin in some regions because of the reduced rainfall or climate changes; however, the human factor is most critical in aggravating this problem by wasting water, polluting water resources and inappropriately managing water.
Recent researches report that the total wastewater combining sewage, industrial and agricultural discharged globally is tens of millions of cubic meters per day (Corcan et al., 2010; UN Water, 2008).
Limited access to freshwater already impacts the lifestyle and development opportunities in water scarce areas (Qadir et al., 2007a). Freshwater resources and population densities are unevenly distributed worldwide. As a result, water demands already exceed supplies in regions with more than 40% of the world’s population (Bennett, 2000). By the year 2025, as much as 60% of the global population may suffer physical water scarcity (Pimentel et al., 1999; Rijsberman, 2006). Among them the Middle East and North African region is regarded as one of the most water scarce regions. In order to abate future water scarcity wastewater recycling and reuse is becoming increasingly important (Figure 1.2)
25 Figure 1.1.Water scarcity in 2030 based on the Falkenmark Indicator (Source: Wallace, 2000)
The estimated volume of wastewater enerated in the Middle East and North Africa The total wastewater generated in the MENA region is 22.3 km3/year, of which 51% (11.4 km3/year) is treated (Table 1.1). The efficiency of wastewater treatment in the MENA region is highly variable and many treatment plants have design limitations to treat a mixture of domestic and industrial wastewater, which is usually the most prevalent form of wastewater reaching the treatment plants. In addition, the wastewater treatment plants do not have the capacity to accommodate the large volumes of wastewater resulting from increasing urban populations. In some treatment plants, the retention times for wastewater treatment have become too short to be effective (Qadir et al., 2010b).
Figure1.2. Proper perspective for water sustainability (adapted from V.Ranade, M.Bhandari, 2014)
26 Table.1.1. Wastewater generated, treated and used in Middle East and North Africa (MENA).
Country Waste water Generated Wastewater Treated Treated waste water used Reporting Year Volume (km3/year) Reporting Year Volume (km3/year) Reporting year Volume (km3/year) Algeria Bahrain Egypt Iran Iraq Israel Jordan Kuwait Lebanon Libya Morocco Oman Palestenian Territories Qatar Saudi Arabia Syria Tunisia Turkey United Arab Emirates Yemen 2010 2010 2011 2010 2012 2007 2008 2008 2003 1999 2010 2000 2001 2005 2000 2002 2010 2010 1995 2000 0.730 0.084 8.500 3.548 0.580 0.500 0.180 0.254 0.310 0.546 0.700 0.090 0.071 0.055 0.730 1.364 0.246 3.582 0.500 0.074 2010 2005 2011 2010 2012 2007 2011 2005 2006 1999 2010 2006 2001 2006 2002 2002 2010 2010 2006 1999 0.150 0.062 4.800 0.821 0.580 0.450 0.115 0.250 0.004 0.040 0.124 0.037 0.030 0.058 0.548 0.550 0.226 2.719 0.289 0.046 - 2005 2011 2010 - 2004 2012 2002 2005 2000 2008 2006 1998 2005 2006 2003 2001 2006 2005 2000 NA 0.016 0.700 0.328 NA 0.262 0.108 0.078 0.002 0.040 0.070 0.037 0.010 0.043 0.166 0.550 0.021 1.000 0.248 0.006
The data are from FAQ-AQUQSTAT(2012).NA refers to not available date
Water is becoming a rare commodity in Algeria. Renewable natural water resources are estimated at approximately 15 bilion m3 per year, that is approximately 404 m3 per capita per year, near the threshold of 500 m3 per capita per year, which is widely recognized as the scarcity threshold that indicates developing scarcity and underlying crises (Hamiche et al., 2014)
The Algerian water sector is facing several limitations and problems which could, if not properly handled, limit the dynamic of economic growth that Algeria is looking for by launching a huge range of water-related projects (Figure 1.3). These limitations and problems relate primarily to decreased water resources due to the impact of climate change which has become a reality in Algeria and whose effects on our environment are already visible.
The future development of water resources depends on solutions characterized by high energy consumption, for example sea water desalination. In contrast the reuse of wastewater and the introduction of drip irrigation are comparatively lower energy solutions.
27 In general development of the water sector will therefore be closely tied to the development of the energy sector.
Figure.1.3. Future water demand in Algeria Hamiche et al,. 2014)
As it can be seen on the Figure1.3 above, the water demand for all use sectors is evaluated at approximately 20 billion m3 in 2030.
After this brief report on the water demand, use as well as pollution, it is clear that MENA countries in general and Algeria in special are facing a severe current and future problem. For this reason and in order to find a viable development the water management in this area is directed toward economisation and rationalization of the water resources (Badani et al., 2005).
1.2. Textile wastewater
Textile industry is known to be a huge water consuming sector. In fact for the production of a ton of textile product, 200-350 m3 of water are consumed (Judd et al., 2003; Schoeberl et al., 2005). Thus, the large quantity of aqueous waste generated by textile industries has become a significant environmental problem. Dye bath effluents in particular, are not only visible pollutants by the nature of their colour, but can hinder light penetration in the water of lakes, rivers or lagunas and therefore can disrupt biological processes in natural waters. Furthermore dye effluents can contain chemicals, which are toxic, carcinogenic, mutagenic, or teratogenic to various microbiological or animal species (Willcock et al.,1992).
28 Aoudj et al. (2010) mentioned that wastewater samples collected from the neighbourhood of textile industry located in Boufarik (Algeria) revealed a high contamination by synthetic dyes, most of them being toxic. In Algeria, the agricultural reutilization of treated wastewater, even industrial is more strongly in demand (Belkacem et al., 2007). It has been reported that the industry in Béjaia (coastal town in Algeria) is growing quickly and currently discharges about 80.000 m3 of wastewater each day.
Wastewater from dyeing and finishing processes in the textile manufacturing industry constitute a substantial source of pollution which is characterized by intense colour, high Chemical Oxygen Demand (COD), fluctuating pH, and suspended particles. As illustrated in the Figure 1.4.
Figure.1.4. Schematic of operations involved in textile cotton industry and the main pollutants from each step (adapted from Dos Santos et al., 2007)
29 In order to illustrate in numbers the characteristics of the wastewater generated from each step among those mentioned on Figure.1. 4 above, the Table 1.2 shows a typical composition of cotton wet processing wastewaters.
Table. 1.2 Characterisation of the cotton wet processing (André B.dos Santos et al.,2007)
Process COD (g/L) BOD (g/L) TS (g/L) TDS (g/L) pH Colour (ADMI) Water usage (L/kg) Desizing 4.6-5.9 1.7-5.2 16-32.0 - - - 3-9 Scouring 8.0 0.1-2.9 7.6-17.4 - 10-13 694 26-43 Bleaching 6.7-13.5 0.1-1.7 2.3-14.4 4.8-19.5 8.5-9.6 153 3-124 Mercerising 1.6 0.05-0.1 0.6-1.9 4.3-4.6 5.5-9.5 - 232-308 Dyeing 1.1-4.6 0.01-1.8 0.5-14.1 0.05 5-10 1450-4750 8-300 ADMI: American Dye Manufacturer Institute
Indeed, the textile industry utilizes about 10,000 pigments or dyes, most of them are toxic substances to human and aquatic life and it has been reported that 15% of the used dyes are released into wastewaters (Daneshvar et al., 2006). Therefore they have be treated before finale discharge to achieve legal and aesthetic standards. EU Directive 91/271 imposes limits on colour, as it reduces light penetration in receiving water bodies (EU Directive, 2015). This is particularly a critical problem in Algeria where textile industry is highly developed. Conventional methods for removing dyes from textile waste water consist mainly of biological and physicochemical treatments and their various combinations (Belkacem et al., 2008).
Without adequate treatment these dyes are stable and can remain in the environment for an extended period of time. For instance, the half-life of hydrolysed Reactive Blue19 (RB19) is about 46 years at pH 7 and 25°C (Hao et., 2000)
Before moving to the several treatment methods, it is important to go further into details regarding dyes properties in general and azo and anthraquinone dyes in particular, since these two dyes were selected as model pollutants in this work.
Dyes are classified according to their application and chemical structure. They are composed of group of atoms responsible for the dye color, called chromophores, as well as an electron withdrawing or donating substituents that cause or intensify the color of the chromophores called auxochromes (André et al., 2006)
30 The most important chromophores are:
Azo (-N=N-) Carbonyl (-C=O) Methine (-CH=)
Nitro (-NO2)1.2.1. Azo dyes
It is estimated that almost 109 kg of dyes are produced annually in the world, of which azo dyes represent about 70% by weight (André et al., 2006). Azo dyes are one of the most important categories of synthetic dyes because they are easily synthesized and have a broad color spectrum (Geng et al., 2015). In general, they can be classified into monoazo dyes, disazo dyes, trisazo dyes and polyazo dyes, but the monoazo compounds account for the great majority of them. Azo dyes also have versatile applications in many fields such as optical data storage, non-linear optics, dye-sensitized solar cells, ink jet printers and metallochromic indicators. Even though some azo dyes have been reported poisonous, many additional dyes can be used in drugs and food (Kim et al., 2011). Azo dyes are generally recalcitrant due to their xenobiotic nature and exhibit considerable resistance to decolourization treatments (Novotny et al., 2006; Khalid et al., 2009; Hua et al., 2013).
Figure.1.5. General chemical structure of azo compounds
Under anaerobic conditions the reductive cleavage of azo linkage, is the first stage in the complete anaerobic–aerobic degradation process, resulting in aromatic amine as metabolites. Aromatic amines, which are formed during anaerobic treatment, are generally colourless and hazardous. Though mineralization of the aromatic amines under aerobic conditions is more common, it was reported that some aromatic amines that are characterized by the presence of hydroxyl and carboxyl groups can be mineralized under only under anaerobic conditions. As a result, combined anaerobic and aerobic conditions are essential for the complete biodegradation of coloured wastewaters (Çinar and Demiröz, 2010). Figure 1.6 illustrate the pathway of azo dye degradation via anaerobic digestion and the degradation of the resulting aromatic amine via aerobic digestion.
31 Figure.1.6.Anaerobic and aerobic degradation pathways of azo des and aromatic amines (De
Jager et al., 2013)
1.2.2. Anthraquinone dye
This class of dyes is considered as the second most important class of textile dyes (Baughman and Weber, 1994). Anthraquinone dyes have a wide range of colors in almost the whole visible spectrum but they are commonly used for violet, blue and green colors.
They have chromophore groups, =C=O and =C=C=, and can be precipitated or adsorbed only in small amounts (Lixia et al., 2014)
Figure.1.7.General chemical structure of anthraquinone compounds
1.3. Treatment methods for textile wastewater
Methods for dealing with textile wastewater consist of various biological, physical and chemical treatment processes that can be applied separately or be combined (Alinsafi et al., 2006). There are a variety of processes to remove dye from coloured effluents such as precipitation, adsorption, photodegradaion, biodegradation, chemical coagulation, electrocoagulation (Slokar et al., 1998).
32 Adsorption and precipitation have the inconvenience being very time consuming and costly with low efficiency (Daneshvar et al., 2006). Chemical degradation by oxidative agents such as chlorine is the most important and effective method, but it produces some very toxic products such as organochlorine compounds (Kim et al., 2002) . Photooxidation by UV/H2O2
or UV/TiO2 needs additional chemicals, and therefore causes a secondary pollution.
In addition, it is known that a technical process must not only be efficient, but also economically feasible regarding the operating costs and its initial investments to reach the main target, solving the environmental problems. Thus it is primordial to find a compromise between the environmental issue and the economic cost of the treatment procedure, since this does not depend only on the choice of the treatment process, but also which kind of pollutant, that has to be eliminated and the cost involved. For example the costs of adsorption, ultrafiltration and ozonation usually exceed that of chemical coagulation. When chemical coagulation is used to treat dyed wastewaters, the pollution may be caused by chemical substances added at a high concentration (Belkacem et al., 2010). The ultimate goal is to find a compromise, where cost and efficiency are taken in consideration. Several papers have reported already regarding the cost of the wastewater treatment, whether for sewage wastewater or for industrial wastewater such as textile industry, where the cost includes the operating costs for conventional operations. But these reports are more specific in their presentations, and this can be limiting from generalization point of view. In times of increasing energy costs it is therefore preferable to classify the different separations methods according to their qualitative energy consumption, see Figure 1.8 (Ranade and Bhandari, 2014),.
Figure.1.8. Energy consumption pattern in separation processes. (adapted from Ranade and Bhandari, 2014)
33 Most of the conventional treatment processes are summarised for illustration below:
Table 1.3.Conventional textile wastewater treatment processesa
a
Summarised from Dafale et al., 2010 ; González-Zafrilla et al., 2008; Badani et al., 2005; Chakraborty et al., 2003; Kural et al.,2001; Ciardelli Ranieri, 2000; Gupta et al., 2000; Slokar and Le Marechal, 1998
1.3.1. Aerobic biological processes
In recent years, many studies focused on the ability of microorganisms and their capacity to biodegrade and biosorb dyes in wastewaters; bacteria, algae, and fungi are the most important microorganisms capable of decolourizing a wide range of dyes.
1.3.1.1. Bacterial processes
The biological decolourisation has been already investigated over the past decades (Libra et al., 2004). This treatment process can be realised either under aerobic conditions or under anaerobic conditions, both are able to degrade aromatic compounds. In the case of aerobic degradation, the enzymes mono-and di-oxygenase catalyse the incorporation of oxygen from O2 into aromatic ring of organic compounds prior to ring fission (Dos Santos et al., 2007).
Although azo dyes are aromatic compounds their substituents containing mainly nitro and sulfonic groups, make them quite recalcitrant to aerobic bacterial degradation (Claus et al., 2002). This can be explained either by the fact that the electron of the azo bond has a withdrawing nature, therefore being resistant to the to the oxygenases attack, or that the oxygen is a more effective electron acceptor, having tendency to more reducing equivalents than the azo dyes.
Conventional treatment processes Physical methods Chemical oxidation Advanced oxidation
processes Biological methods Coagulation Adsorption (Activated carbon) Ion exchange Membrane filtration ( e.g. reverse osmosis, nanofiltration) UV/O3 UV/H2O2 Fenton reagent Ozonation Photocatalysis Electrochemical Sonolysis Ionising radiation Activated sludge (anaerobic, anoxic, aerobic) Sequencing batch reactor
34 1.3.1.2. Fungi
In fungal decolourization of textile waste water, fungi can be classified into two kinds according to their life state:
Living cells to biodegrade and biosorb dyes Dead cells (fungal biomass) to adsorb dyes.
Among enzymes, laccases and tyrosinases are two groups of phenoloxidases that catalyse the transformation of a large number of phenolic and non-phenolic aromatic compounds.
The capacity of fungi to reduce azo dyes is related to the formation of exoenzymes such as peroxidases and phenoloxidases. Peroxidases are hemoproteins that catalyse reactions in the presence of hydrogen peroxide (Duran et al., 2002). Lignin and manganese peroxidases have a similar reaction mechanism that starts with the enzyme oxidation by H2O2 to an
oxidized state during their catalytic cycle. Afterwards, in a mechanism involving two successive electron transfers, substrates such as azo dyes reduce the enzyme to its original form (Stolz, 2001). The first report of aerobic degradation of azo dyes by lignolytic fungi appeared in 1990, when Cripps et al. (1990) demonstrated that nitrogen-limited cultures of Phanerochaete chrysosporium decolorized the azo dyes, Acid Orange 7 (Orange II), Acid Orange 6 (Tropaeolin O), or Direct Red 28 (Congo Red). Claus et al., (2002) mentioned that anthraquinone and indigoid-based dyes are better decolourised than the azo dyes and they represents poor substrates for laccases.. Chivukula et al. (1995) cited that azo dyes must be electron rich to be susceptible to oxidation by laccase. Miranda et al. (1997) reported that the highest color removal occured at a certain nutrient concentration, mainly: 1 g K2HPO4/L and
0,5 g MgSO4. 7H2O/L. The optimum pH for decolourisation by an unidentified white-rot
fungus was pH 4-5 ( Zhang et al.,1999).
1.3.2. Anaerobic biological processes
Anaerobic biological treatment, generally has not prevalently been used in the past, for many reasons. Anaerobic reactors were supposed to be less stable under fluctuations, more expensive to install and a long start up time in comparison to the aerobic reactors. However, all these arguments were due to the weakness of the knowledge of the process and the reactor design. This remained the general opinion regarding this processes, till Young and McCarty started 1969 intense research in application of anaerobic process for the treatment of both industrial and municipal wastewaters (Younga and MCarty, 1969). In 1983 Gujer and Zehnder showed the sequence of the reactions that occur under anaerobic conditions in order
35 to transform the complex macromolecules of the organic matter present in the wastewater into biogas, thus several groups of microorganisms are required. Four different phases are distinguished in the overall conversion of the organic matter to biogas:
1) Hydrolysis 2) Acidogenesis 3) Acetogenesis 4) Methanogenesis
Figure.1.9. Metabolic pathway of anaerobic degradation. (adapted from Khanal, 2008)
1) Hydrolysis
2) Acidogenesis
3) Acetogenesis
1: Hydrolytic and non-hydrolytic fermentative bacteria. 2: Syntrophic acetogens. 3: Homoacetogens. 4: (i) Hydrogenetrophic methanogens (ii) Aceticlastic methanogens
36 4) Methanogenic bacteria – methanogens: these are the microorganisms responsible for methane production. The doubling time of these bacteria is 2-10 days, and they are further divided into two groups:
a- Hydrogen utilizers ( lithotrophs)
CO2 + 4H2 CH4 +2H2O
b- Acetic acid users ( acetotrophs)
CH3COOH CH4 +CO2
It is important to mention that the methane producing bacteria are strict anaerobes and are extremely sensitive to pH and temperature changes: Anaerobic bacteria are active under two temperature zones, namely the mesophilic range where the temperature is in between 30°C- 35°C and the thermophilic range (50°C-60°C). About 75% of methane production is from the decarboxylation of acetate and the rest is from CO2 and H2, as shown on Figure.1.9
(Visvanathan et al., 2011). The findings of Pavlostathis and Giraldo-Gomez (1991) demonstrated that the rate of hydrolyses is a function of pH, temperature, concentration of hydrolysing biomass and the type of particular organic matter, it has also been proven that the hydrolysis rate in anaerobic process is increased at elevated temperatures. This means in thermophilic range acetogens / acidogens need an optimum pH of 5.5-7.2 whereas methanogens need 6.8-7.8. The high rate of acetogen and the slow growth rate of methanogen make that the acetic acid accumulates in the anaerobic reactor. Thus the reactor pH drops and the methanogenesis is inhibited; therefore it is important to maintain the reactor pH close to neutral in order to keep the optimum methanogenic activity, either through a separated reactor operation or through alkalinity addition. Another reason that causes toxicity to the anaerobic microorganisms, is the presence of some of particular substances in the wastewater such as heavy metals, chlorinated hydrocarbons and cyanides as well as by-products of microorganisms such as ammonia, sulphide and volatile fatty acids. However, presence of inorganic nutrients such as calcium, and magnesium, trace elements such as cobalt and nickel can have a positive effect on the anaerobic metabolism. It has been found that there is 30 fold increase in CH4 production rate when Ni and other trace elements are present (Speece et al.,
2006) Since the purpose of this thesis is to study the treatment of azo as well as anthraquinone dyes their removal under anaerobic condition is of is of particular interest. The Table 1.4 illustrates the elimination rate of some of dyes treated by anaerobic granular sludge under mesophilic conditions.
37 Table.1.4. Colour removal by anaerobic granular sludge under mesophilic conditions
Type Name Decolouration
(%) Decolouration rates Comments Ref Anthraquinone Anthraquinone Anthraquinone Anthraquinone Anthraquinone Anthraquinone Anthraquinone Anthraquinone Anthraquinone Anthraquinone Anthraquinone Anthraquinone Anthraquinone Anthraquinone Anthraquinone Anthraquinone Reactive Blue 19 Acid Blue 80 Acid Blue 25 Basic Blue 22 Reactive Blue 4 Reactive Blue 19 Reactive Blue 4 Reactive Blue 19 Reactive Blue 5 Reactive Blue 49 Acid Blue 25 Disperse Red 159 Disperse Blue 56 Reactive Blue 4 Reactive Blue 19 Reactive Blue 19 70 7 67 62 57 99 73 90 37 9 68 0 0 84 84 87 - - - - 13.4 mg/l/h 14.6 mg/l/h 4.3 mg/l/h 13.0 mg/l/h - - - 0 0 - - - About 50mg/l of dye About 50mg/l of dye About 50mg/l of dye About 50mg/l of dye About 50mg/l of dye About 50mg/l of dye About 50mg/l of dye About 50mg/l of dye About 300mg/l of dye About 300mg/l of dye About 1032mg/l 1 1 1 1 2 2 3 3 4 5 6 7 8 9 9 10 Azo dye Azo dye Azo dye Azo dye Azo dye Azo dye Azo dye Azo dye Azo dye Azo dye Azo dye Azo dye Azo dye Azo dye Azo dye Azo dye Azo dye Azo dye Azo dye Azo dye Azo dye Azo dye Azo dye Azo dye Azo dye Azo dye Azo dye Azo dye Azo dye Azo dye Azo dye Azo dye Azo dye Acid Orange 7 Acid Red 266 Acid Yellow 137 Acid Yellow 159 Basic Red 23 Direct Black 19 Direct Blue 53 Direct Blue 71 Direct Red 79 Direct Red 81 Direct Yellow 4 Direct Yellow 12 Direct Yellow 50 Mordant Orange 1 Reactive Black 5 Reactive Red 2 Reactive Red 4 Reactive Yellow 2 Reactive Red 235 Reactive Blue 235 Reactive Red 198 Mordant Blue 13 Mordant Black 9 Basic Red 18 Acid Yellow 151 Direct Red 7 Acid Red 114 Direct Blue 15 Direct Yellow 12 Reactive Black 5 Acid Blue 113 Direct Black 19 Direct Black 22 99 95 95 97 99 99 99 100 97 99 95 86 99 97 99 100 99 73 100 100 95 83 77 92 88 92 62 83 75 81 94 51 61 1.49 day-1 0.20 day-1 0.35 day-1 0.72 day-1 10.00 day-1 3.00 day-1 0.24 day-1 0.61 day-1 16.60 day-1 7.80 day-1 1.03 day-1 1.17 day-1 2.00 day-1 1.74 day-1 5.00 day-1 0.31 day-1 0.45 day-1 0.01 day-1 4.42 day-1 23.5 day-1 11.6 mg/l/h - - - - - - - - - - - - About 0.3 mM of dye About 0.3 mM of dye About 0.3 mM of dye About 0.3 mM of dye About 0.3 mM of dye About 0.3 mM of dye About 0.3 mM of dye About 0.3 mM of dye About 0.3 mM of dye About 0.3 mM of dye About 0.3 mM of dye About 0.3 mM of dye About 0.3 mM of dye About 0.3 mM of dye About 0.3 mM of dye About 0.3 mM of dye About 0.3 mM of dye About 0.3 mM of dye About 50 mg/l About 50 mg/l About 300 mg/l of dye About 50 mg/l of dye About 50 mg/l of dye About 50 mg/l of dye About 50 mg/l of dye About 50 mg/l of dye About 50 mg/l of dye About 50 mg/l of dye About 50 mg/l of dye About 50 mg/l of dye About 50 mg/l of dye About 50 mg/l of dye About 50 mg/l of dye 11 11 11 11 11 11 11 11 11 11 11 11 11 11 11 11 11 11 12 12 13 1 1 1 1 1 1 1 1 1 1 1 1 1
Brown and Laboureur (1983); 2 Fontenot et al. (2002); 3 Lee and Pavlostathis (2004);4 Luangdilok and Paswad (2000); 5 Carliell et al. (1994); 6 Brown and Hamburger (1987);7 Malpei et al. (1998); 8 Delée et al. (1998) ; 9 Lee et al. (2006); 10 Lee et al. (2005); 11 Van der Zee et al. (2001); 12 Willetts and Ashbolt (2000); 13 Fontenot et al. (2003).
38 As it can be seen in Table 1.4, azo dyes are generally better degradable under anaerobic conditions than the anthraquinone dyes. This has been confirmed also through the research work of this thesis, see Chapter 3 (Results and discussion).
1.3.3. Physical chemical processes 1.3.3.1. Chemical methods
The chemical processes comprise: reduction, ion exchange, neutralisation, chemical oxidation with UV/O3, UV/H2O2 and Fenton reagent, advanced oxidation processes such as
photocatalysis, electrochemical and ionising radiation.
Due to their simplicity of handling, oxidative processes are the most commonly used chemical decolouration processes. In most cases the oxidising agent is hydrogen peroxide, which due to its stability in pure form, needs to be activated, thus decolouration methods differ depending on the way which the hydrogen peroxide is activated.
H2O2 – Fe(II) salts (Fenton’s reagent) is an activated hydrogen peroxide by Fe(II) salts
and is very suitable for the oxidation of wastewater that inhibit the biological treatment. This leads to some advantages mainly: COD and colour removal and toxicity reduction, nevertheless, since the process involves flocculation, impurities are transferred from the wastewater to the sludge, which is the major inconvenience. Therefore Peroxide-Chemie GmbH developed the so called FSR process (Fenton Sludge Recycling System), in which Fe(III)-sludge is eliminated. (Slokar et al., 1998). Fenton oxidation is recognised as a valuable method to remove colour and increase the biodegradability of dyeing wastewater, due to its high oxidative efficiency, non-selectivity and easy implementation (De Jager , 2013), but the high cost of this method makes it economically not suitable. Feng et al. (2010) found that by the combination of FOxbased on the generation of highly reactive hydroxyl radicals with a submerged aerobic MBR composed of an activated sludge reactor with a hollow fibre membrane module reduced the total organic carbon (TOC) and the colour by 39.3% and 69.5% respectively. of a wastewater from dying industry under optimal operating conditions namely an initial pH of 5, hydrogen peroxide (H2O2) concentration of 17mmol/L,
ferrous iron (Fe2+) concentration of 1,7 mmol/L.
Decolouration by means of H2O2/O3 combination is applicable for direct
metal-complex or blue disperse dyes (Strickland et al., 1995; Gregor et al., 1993). There are some problems with decolouration of acid and red (Strickland et al., 1995) disperse