HAL Id: halshs-00778517
https://halshs.archives-ouvertes.fr/halshs-00778517
Submitted on 20 Jan 2013
HAL is a multi-disciplinary open access archive for the deposit and dissemination of sci-entific research documents, whether they are pub-lished or not. The documents may come from
L’archive ouverte pluridisciplinaire HAL, est destinée au dépôt et à la diffusion de documents scientifiques de niveau recherche, publiés ou non, émanant des établissements d’enseignement et de
Assessing impact and quality from local dynamics of
citation networks
Camille Roth, Jiang Wu, Sergi Lozano
To cite this version:
Camille Roth, Jiang Wu, Sergi Lozano. Assessing impact and quality from local dynamics of cita-tion networks. Journal of Informetrics, Elsevier, 2012, 6 (1), pp.111-120. �10.1016/j.joi.2011.08.005�. �halshs-00778517�
Assessing impact and quality from local dynamics of
citation networks
Camille Rotha,b,1, Jiang Wuc,d, Sergi Lozanod a
CNRS, CAMS Centre d’Analyse et de Math´ematique Sociales, CNRS/EHESS, 75013 Paris, France
b
Institut des Syst`emes Complexes de Paris Ile-de-France (ISC-PIF) 75005 Paris, France
c
School of Information Management, Wuhan University, 430072, Wuhan, China d
Chair of Sociology, in particular Modeling and Simulation, ETH Zurich 8092 Zurich, Switzerland
Abstract
We show that essentially local dynamics of citation networks bring special information about the relevance/quality of a paper. Up to some rescaling, they exhibit universal behavior in citation dynamics: temporal patterns are remarkably consistent across disciplines, and uncover a prediction method for citations based on the structure of references only, at publication time. Above-average cited papers universally focus extensively on their own recent subfield – as such, citation counts essentially select what may plausibly be considered as the most disciplinary and normal science; whereas papers which have a peculiar dynamics, such as re-birthing scientific works – ‘rediscovered classics’ or ‘early birds’ – are comparatively poorly cited, despite their plau-sible relevance for the underlying communities. The “rebirth index” that we propose to quantify this phenomenon may be used as a complementary quality-defining criterion, in addition to final citation counts.
Keywords: citation networks, bibliometrics, qualitative assessment,
citation dynamics
1To whom correspondence should be addressed.
E-mail: [email protected], Tel.: +33 1 4954 2032, Fax.: +33 1 4954 2109.
1. Introduction
Upon publication, a paper inserts itself into the network of existing ref-erences by building on and from the state-of-the-art [7]. It contributes to creating connections between bits of existing literature of various ages, and is in turn deemed relevant by being progressively embedded in the developing network of ongoing citations [15]. This continuous and cumulative process is rarely rendered by aggregate citation observations at a given date.
Yet, citations have often been appraised as a global and mainly static feature, plausibly dismissing the intrinsically dynamic nature of citation net-works. In this respect, existing works on citation networks endeavour for instance at describing and reproducing through modeling their highly het-erogeneous nature [8, 19, 20, 23] and universal features [18], or measuring the centrality of publication positions in static networks [6]. But even when addressing the growth of citation networks over time, a global approach has been adopted [1, 17].
Rather than considering (static) patterns at the global network level, we exhibit universal behaviors in local citation dynamics in both temporal direc-tions, backward and forward. On the whole, we suggest that even very basic features of the immediate neighborhood reveal highly significant information on the relevance of a paper to its community, as long as it is being observed dynamically. There is another important motivation in looking at the local neighborhood only: irrespective of their age, papers should be observed on a similar period of time – the fully developed citation network indeed mixes papers from significantly different eras, where older papers are more likely to be more cited over a different period of time.
We incidentally aim at relating local citation dynamics to the interest a paper will eventually have triggered in its community. Our results therefore bear implications on the relationship between quality and citation metrics, currently widely used as a benchmark for scientific evaluation. While a highly cited paper is certainly of relevance to the scientific community, it is however quite common to debate how such an “impact” translates into attested qual-ity [10, 16] – typically because of, among other factors, distinct [24] or biased citation practices [10, 14], excessive focus on “hubs” [6] or potentially flawed statistics derived from aggregate citation metrics [9, 21]. In this respect, we pursue two goals: exhibit robust structural predictors of the relevance of a paper (even at publication time) and, consequently, question the type of science which is captured by global/static citation metrics.
By showing that the most cited papers are those citing extensively the field, having recent references, to the contrary of papers having little refer-ences from within the field, citing farther in the past, or being cited late in the future, particularly those being resurrected later, we quantitatively show how citation counts essentially select what may be considered as the most disciplinary and normal science.
We pay special attention to rebirthing articles, i.e. those ones showing two separate ‘lives’ or citation bursts. By using an innovative Rebirth index, we perform an impact analysis not dependent on threshold-based definitions (in contrast with similar studies on related citation profiles like Sleeping Beauties [12]). We find that rebirth is a notion distinct from impact, in the sense that low impacts corresponds both to high and no rebirth. We therefore suggest that this index could be used as a complementary quality-defining criterion, in addition to final citation counts.
In Section 2 we introduce the methodology developed, which includes the processing of bibliometric data and the proposal of several indices quan-tifying both simple and rebirthing citation dynamics. Section 3 examines the relationship between the local citation dynamics of papers, which are characterized by these indices, and their relative citations counts (i.e. nor-malized with respect to other works with the same disciplinary and temporal characteristics). Finally, Section 4 summarizes and discusses our work. 2. Material and Methods
We first describe the dataset, then various variables which will be used throughout the paper.
Dataset
The database we use is based on Thomson Reuters Scientific “ISI Web of Science”, spanning over 1960-2009 for four general a priori categories: computer science (denoted by “cs”), economics (“eco”), engineering (“eng”) and physics (“phys”). The choice of these fields was primarily guided by the wish to have datasets of mixed size (as evidenced from Tab. 1), with mixed recency as constituted disciplines (“cs” being younger than “phys”), as well as at least one field from social sciences (“eco”) and one from applied sciences (“eng”). To ease the presentation and comparison of results, a number of four fields seemed to be a reasonable compromise. Apart from that, specific field choices – i.e. “phys” or “eng” rather than “medicine” or “maths” – were
somewhat arbitrary; leaving to further research the task of exploring other fields and possibly finding outliers.
Introducing temporal metrics requires to observe papers some time before and after publication. We therefore need to restrict the dataset to papers having sufficient history and, in some cases, to papers having sufficient dy-namic information both in terms of citations or references. We suggest that 10 years of history ahead and before provides a sufficient temporal resolution; by doing so, we still consider about 30 years of data by focusing on papers published between 1970 and 1999.
Going further, we consider several suitable constraints: “ALL” represents
papers having at least 10 years of history before and after publication date,
among which “CMIN” represents the subset of papers having at least 10
ci-tations after 10 years, and “RMIN” the subset of papers having at least 10
references at most 10 years old. The rationale for definingCMIN andRMIN lies
in the fact that average citation or reference ages cannot be defined when papers have little or no citations; most importantly, dynamics of link arrival are likely to be sketchy and strongly discretized on few points. Again, we arbitrarily assume that 10 points provide a sufficient resolution on the dy-namics, while it does not jeopardize statistical significance: these constraints result in diverse size reduction effects on each dataset as shown on Tab. 1 (see
Fig. A.1 too). More precisely, ALL only aims at ensuring sufficient temporal
coverage before and after publication and includes 100% of papers published
over 1970-1999. From this baseline, CMIN will be used for citation
dynamics-related variables and does not deal with the majority of papers which have
few or no citations (keeping from 6% (“eng”) to 26% (“phys”) ofALLpapers).
Similarly,RMINwill be used for reference dynamics and conserves between 2%
(“cs”) and 23% (“phys”) of ALLpapers, i.e. the minority of papers having a
significant span of references from the field.
Nonetheless, we checked that our results do hold qualitatively using
thresh-olds of 5 and 20 for CMIN and RMIN.2 In the remainder, we then use a
thresh-old of 10 as a decent trade-off between temporal resolution (the higher the threshold, the better) and statistical significance and representativity.
2For a threshold of 5, CMIN keeps from two to three times more papers than for a threshold of 10, whileRMINconserves from four to five times more papers.
Name Description Paper count
cs eco eng phys
RAW Papers from the raw dataset 634 592 268 785 2 056 282 2 543 769
ALL At least 10 years of forward and backward history
258 303 142 935 1 049 626 1 365 774
CMIN At least 10 citations after 10 years,
amongALL
21 167 15 595 66 465 349 792
RMIN At least 10 references at most 10 years old, amongALL
5 381 8 610 17 720 317 106
Table 1: Constraints applied to the data.
1990 t 1992 1995 1998 1998 2000 1989 1987 1996 1987 1984 1985 2000 1989 1986
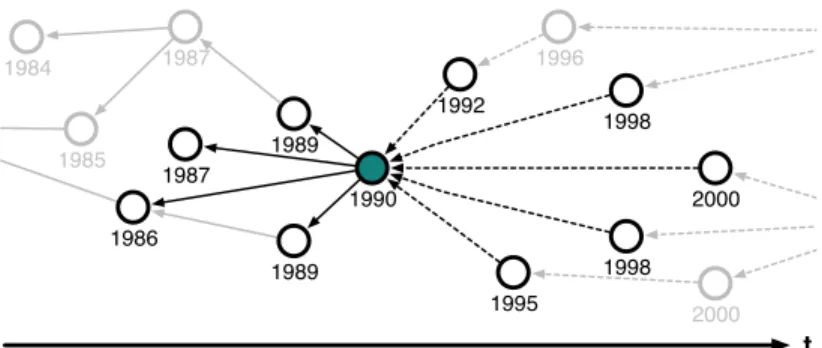
Figure 1: Dynamic, first neighborhood of a sample paper published in 1990. At left, references (solid links); at right, citations (dashed links).
History of citation and reference
We use the data presented above to examine the relationship between the
temporal ordering of links arriving to and from a given paper, and its relative
citation count with respect to its context. By relative citation count we mean
that we consider the number of citations received by a paper published in a given year with respect to the mean number of citations that all papers published in the same field have received after an identical period of time [2, 5, 18]. By temporal ordering of links, we mean that we work, in the broad sense, on arrival times of links connected to a given paper, distinguishing between links originating from a paper (references) and those pointing to a paper (citations), see Fig. 1.
Most basic features relate to the number of references and citations over the considered time window. Various elaborate dynamics-related metrics are
derivable from first neighborhood linking patterns — from the mean temporal gap from publication time (i.e. average age of references or citations) to metrics indicating in a more sophisticated manner how much a citation profile experiences a late surge of interest or not (called below the “rebirth index”). For each paper i, from the dynamic citation network we define a citation
vector ci (resp. reference vector ri) describing temporally the number of
in-coming links (resp. outgoing links), such that (ci)j is the number of incoming
links or citations at j years after publication (resp. (ri)j denotes the number
of outgoing links or references j years old before publication). Because of the above thresholds, j ranges from 0 to 10 for a given ci, and from −10 to 0 for ri. In the toy example presented in Fig. 1, for, say, paper “0” from “eng”, we thus have: c0 = (0, 0, 1, 0, 0, 1, 0, 0, 2, 0, 1) and r0 = (0, 2, 0, 1, 1, 0, 0, 0, 0, 0, 0).
The raw citation count Ci and reference count Ri of paper i are simply
the sum of its raw citation history and, respectively, reference history:
Ci = 10 X j=0 (ci)j Ri = 0 X j=−10 (ri)j (1)
The relative citation count of i is thus the ratio between Ci and the mean
of C′
i for all papers i′ published on the same year as i. Here, C0 = 5 and
R0 = 4.
Dynamics-related variables
To compute citation dynamics-related variables, we normalize each his-tory vector ciand ritwice: values are first adjusted such that (ˆci)j denotes the
ratio between (ci)j and the total number of papers published on year j, and
eventually ˆci is normalized such that its coefficients sum to 1 — we denote
twice-normalized vectors with a tilde: ˜ci. Adjusted proportions presented on
Fig. 4 are averages of ˜ci for all papers i in a given field. This kind of normali-sation makes it possible to compare patterns across different ‘historical peri-ods’. In our example, ˆc0 = (0, 0,44 5601 ,0, 0,60 6731 ,0, 0,72 6802 ,0,74 6931 ) as there are respectively 44 560, 60 673, 72 680 and 74 693 papers published in “eng” in 1992, 1995, 1998 and 2000. Then, ˜c0 ≃ (0, 0, 0.28, 0, 0, 0.21, 0, 0, 0.34, 0, 0.17).
A similar computation goes for ˜r0.
Citation and reference age. We define a variable related to the citation delay
citation history. We denote it by hcii. We similarly define the reference age hrii on the normalized reference history distribution. Formally, we have:
hcii = 10 X j=0 j· (˜ci)j hrii = 0 X j=−10 j· (˜ri)j (2)
While these variables are computed on citation and reference counts normal-ized by the number of papers published on each corresponding year, note that the results are qualitatively stable if we consider non-normalized mean citation and reference age, i.e. actual mean delay of citation, irrespective of the volume of papers published on each respective year. In the case of paper “0”, hc0i = 6.03.
Rebirth index. Metrics introduced above are the most basic ones, but we
can also study the concept of quality of a publication by focusing on more sophisticated dynamic patterns. A significant example of this are the so-called ‘Sleeping Beauties’ or ‘Early Birds’ papers. In the literature [3, 4, 22], such publications are characterized by making a significant contribution that triggers no or very little interest upon publication, but is recognized by the community only long time afterwards. These works are based on a binary operationalization of the idea of delayed recognized articles, i.e. papers belong or not to this category.
Building upon this literature, in order to further facilitate the systematical characterization of papers having a second life after a period of sleep, here we propose a second-order dynamic pattern named “Rebirth index ” and denoted as ρ. This index aims at describing how likely it is for a publication to have two periods of citations, that is, two distinct modes in their citation history distribution. In comparison to previous approaches, it allows for a continuous analysis, i.e. different degrees of delayed recognition. It also focuses on papers which, upon publication, exhibit at least a first surge of interest rather than no impact at all. Notice that this feature allows to avoid relying on an a priori “rebirthing” threshold. Our Rebirth index is defined as follows for a
given paper i of normalized citation history ˜ci:
ρi = X t,t′∈{0,..,10}2 ˜ ci2(t) ˜ci2(t′) |t − t′| 10 X t,t′∈{0,..,10}2 ˜ ci2(t) ˜ci2(t′) (3)
0 1 2 3 4 5 6 7 8 9 10t 0 % 20 % 40 % 60 % 80 % 100 %cit. Ρ =0.008 0 1 2 3 4 5 6 7 8 9 10t 0 % 20 % 40 % 60 % 80 % 100 %cit. Ρ =0.271 0 1 2 3 4 5 6 7 8 9 10t 0 % 20 % 40 % 60 % 80 % 100 %cit. Ρ =0.445
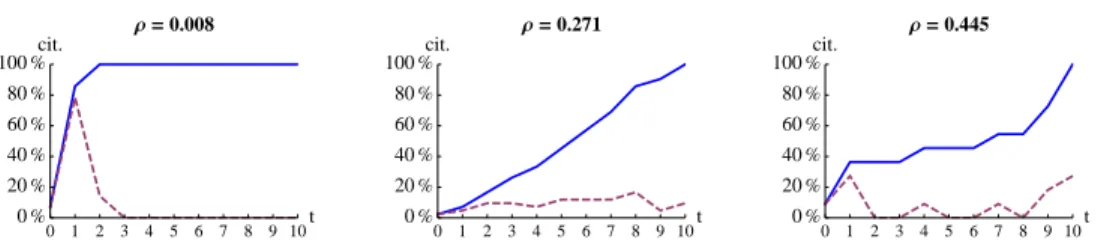
Figure 2: Behavior of citation profiles with respect to three typical rebirth index ρ values (from left to right: low to high). Samples were taken from the ‘phys’ dataset.
in such a way that ρigives more weight to plateaus (i.e. irregularities in ˜ci(t)). In other words, ρ is higher when a paper exhibits a first burst of citations, then a kind of stagnation period and, finally, a second burst.
Some examples representing typical possible scenarios can be found on
Fig. 2. Considering paper “0” again, ρ0 = 0.31. See also Appendix A
for more details regarding how ci, ˆci, ˜ci and ρi vectors and indices may be
computed. 3. Results
Universal scaling in the preference towards the recent past
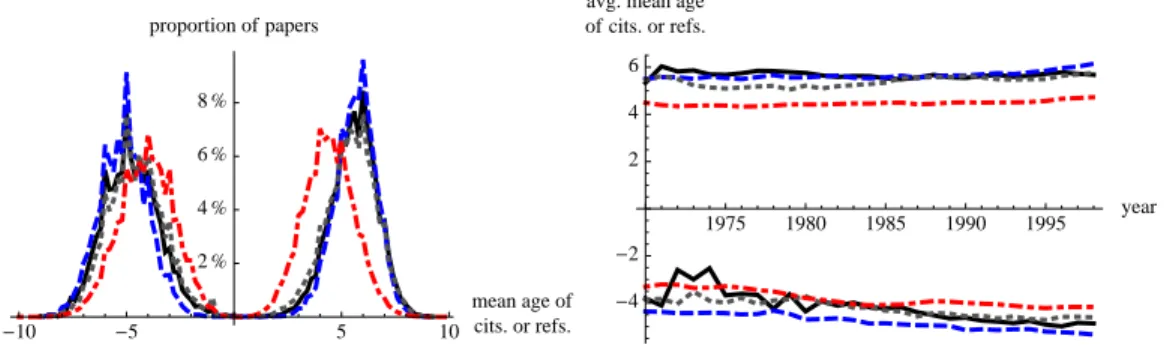
We first focus on the age of forward and backward links, i.e. citations and references. Their average ages are, remarkably, similarly distributed across all datasets, as shown on Fig. 3. Besides, both distributions are extremely modal, and their mean does not seem to evolve in time: in other words, papers published in either 1970 or 1999 are, on average, getting cited after almost exactly the same time.
For a given paper, the probability of being cited after y years or of
featur-ing references y′ years old is represented on Fig. 4. Notice that probabilities
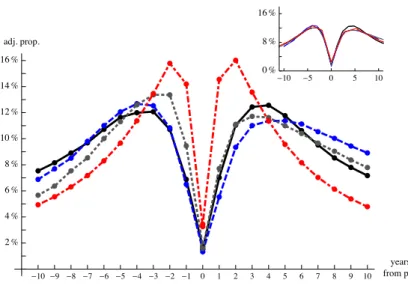
are normalized in order to effectively allow comparison across historical pe-riods: as said in the above section, we normalize quantities of references or citations on a given year by the number of papers published on that year in the given field. On a paper-by-paper basis, reference lists are more likely to include papers that are around three years old. The same goes for citations: papers are generally getting the highest rate of citation within around 3-5 years of their original publication. These findings are, actually, neither sur-prising nor new. De Solla Price already discussed the concept of Immediacy
-10 -5 5 10 mean age of cits. or refs. 2 % 4 % 6 % 8 % proportion of papers 1975 1980 1985 1990 1995 year -4 -2 2 4 6 avg. mean age of cits. or refs.
Figure 3: Left: Distributions of papers having given mean ages of citations or references, respectively forCMIN andRMINpapers (bins of width 0.2). Right: temporal evolution of the average mean ages of citations or references (put simply, it is the temporal evolution of the mean of distributions featured on the left). Legend: cs, black solid; eco, blue dashed; eng, gray dotted; phys, red dot-dashed.
in line with those of Gl¨anzel and collaborators in [12, 13]. However, as far as we know, no previous work has generalized such an observation by comparing temporal citation profiles across scientific fields, as we are doing here. The cross-field similarity shown in Fig. 4 can indeed be stressed by re-scaling the time variable of plots. As shown in the inset of the figure, once re-scaled the different citation patterns almost overlap. This result suggests the general-ity of the underlying citation dynamics, just differentiated from one field to the other by temporal factors like the duration of publishing processes (eco-nomics and, to a lesser extent, computer science being comparatively slower than engineering which itself has a slower pace than physics).
References and future impact, recent and normal science
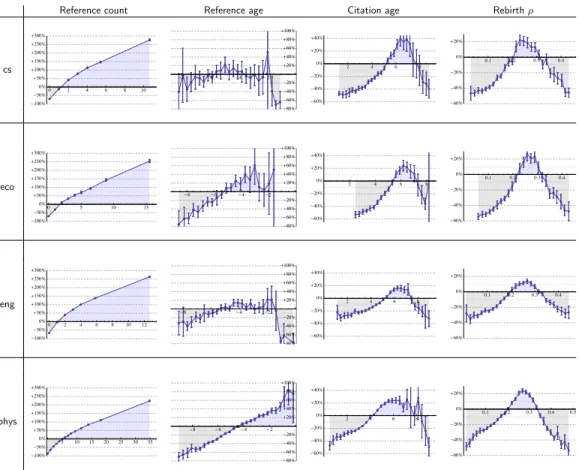
In order to get a deeper understanding of the relationship between tem-poral linking aspects and paper impact, we examined how linking patterns are correlated with relative citation counts. Results are summarized on the panel on Figure 5 (three first columns) and suggest essentially that:
1. Papers with a larger number of references from the field are very sig-nificantly more likely to get cited within the field — up to 4 times more than the average for papers having about 10 references, and 4 times less for papers having none.
2. Papers with a low (but not too low) average reference age are more likely to be more cited; in particular, papers with a high mean reference age (papers mostly citing “old publications”) are significantly less cited.
�10 �9 �8 �7 �6 �5 �4 �3 �2 �1 0 1 2 3 4 5 6 7 8 9 10 years from pub. 2 � 4 � 6 � 8 � 10 � 12 � 14 � 16 � adj. prop. �10 �5 0 5 10 0 � 8 � 16 �
Figure 4: Adjusted proportions of reference links pointing back to y < 0 years before publication, or respectively, citation links being y > 0 years old. Adjusted proportions are averages of ˜ci for all papers i in a given field. (Observations made on papers from
RMINand respectivelyCMIN). Inset: The same adjusted proportions after time re-scaling. More concretely, teco = tcs = 1.37 · teng= 1.95 · tphys for references and teco= 1.2 · tcs= 1.37 · teng= 2.6 · tphysfor citations. Profile overlapping is highly significant. Colors are set as defined in Fig. 3.
Reference count Reference age Citation age Rebirth ρ cs 0 2 4 6 8 10 �100� �50� 0� �50� �100� �150� �200� �250� �300� �8 �6 �4 �2 �80� �60� �40� �20� �20� �40� �60� �80� �100� 2 4 6 8 �60� �40� �20� 0� �20� �40� 0.1 0.2 0.3 0.4 �60� �40� �20� 0� �20� eco 0 5 10 15 �100� �50� 0� �50� �100� �150� �200� �250� �300� �8 �6 �4 �2 �80� �60� �40� �20� �20� �40� �60� �80� �100� 2 4 6 8 �60� �40� �20� 0� �20� �40� 0.1 0.2 0.3 0.4 �60� �40� �20� 0� �20� eng 0 2 4 6 8 10 12 �100� �50� 0� �50� �100� �150� �200� �250� �300� �8 �6 �4 �2 �80� �60� �40� �20� �20� �40� �60� �80� �100� 2 4 6 8 �60� �40� �20� 0� �20� �40� 0.1 0.2 0.3 0.4 �60� �40� �20� 0� �20� phys 5 10 15 20 25 30 35 �100� �50� 0� �50� �100� �150� �200� �250� �300� �8 �6 �4 �2 �80� �60� �40� �20� �20� �40� �60� �80� �100� 2 4 6 8 �60� �40� �20� 0� �20� �40� 0.1 0.2 0.3 0.4 0.5 �60� �40� �20� 0� �20� 0123456789 10t 0 � 20 � 40 � 60 � 80 � 100 � cit. 0.001 0123456789 10t 0 � 20 � 40 � 60 � 80 � 100 � cit. 0.268 0123456789 10t 0 � 20 � 40 � 60 � 80 � 100 � cit. 0.445
Figure 5: Relationship between relative citation counts (expressed in percentages above or below the average of the given field) and various citation dynamics variables. Dots indicate bin means, error bars correspond to confidence intervals (p = .95).
This regularity is particularly striking in physics, and much less obvious in computer science; it is also the only feature which is not similar across all fields.
3. Papers with a medium citation age are those which are generally more cited. This last feature possibly indicates that papers with highest relative impact are having a longer career, yet not too long: lately cited papers might get cited too late to raise sufficient mainstream interest. Interestingly, features 1 and 2 may globally both act as predictors, at publi-cation time, of the likely future impact of a paper in its field. In any event, on the whole, these results emphasize that the most discipline-focused papers and those citing essentially the most recent science are getting the highest interest from the community. Notice that these are traditional markers of
“normal science”, but could also correspond to review articles.3 By contrast,
interdisciplinary papers and/or papers referring back to older times are rais-ing a markedly weaker interest.
Rebirth as a complementary quality criterion
As observed above, papers being cited late (higher average citation age) are receiving less citations from the community. Such kind of papers are likely to belong to an especially interesting type (e.g. ‘sleeping beauties’), yet their empirical occurrence has also been shown to be rare [11, 12]. More precisely, from these previous studies, which also address the validity of citation-based indicators and the role of time windows when analyzing rebirthing papers [in particular 12], “non-impact” on the early years after publication appears to be a good predictor of future “non-impact” — in other words, from papers which exhibit “non-impact” initially, few eventually surge. A similar effect is observable in our study: in “phys”, for instance, papers with an average citation age over 7.5 years (corresponding to less-than-average citations, from
Fig. 5) represent only 0.37% of CMIN, or about a thousand papers (to be
compared with the 1.37 million papers present in ALL).
However, these works were based on an a priori threshold where a “sleep-ing beauty” is defined to be such that after s steps we have c citations. By 3Unfortunately, a comprehensive examination of the dataset in order to identify sepa-rately these two classes of publication was out of the range of this work.
0.05 0.1 0.15 0.2 0.25 0.3 0.35 0.4 0.45 Ρ 5 % 10 % 15 % 20 % 25 % 30 % proportion of papers 0.1 0.2 0.3 0.4 0.5Ρ 0 2000 4000 6000 8000 10 000 12 000 cs 0.1 0.2 0.3 0.4 0.5Ρ 0 2000 4000 6000 8000 10 000 eco 0.1 0.2 0.3 0.4 0.5Ρ 0 5000 10 000 15 000 20 000 25 000 30 000 35 000 eng 0.1 0.2 0.3 0.4 0.5Ρ 0 50 000 100 000 150 000 phys
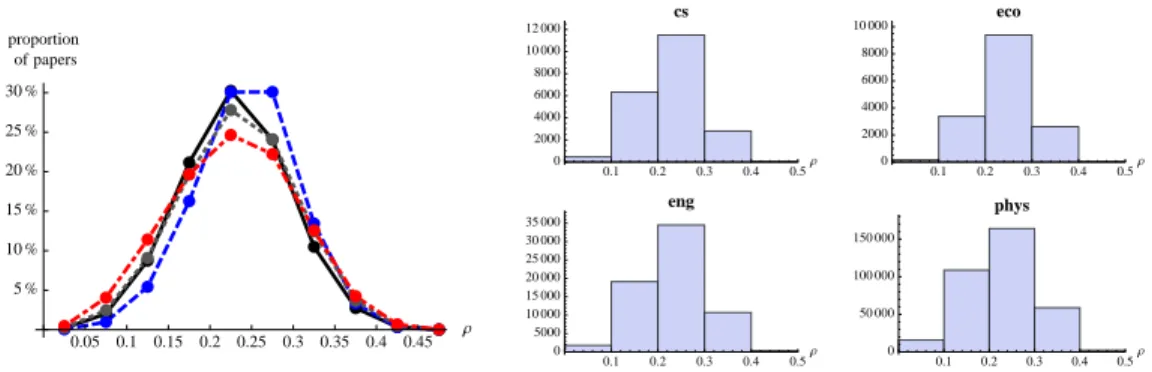
Figure 6: Left: distribution of papers according to ρ for all datasets (markers located at the middle of each bin of width 0.05). Right: absolute number of papers having a given rebirth index (histogram bins of width 0.1).
contrast, our re-birth index ρ aims at discriminating papers with two
peri-ods of citations, among those which have a minimal citation count (CMIN).
Its continuous nature additionally allows for a more complete study of these cases. First we have computed the distribution of ρ values across the four dis-cipline datasets, as shown in Fig. 6. In all four cases ρ appears to be modally distributed around ≈ 0.25, with a small majority of cases falling within the [0.2, 0.3] range, while a still significant proportion of papers exhibits lower values ([0, 0.2[, around 30% of papers on average) and higher values (ρ > 0.3, around 15% on average).
Then, we have calculated the relative impact of articles as a function of their rebirth index value, which can be found in Fig. 5. These results can be interpreted in terms of low, mid and high rebirthing characteristics without pre-defining such categories and specific range values:
• Low values of ρ: These are short-lived papers whose impact is generally limited to its publication time. It is not surprising that they got fewer citations than average.
• Mid values of ρ: These are papers that have been receiving citations, more or less continuously, during 10 years. This means that either they made an interesting contribution to the community, or the authors have been continuously supporting them through self-citation. At least in the former case, it is normal (and deserved) that they have a high relative citation count.
then a boost again, 7-10 years after publication. These papers are not getting much success in terms of eventual total citation impact. This could sound counterintuitive: papers which are rediscovered later and, therefore, experiencing a “second life”, are plausibly helpful for a future field.
Put shortly, we rather show that papers with two periods of life after a first surge of interest, which are plausibly interesting in some respect as they exhibit delayed (re-)recognition, have lower-than-average citation counts
compared with otherCMINpapers. In other words, from papers which exhibit
some impact, the ones that have two citation periods (possibly pioneers dur-ing their first period, at least with respect to the second period) are not well retributed by citation counts.
Revisiting these results in light of the debate about the appropriateness of the citation count as a impact (and frequently, by extension, quality) measure for publications, we find them contradictory. On one side the first two cases are in agreement with the role of citation count as a quality discriminator. On the other, the important role of ‘rediscovered’ or ‘early birds’ papers is not recompensed by a high citation rate. This latter point is crucial, because in these cases citation count would fail as a quality measure; the rebirth index, subsequently, would be an appropriate complementary and novel quality measure. Put differently, we show here that rebirth and impact are two distinct concepts, in that low impacts corresponds both to high and no rebirth. In this respect, the rebirth index could be used as a quality-defining criterion complementing final citation counts and able to distinguish for instance, among papers with lower-than-average final citation counts, those which are eventually rebirthing from the others.
4. Concluding remarks
It is remarkable that the above dynamic temporal signatures for quite diverse fields – from physics to economics – are significantly similar for all datasets. In most cases, they exhibit a similar behavior; often, identical trends with comparable orders of magnitudes in the y-axis and suggest a universal behavior that even seems to be weakly dependent on a given time period. We suggest that this similarity, which resembles and complements the static universality of citation distributions across disciplines identified by Radicchi and co-authors in [18], may be helpful in generalizing the present results and conclusions.
These correlations provide possibly useful predictive proxies regarding the citation future of a given paper, based only on its immediate temporal neighborhood. In other words, it is possible to statistically infer the relative interest a paper will trigger in a given community, based on its linkage profile towards its direct past neighborhood.
We also propose an index, ρ, quantifying rebirthing of a paper, i.e. the extent to which a paper has a second period of citation after several years of stagnation. Despite such kind of papers are usually quite relevant for their corresponding communities, we find that they are normally weakly cited. The same applies to papers with a higher mean citation age, possibly ‘sleeping beauties’ being cited late, which have a lower final citation count. In a broader view, second-order dynamic indices like ρ can make it possible to detect papers with interesting metrics but little number of citations — so as to eventually diverge from traditional considerations equating quality with citation counts. As such, we aim to contribute to challenging raw citation counts by emphasizing the type of impact, often equated with quality, that it specifically appraises.
Finally, these findings touch an essential feature of most reflexive social systems, especially those where quality and evaluation issues are crucially influencing agent behavior. Revealing these patterns, and thus assuming that the average age in the reference list of a given paper says something about its quality, it would be interesting to see how scientific communities might subsequently behave: will authors, in the future, tend to adapt their reference list in such a way that they all exhibit this optimal value; making, for one, the present finding immediately obsolete?
Acknowledgments.
We thank Dirk Helbing for his support, Marius Beceanu for fruitful dis-cussions, and Marc Barth´el´emy for his useful comments. We also warmly thank two anonymous referees for their constructive remarks and suggestions. This work was partially supported by the Future and Emerging Technologies programme FP7-COSI-ICT of the European Commission through project QLectives (grant no.: 231200). We acknowledge Thomson Reuters Scientific ISI as required by the terms of use of ISI WoS data.
Appendix A. Basic quantitative features of the dataset
The dynamics of publication, absolute citation and reference counts within each dataset is shown on Figs. A.1 and A.2. Note that when a paper is marked as having R references or C citations, the figure corresponds to within-field references and citations as described in the field-focused dataset. In other words, a cs paper with a reference count of 0 is still likely to have references, but none marked as belonging to the field of computer science, as tracked in the ISI dataset.
1960 1970 1980 1990 2000 2010year 10 100 1000 104 105 papers 1 10 100 1000 C 10-4 0.001 0.01 0.1 1 10 100 % 1 5 10 50 100 500 1000 R 10-4 0.001 0.01 0.1 1 10 100 %
Figure A.1: Left: yearly number of papers published. Middle and right: proportion of papers respectively having at least C citations and R references. Colors are set as defined in Fig. 3 of the main text.
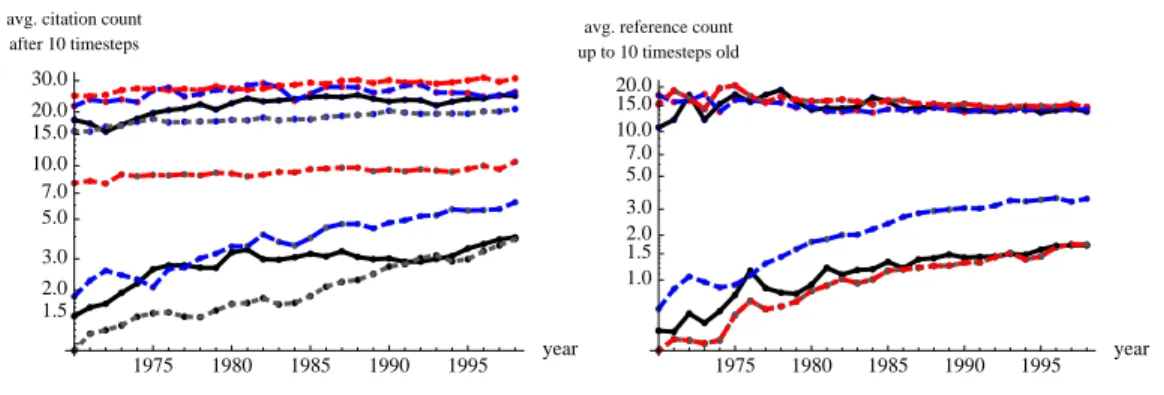
1975 1980 1985 1990 1995 year 10.0 5.0 2.0 20.0 3.0 30.0 1.5 15.0 7.0 avg. citation count
after 10 timesteps 1975 1980 1985 1990 1995 year 1.0 10.0 5.0 2.0 20.0 3.0 1.5 15.0 7.0 avg. reference count up to 10 timesteps old
Figure A.2: Left: average count of citations after 10 years hCyeari for ALL (below) and CMIN (above). Right: average count of references not older than 10 years for hRyeari for ALL (above) and RMIN (below). Colors are set as defined in Fig. 3 of the main text.
References
[1] Boerner, K., Maru, J. T., Goldstone, R. L., 2004. The simultaneous evolution of author and paper networks. PNAS 101 (Suppl 1), 5266– 5273.
[2] Bornmann, L., Daniel, H.-D., 2009. Universality of citation
distributions-a validation of radicchi et al.’s relative indicator. Journal of the American Society for Information Science and Technology 60. [3] Braun, T., Gl¨anzel, W., Schubert, A., 2010. On sleeping beauties,
princes and other tales of citation distributions... Research Evaluation 19 (3), 195–202.
[4] Burrell, Q. L., 2005. Are “sleeping beauties” to be expected? Sciento-metrics 65, 381–389.
[5] Castellano, C., Radicchi, F., 2009. On the fairness of using relative indicators for comparing citation performance in different disciplines. Archivum Immunologiae et Therapiae Experimentalis 57 (2), 85–90. [6] Chen, P., Xie, H., Maslov, S., Redner, S., 2007. Finding scientific gems
with Google’s PageRank algorithm. Journal of Informetrics 1, 8–15. [7] de Solla Price, D. J., 1965. Networks of scientific papers. Science
149 (3683), 510–515.
[8] de Solla Price, D. J., 1976. A general theory of bibliometric and other cumulative advantage processes. Journal of the American Society for Information Science 27 (5–6), 292–306.
[9] Egghe, L., 2010. The hirsch-index and related impact measures. Annual Review of Information Science and Technology 44, 65–114.
[10] Garfield, E., 1979. Is citation analysis a legitimate evaluation tool? Sci-entometrics 1 (4), 359–375.
[11] Gl¨anzel, W., Garfield, E., 2004. The myth of delayed recognition. The Scientist 18 (11), 8.
[12] Gl¨anzel, W., Schlemmer, B., Thijs, B., 2003. Better late than never? On the chance to become highly cited only beyond the standard bibliometric time horizon. Scientometrics 58, 571–586.
[13] Gl¨anzel, W., Schubert, A., 1995. Predictive aspects of a stochastic model for citation processes. Information Processing & Management 31, 69–80. [14] Greenberg, S., 2009. How citation distortions create unfounded
author-ity: analysis of a citation network. BMJ 339 (2680).
[15] Hu, X., Rousseau, R., Chen, J., 2011. On the definition of forward and backward citation generations. Journal of Informetrics 5 (1), 27–36. [16] MacRoberts, M. H., MacRoberts, B. R., 1996. Problems of citation
anal-ysis. Scientometrics 36 (3), 435–444.
[17] Menczer, F., 2004. Evolution of document networks. PNAS 101 (S1), 5261–5265.
[18] Radicchi, F., Fortunato, S., Castellano, C., 2008. Universality of citation distributions: Toward an objective measure of scientific impact. PNAS 105, 17268–17272.
[19] Redner, S., 1998. How popular is your paper? An empirical study of the citation distribution. European Physical Journal B 4, 131.
[20] Seglen, P. O., 1992. The skewness of science. Journal of the American Society for Information Science 43 (9), 628–638.
[21] The PLoS Medicine Editors, 06 2006. The impact factor game. PLoS Med 3 (6), e291.
[22] van Raan, A. F. J., 2004. Sleeping beauties in science. Scientometrics, 467–472.
[23] Wallace, M. L., Larivi`ere, V., Gingras, Y., 2009. Modeling a century of citation distributions. Journal of Informetrics 3 (4), 296–303.
[24] Zitt, M., Ramanana-Rahary, S., Bassecoulard, E., 2005. Relativity of citation performance and excellence measures: From field to cross-scale effects of field-normalisation. Scientometrics 63, 373–401.
Appendix A. Pseudo-code for the computation of ci, ˆci, ˜ci and ρi Algorithm 1:
input : A list of publication years (Yi)i∈{1,..,n} and a list of citation sets (Citi)i∈{1,..,n}, such that ∀i, Yi∈ N is the publication year of i and Citi⊂ {1, .., n} is the list of papers citing i.
output: A list of ci, ˆci, ˜ci and ρi indices. tmax← 10;
fory ∈ {set of possible years} do
Sy← 0; // define Sy as the number of publications on year y
fori ← 1 to n do SYi← SYi+ 1; fori ← 1 to n do κ ← 0; forj ← 0 to tmaxdo ci(j) = {k ∈ Citi|Yk = Yi+ j} ; ˆ
ci(j) = ci(j)/SYi+j; // ci(j) is the number of citations j years after publication, ˆci(j) is normalized by the number of
publication on that year κ ← κ + ˆci(j);
forj ← 0 to tmaxdo ˜
ci(j) = ˆci(j)/κ; // normalize ˆci coefficients to sum to 1 ρ⊤ ← 0; ρ⊥← 0; forj ← 0 to tmaxdo fork ← 0 to tmaxdo r ← ˜ci(j)2∗ ˜ci(k)2; ρ⊥← ρ⊥+ r; ρ⊤← ρ⊤+ r ∗ |k − j|/t max; ρi← ρ⊤/ρ⊥;