HAL Id: hal-00117311
https://hal.archives-ouvertes.fr/hal-00117311
Submitted on 1 Dec 2006HAL is a multi-disciplinary open access
archive for the deposit and dissemination of sci-entific research documents, whether they are pub-lished or not. The documents may come from teaching and research institutions in France or
L’archive ouverte pluridisciplinaire HAL, est destinée au dépôt et à la diffusion de documents scientifiques de niveau recherche, publiés ou non, émanant des établissements d’enseignement et de recherche français ou étrangers, des laboratoires
Lithium colloids and color center creation in
electron-irradiated Li2NH observed by electron-spin
resonance
Francois Beuneu, Peter Vajda, Y. Nakamori, S. Orimo
To cite this version:
Francois Beuneu, Peter Vajda, Y. Nakamori, S. Orimo. Lithium colloids and color center creation in electron-irradiated Li2NH observed by electron-spin resonance. Physical Review B: Condensed Matter and Materials Physics (1998-2015), American Physical Society, 2006, 74, pp.174122. �10.1103/Phys-RevB.74.174122�. �hal-00117311�
Lithium colloids and color center creation in electron-irradiated
Li
2NH observed by electron-spin resonance
F. Beuneu∗ and P. Vajda
Laboratoire des Solides Irradi´es, CEA-CNRS, ´
Ecole Polytechnique, F-91128 Palaiseau, France
Y. Nakamori and S. Orimo
Institute for Materials Research, Tohoku University, 2-1-1 Katahira, Sendai 980-8577, Japan
(Dated: October 13, 2006)
Abstract
We have irradiated Li2NH powder with MeV electrons at room temperature and investigated the
introduced defects with electron spin resonance. CESR indicates the presence of nanosize metallic Li colloids seen as a Lorentzian line with a g = 2.0023 and a line width ∆H = 50 µT. A second, broader, signal (∆H = 3 to 4 mT) appears superimposed upon the Li line at low T (Curie-type behavior) which exhibits complex T -dependence with a break near 180 K for its g-value and ∆H. We are suggesting for the latter a vacancy-type defect in the NH-sublattice, with freezing of its H-component below 180 K. When heated both the Li colloids and the color centers anneal around 100◦C probably due to hydrogen evolution and subsequent chemical degradation.
I. INTRODUCTION
In the search for a light-weight, cheap and easily practicable hydrogen-storage compound, the lithium amide/imide system had been recently rediscovered and has attracted notable interest1,2, in particular in view of the reversible reaction Li
2NH + H2 ⇀↽ LiNH2 + LiH
occurring in the interesting range 150−200◦C. Simultaneously, the crystal structure of Li 2NH
has been revisited by neutron powder diffraction3 and by synchrotron X-ray diffraction4 and
was established as a rather open cubic antifluorite structure, the NH-ions forming the f.c.c. cell with the Li-ions occupying its tetrahedral sites. The covalently bound hydrogen atoms were found hopping around their nitrogen atoms either on the 48h site within the Fm¯3m symmetry or on the 16e site within the F¯43m symmetry, both variants exhibiting a large H-vacancy concentration. Later performed NPD experiments on a deuterated sample (quoted in Ref. 5) had shown the equivalence of the above description either in terms of a disordered cubic or a fully occupied orthorhombic structure. Both the charge-density analysis of Ref. 4 and the electronic structure calculation of Ref. 5 have established the binding between the Li ions and the NH complexes as essentially ionic, such as [Li0.99+]
2[NH]1.21−.
In the present work, we are interested in the defect aspect of Li2NH, in particular
con-cerning its stability towards energetic radiation. In fact, it was noted earlier by some of us in a detailed radiation damage investigation of the oxide Li2O, also of antifluorite structure,
that electron irradiation at room temperature had led among others to the formation of metallic Li colloids, which were detected and characterized by conduction electron spin res-onance (CESR)6 and subsequently by NMR Knight shift measurements7. It was, therefore,
tempting - in this context also - to undertake an irradiation of this equally ionic Li-rich an-tifluorite type compound and try to observe a possible creation of metallic Li under electron bombardment. As we shall see, we had indeed succeeded in forming metallic Li together with some color-center type defects when bombarding with high-energy electrons.
II. EXPERIMENTAL
Li2NH powder was prepared from commercially obtained amide, LiNH2, by heating for
24 hours at 350◦C in vacuum. The resulting white powder of the order of 30 mg was sealed
irradiation. The subsequent XR analysis has shown 95% pure Li2NH, the rest mainly due
to Li2O.
The irradiation was perfomed at the Van de Graaff accelerator of the Laboratoire des solides irradi´es, using 2.5 MeV electrons with a current of 3-5 µA/cm2 in a helium gas
atmosphere at a temperature between 300 and 310 K; the received dose was 0.5 C/cm2. The
resulting damage distribution through the sample can be considered uniform since 2.5 MeV electrons only lose about 50 keV when traversing the tube. After irradiation, the sample was transferred in an argon glove box to another - more solid, 0.5 mm thick and defect free - glass tube, for EPR measurements. Part of the irradiated powder, of the order of 5 mg weight, was kept after the transfer in a further glass tube in air in order to test its stability and sensitivity to environment. Both the Ar-filled and the air-filled tubes were submitted to identical procedures such as the eventual annealing treatment in a furnace. (The two samples had shown very similar behavior through the whole study.)
The introduced defects were investigated by EPR with a Bruker EMX spectrometer, operating at 9.6 GHz, in the 4 − 300 K range. EPR spectra were taken under conditions where saturation does not occur, and were analyzed by performing least squares fits from which linewidths and intensities were calculated. Absolute intensities were obtained after comparison with a standard sample.
III. RESULTS
The initially white Li2NH powder had turned completely black after irradiation and
exhibited a relatively complex EPR spectrum already at room temperature. Since the glass tube had also changed color visibly, it was necessary to replace it as described above in order to separate the intrinsic sample spectrum. The latter is shown in Fig. 1 for four typical measuring temperatures, Tm, between 300 K and 10 K.
Fig. 1a represents a rather simple spectrum with a narrow central Lorentzian line su-perimposed upon a hardly noticeable, at this temperature, broad structure extending over about 10 mT. Fig. 1b, taken at Tm = 120 K, exhibits an unchanged central line and an
emerging rather asymmetric broad structure. When lowering the temperature still further to Tm = 50 K (Fig. 1c) the broad signal becomes predominant and, moreover, exhibits some
330 335 340 345 350 s ig n a l (a rb . u n .) magnetic field (mT) (a) (b) (c) (d) 290 K 290 K 120 K 50 K 10 K
FIG. 1: EPR spectra of irradiated Li2NH powder measured at different temperatures, Tm, with the
same microwave power P = 0.493 mW and modulation M = 20 µT; (a) Tm = 290 K, G = 2 × 10 4; (b) Tm = 120 K, G = 2 × 10 4; (c) T m = 50 K, G = 5 × 10 3; (d) T m = 10 K, G = 5 × 10 3.
(Fig. 1d), finally, the broad structure takes over completely, with the appearance of more additional shoulders at lower fields, but maintaining an unchanged central line.
A. Narrow line
Already now it seems clear that the central narrow line exhibits the typical Pauli-type temperature-independent behavior characteristic of conduction electron spins, in our case that of metallic Li electrons; the measured g-value of g = 2.0023 being close to that of free electrons is another strong argument in its favor.
In Fig. 2, we have collected all data concerning the narrow-line intensity for the Tm taken
and show them together with the line width, ∆H. The Pauli-like T -independence of the spin concentration is nicely confirmed; the line width, 1/γT2, is constant ∆H = 48 µT down
to Tm ≈100 K and increases slightly below, by ≈10% for the lowest Tm: this behavior,
6x10¹⁴ 7x10¹⁴ 8x10¹⁴ 9x10¹⁴ 10x1014 45 50 55 0 50 100 150 200 250 300 N u m b e r o f s p in s L in e w id th ( µ T ) Tm(K)
FIG. 2: Narrow line characteristics as a function of measuring temperature, Tm; full signs - intensity,
open signs - linewidth ∆H.
impurities could also be responsible for a linewidth value somewhat higher than observed in the best single crystals of Li2O. (By the way, in the past8, we had observed in irradiated
LiF crystals a large dispersion of conduction electron linewidth values.)
The measured number of spins corresponds to a concentration of 2.2 × 10⁻⁴ metallic Li
in our ≈28 mg Li2NH sample. [We wish to exclude here the possibility of the Li colloids
as been formed in the Li2O present here as ≈5% “impurity”. There (see e.g. Ref. 6), the
concentration of small colloids would be of the order of 2×10⁻⁵, giving more than two orders
of magnitude difference, in addition to a narrower line width, ∆H ≈ 10 µT.]
Concerning the size of the metallic Li precipitates observed, EPR gives an upper limit of about 1 µm, from the non-Dysonian shape of the line, and a lower one of a few nm, due to the absence of quantum effects.
B. Broad signal
We have tried the analysis of the broad signal in the spectrum of Fig. 1 as a single structure, but due to its varying aspect with temperature this was not very satisfactory. The broad line shows a complicated shape which is surely related to an anisotropic signal averaged in the powder samples. In order to extract linewidth and intensity values, we used a fit containing mathematically an absorption and a dispersion part, without any particu-lar physical meaning. We are showing in Fig. 3 the temperature dependence of the signal
0 2x10¹¹ 4x10¹¹ 6x10¹¹ 0 50 100 150 200 250 300 0 0.05 0.1 0.15 0.2 N u m b e r o f s p in s T m(K) 1/Tm(K -1) 180 K
FIG. 3: T -dependence of the broad signal intensity in a direct plot (open signs, lower scale) and in a reciprocal plot (full signs, upper scale).
intensity as determined with such a fit, both in a direct f (Tm) plot and in a reciprocal one,
f (1/Tm). The defect responsible for this rather Curie-like behavior is certainly a
paramag-netic center, but seems to exhibit some anomalies, in particular seen as a break near 180 K in the direct plot and a change of slope at the same temperature, 1/Tm ≈ 0.006 K−1, in the
reciprocal plot.
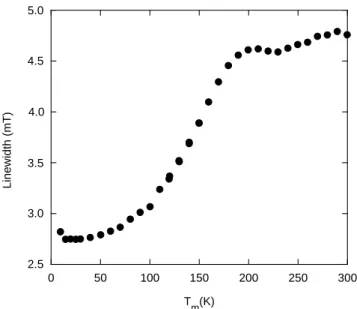
A further indication of a change in the behavior is expressed by the Tm-dependence of
the linewidth, which we are showing in Fig. 4. It is clear that we are dealing here with (at least) two types of defect: one with a ∆H ≈ 3 mT at low Tm and up to ≈ 100 K; another
with a ∆H ≈ 4.5 mT above Tm ≈ 180 K; the transition or transformation between the two
is rather smooth over a range of about 100 K. (Interestingly and pointing into the same direction, the mean g-value resulting from the broad-signal fit varies also with Tm, from
g = 2.003 at low T to g = 1.999 at room temperature.)
C. Annealing
We have tried to anneal the radiation defects by heating the samples in their sealed glass tubes from 50◦C on in steps of 25◦C for 30 minutes each and recording the spectra at 300 K
after each Tann. The sample bleaches progressively, losing signal intensity at the same time,
2.5 3.0 3.5 4.0 4.5 5.0 0 50 100 150 200 250 300 L in e w id th ( m T ) Tm(K)
FIG. 4: T -dependence of the linewidth of the broad signal showing (at least) two defect domains.
0 2x10¹³ 4x10¹³ 6x10¹³ 8x10¹³ 10x1013 12x1013 0 50 100 150 200 0 50 100 150 200 N u m b e r o f s p in s L in e w id th ( µ T ) Tann(C)
FIG. 5: Annealing behavior of the narrow line intensity (full signs) and its width (open signs), taken at 300 K after heating for 30 minutes at each Tann.
Fig. 5 shows the evolution of the narrow line, both with regard to its intensity and the linewidth. (The g-value remained constant through the whole annealing treatment.) The annealing stage is rather broad and centered around Tann = 90◦C; the linewidth which is
constant, ∆H ≈ 50 µT, until Tann ≈ 90◦C grows strongly above this temperature reaching
≈ 200 µT for the highest Tann = 175◦C, where only 2% of the signal are left. Fig. 6 follows
0 1x10¹⁶ 2x10¹⁶ 4.0 4.2 4.4 4.6 4.8 5.0 0 50 100 150 200 N u m b e r o f s p in s L in e w id th ( m T ) Tann(C)
FIG. 6: Annealing behavior of the broad line intensity (full signs) and its width (open signs), taken at 300 K after heating for 30 minutes at each Tann.
disappears progressively at the same time as the narrow line (together with the sample bleaching); its linewidth remains rather constant, ∆H ≈ 4.1 mT until Tann ≈ 90◦C and
grows afterwards by 10 − 15% before its near disappearance at Tann = 175◦C, where 95% of
the signal are gone. It is interesting to note that both line intensities clearly decrease after the first annealing at Tann = 50◦C, which means that sample heating during the electron
irradiation did not exceed this temperature.
In view of the very similar annealing behavior of both signals, it seems probable that we have here the result of chemical specimen degradation, with loss of components, rather than recovery of a specific defect. Especially the beginning linewidth increase, after Tann ≈ 90◦C,
for both otherwise so different signals speaks for a degrading environment of the host matrix. This goes well conform with the fact that hydrogen evolution was reported above ≈ 150◦C
in this system1, another strong indication for its limiting stability.
IV. DISCUSSION
All the observed characteristics of the narrow signal, such as the Tm-independence of its
intensity (Pauli-behavior), the g = 2.0023 value close to that of the free electrons, and the rather narrow width of ∆H ≈ 50 µT, are a clear indication of metallic Li colloids as respon-sible for its appearance. To explain this phenomenon and by analogy with the isostructural
Li2O [6,7], we are suggesting the simultaneous creation and migration of anionic
vacancy-type defects during irradiation which would leave behind neutral Li◦ species agglomerating
to nano-size metallic colloids. The complementary NH anion cluster could end up as NH3
bubble somewhere in the host or leave through the surface, though the latter does not seem to occur below 300◦C in an undamaged system2. On the other hand, we have noted sample
degradation in anneals around 100◦C, but also an isothermal decrease of the signal already
at room temperature when it had diminished by a factor of ten in fifty days; it is most probably hydrogen leaving the sample during and/or after irradiation.
For the broad structure, we are suggesting some kind of complex anionic color center transforming from a simpler symmetric one at room temperature to a more structured of less symmetry at low temperatures; the break in the signal intensity (Fig. 3) and in the linewidth (Fig. 4) at Tm ≈ 180 K together with a shift in the g-value are signs of this
reversible transformation. When assuming an anionic vacancy-type defect (such as F) in the NH-sublattice a possible candidate for the above described behavior would be the hydrogen component in the covalent molecular NH group. As, indeed, shown in the structural analysis of Ref. 3,4 and explained in the introduction, the H atom is hopping around its N atom within a cage of various possible symmetries. Now, it is easily imaginable that this H hopping would freeze below a certain temperature, which could be the 180 K of our experiment, just like the rotating fullerene molecules in their f.c.c. cage.9 A similar phenomenon was expected
though not observed in the NPD study by Ohoyama et al.3 and has been predicted (and is
still expected) in a very recent density-functional analysis by Magyari-K¨ope et al.10, namely
the appearance of low-symmetry low-energy structures at low temperatures. On the other hand, the low stability of the H component in our imide has been amply demonstrated both in the isothermal and isochronal annealing described above.
V. CONCLUSIONS
High-energy electron bombardment of Li imide powder, Li2NH, leads to the formation
of metallic Li colloids as observed by CESR and to color centers. The latter exhibit a Curie-type behavior, but with a break in the temperature dependence near 180 K both for the linewidth and the g-value indicating a complex origin. We are suggesting an anionic type defect in the NH-sublattice, with freezing of the H component below ≈ 180 K, for its
interpretation.
Both the colloids and the color centers anneal simultaneously around 100◦C probably
because of chemical sample degradation due to hydrogen evolution.
∗ Electronic address: francois.beuneu@polytechnique.edu
1 P. Chen, Z. Xiong, J. Luo, J. Lin, K.L. Tan, Nature 420, 302 (2002) and J. Phys. Chem. B
107, 10967 (2003).
2 R. Janot, Ann. Chim. Sci. Mat. 30, 505 (2005).
3 K. Ohoyama, Y. Nakamori, S. Orimo, K. Yamada, J. Phys. Soc. Japan 74, 483 (2005).
4 T. Noritake, H. Nozaki, M. Aoki, S. Towata, G. Kitahara, Y. Nakamori, S. Orimo, J. All.
Compds. 393, 264 (2005).
5 J.F. Herbst, L.G. Hector, Phys. Rev. B 72, 125120 (2005). 6 P. Vajda, F. Beuneu, Phys. Rev. B 53, 5335 (1996). 7 F. Beuneu, P. Vajda, Phys. Rev. Lett. 76, 4544 (1996).
8 F. Beuneu, P. Vajda, O.J. ˙ZogaÃl, Nucl. Instr. Meth. in Phys. Res. B 191, 149 (2002).
9 P. A. Heiney, J. E. Fischer, A. R. McGhie, W. J. Romanow, A. M. Denenstein, J. P. McCauley
Jr., A. B. Smith, D. E. Cox, Phys. Rev. Lett. 66, 2911 (1991).