HAL Id: hal-02434889
https://hal.archives-ouvertes.fr/hal-02434889
Submitted on 15 Jan 2020
HAL is a multi-disciplinary open access
archive for the deposit and dissemination of sci-entific research documents, whether they are pub-lished or not. The documents may come from teaching and research institutions in France or abroad, or from public or private research centers.
L’archive ouverte pluridisciplinaire HAL, est destinée au dépôt et à la diffusion de documents scientifiques de niveau recherche, publiés ou non, émanant des établissements d’enseignement et de recherche français ou étrangers, des laboratoires publics ou privés.
Coral Li/Mg thermometry: Caveats and constraints
Kristan Cuny-Guirriec, Eric Douville, Stéphanie Reynaud, Denis Allemand,
Louise Bordier, Marine Canesi, Claudio Mazzoli, Marco Taviani, Simonepietro
Canese, Malcolm Mcculloch, et al.
To cite this version:
Kristan Cuny-Guirriec, Eric Douville, Stéphanie Reynaud, Denis Allemand, Louise Bordier, et al.. Coral Li/Mg thermometry: Caveats and constraints. Chemical Geology, Elsevier, 2019, 523, pp.162-178. �10.1016/j.chemgeo.2019.03.038�. �hal-02434889�
Coral Li/Mg thermometry: caveats and constraints
Kristan Cuny-Guirriec1*, Eric Douville1, Stéphanie Reynaud2, Denis Allemand2, Louise Bordier1,
Marine Canesi1, Claudio Mazzoli3, Marco Taviani4,5,6, Simonepietro Canese7, Malcolm McCulloch8,
Julie Trotter9, Serguei Damián Rico-Esenaro10, Joan-Albert Sanchez-Cabeza11, Ana Carolina
Ruiz-Fernández12, Juan P. Carricart-Ganivet13, Pete M. Scott8, Aleksey Sadekov8, Paolo Montagna4,14
1 Laboratoire des Sciences du Climat et de l’Environnement, LSCE/IPSL, CEA-CNRS-UVSQ, Université
Paris-Saclay, F-91191 Gif-sur-Yvette, France.*[email protected]
2 Centre Scientifique de Monaco, 8 quai Antoine Ier, 98000 Monaco, Monaco
3 Dipartimento di Geoscienze, Universita` degli Studi di Padova, Via G. Gradenigo 6, 35131 Padova,
Italy
4 Institute of Marine Sciences (ISMAR), CNR, Via Gobetti 101, Bologna, Italy
5 Biology Department, Woods Hole Oceanographic Institution, 266 Woods Hole Road, Woods Hole,
MA 02543, USA
6 Stazione Zoologica Anton Dohrn, Villa Comunale, 80121 Naples, Italy 7 ISPRA, Via Brancati 48, 00144 Rome, Italy
8 Oceans Graduate School, the UWA Oceans Institute, and the ARC Centre of Excellence for Coral
Reef Studies, The University of Western Australia, Crawley, Australia
9 School of Earth Sciences and the UWA Oceans Institute, The University of Western Australia,
Crawley, Australia
10 Posgrado en Ciencias del Mar y Limnología, Universidad Nacional Autónoma de México, Av. Ciudad
Universitaria 3000, C.P. 04510 Coyoacán, Ciudad de México, Mexico
11 Unidad Académica Procesos Oceánicos y Costeros, Instituto de Ciencias del Mar y Limnología,
Universidad Nacional Autónoma de México, Ciudad Universitaria, 04510 México, Mexico
12 Unidad Académica Mazatlán, Instituto de Ciencias del Mar y Limnología, Universidad Nacional
Autónoma de México, Av. Joel Montes Camarena S/N, 82040 Mazatlán, Mexico
13 Laboratorio de Esclerocronología de Corales Arrecifales, Unidad Académica de Sistemas Arrecifales
en Puerto Morelos, Instituto de Ciencias del Mar y Limnología, Universidad Nacional Autónoma de México, Prol. Av. Niños Héroes S/N, Puerto Morelos, Q. Roo 77580, Mexico
14 Lamont-Doherty Earth Observatory, Columbia University, 61 Route 9W, Palisades, NY 10964, USA
Abstract
The coral Li/Mg temperature proxy is revisited through an in-depth trace element analysis of scleractinians collected live from tropical to polar environments. The dataset consists of Li/Ca, Mg/Ca, Sr/Ca and Li/Mg ratios from 64 coral specimens belonging to 8 different taxa, including both reef-building zooxanthellate and coldwater non-zooxanthellate species, from a wide range of water temperature (−1 to 29.5 °C), salinity (34.71 to 38.61), and depth (3 to 670 m). Our results showed that the reliability of the Li/Mg temperature proxy is strongly limited by the organic matter associated with the coral skeleton, which is most evident within the green bands observed in tropical corals. Organic-rich bands can double the Mg content otherwise present in the skeleton, which may ultimately lead to a temperature overestimation exceeding 15 °C. We found that this bias can be overcome by the treatment of coral skeletons with a specific oxidizing cleaning protocol. We also detected the presence of calcite deposits within the aragonite skeleton of some Antarctic living coral specimens, which strongly affects the robustness of the Li/Mg proxy given its temperature sensitivity of ~1.5 °C/1% calcite. Therefore, to obtain reliable reconstructions a correction needs to be applied when organic matter and/or calcite contamination is present, which requires the scrupulous assessment of the integrity of the aragonite prior to geochemical analyses. Given that some species entrap more organic matter than others, and that some are more prone to calcite contamination, a taxon-related effect is apparent. Here we show that the tropical species Porites spp., Pseudodiploria strigosa and Orbicella annularis, and the cold-water species Madrepora oculata, Caryophyllia antarctica and Flabellum impensum, are all suitable candidates for reconstructing seawater temperatures. The integrated results across a wide temperature range, from extreme cold to tropical shallow waters, yield an overall precision for the Li/Mg-temperature proxy of ± 1.0 °C, as quantified by the standard error of estimates. If calculated from the 95% prediction intervals, the uncertainty of the temperature estimates is ± 0.9 °C at 1 °C, ± 1.5 °C at 12 °C and ± 2.6 °C at 25 °C. However, the uncertainty for the tropical corals (e.g. Porites) can be reduced to ± 0.6 °C if a Li/Mg and Sr/Ca multi-regression approach is applied.
1. Introduction
Earth's ecosystems are increasingly threatened by multiple stressors related to human
activities (Ripple et al., 2017). The Intergovernmental Panel on Climate Change has recently warned about the specific threat of CO2 release and consequent increasing temperatures (Allen et al., in press). This acceleration in global warming has highlighted the need for improved climate projections by examining historical instrument data and reconstructing paleoclimate records from natural archives. Paleoclimate reconstructions can help to overcome the absence of long and continuous instrumental climate records that are needed to evaluate the likely impacts and consequences of climate change and global warming on the environment and ecosystem. It is therefore crucial to develop effective climate proxies to obtain better paleoclimate reconstructions. A number of proxies have been developed to evaluate temperatures in the upper ocean system, which include faunal assemblages (e.g. Mix et al., 1999), alkenones in sediments (e.g. Muller et al., 1998), Mg/Ca (e.g. Dekens et al., 2002) and δ18O (e.g. Bemis et al., 1998) in planktonic foraminifera, Sr/Ca and Mg/Ca in tropical corals (e.g.
Correge, 2006; Mitsuguchi et al., 1996), and more recently clumped isotopes (Ghosh et al., 2006). However, relatively few proxies have been developed for deep/cold water environments (Montagna et al., 2014). In general, the effectiveness of geochemical proxies can be compromised by complications induced mainly by the physiology of the organism, and diagenetic processes. The Li/Mg ratio in aragonite foraminifera and corals was established as a proxy to reconstruct seawater temperatures (Bryan and Marchitto, 2008; Case et al., 2010; Raddatz et al., 2013; Montagna et al., 2014). Its use gained support as it was considered to be only moderately affected by coral physiology or by fine-scale skeletal variations (e.g. centres of calcification vs. fibrous aragonite), and hence largely independent of species controls, so it could be applied across a wide range of environments and species. A general exponential calibration curve showed a direct relationship between coral Li/Mg ratios and ambient seawater temperature, for both cold-water and tropical corals across a temperature range of 0.75–28 °C, with an uncertainty in the Li/Mg-derived temperature of ± 0.9 °C (Hathorne et al., 2013; Montagna et al., 2014). However, some uncertainties remain, such as the mechanisms of Li and Mg incorporation in the skeleton during the bio-mineralization process, the microstructure-related Li/Mg variations, and the mechanisms explaining the ultimate link with temperature (Montagna et al., 2014; Rollion-Bard and Blamart, 2015; Marchitto et al., 2018). More recently, advantages of a multi-proxy approach combining Li/Mg and Sr/Ca have provided more accurate temperature reconstructions by reducing apparent species effects (Fowell et al., 2016; D'Olivo et al., 2018; Zinke et al., 2019). The present study aims to resolve some of the uncertainties that can affect the reliability of Li/Mg as a temperature proxy in corals. In particular, we discuss the effects of organic matter in the coral skeleton, which is known to alter the coral geochemistry and
hence bias climate reconstructions (Boiseau and Juillet-Leclerc, 1997; Mitsuguchi et al., 2001; Watanabe et al., 2001; Barker et al., 2003; Holcomb et al., 2015). Organic matter found in corals may have various origins, including the polyp-derived skeletal organic matrix that is believed to act as a template for initial crystal nucleation (e.g. Cuif et al., 2008; Mass et al., 2013; Takeuchi et al., 2016), the organic membranes of the living polyps, the deposition of bacteria or algal symbionts rich in chlorophyll, and seawater-sourced organic matter entrapped in the coral skeleton (DeCarlo et al., 2018). Although the effect of organic matter on geochemical proxies, such as Mg/Ca, Sr/Ca, δ18O and
δ11B, is relatively well-documented (Mitsuguchi et al., 2001; Watanabe et al., 2001), little is known
about its effect on the Li/Ca and Li/Mg ratios (Holcomb et al., 2015). Finally, we discuss the purity of the skeletal aragonite mineralogy, including calcite contamination as a factor influencing the fidelity of the Li/Mg proxy. The calibration curve of Montagna et al. (2014) is expanded here to include extreme temperatures using new Li/Mg data, from both laser and solution-based ICP-MS analyses of corals from sub-zero temperature waters in Antarctica. We also further evaluate the general link existing between coral Li/Mg and Sr/Ca ratios and the ambient seawater temperature, and the validity of using Li/Mg and Sr/Ca multiregressions to reduce uncertainties on reconstructed temperatures (Fowell et al., 2016; D'Olivo et al., 2018).
2. Samples and Methods
2.1. Coral samples
We investigated 64 scleractinian corals, both zooxanthellate (n=47) and non-zooxanthellate (n=17), collected live from the Mediterranean Sea, Caribbean Sea, Pacific Ocean, and Ross Sea, from waters spanning a wide range in temperature (−1 to 29.5 °C), salinity (34.71 to 38.61), and depth (3 to 670 m) (Table 1, Fig. 1). We examined 11 different species of 8 different genera: Porites spp., Orbicella faveolata, Orbicella annularis, Pseudodiploria strigosa, Madrepora oculata, Javania antarctica, Flabellum impensum, Flabellum gardineri, Caryophyllia antarctica, and Paraconotrochus antarcticus (Table 1). Seawater temperature data at the sampling locations were obtained from the Advanced Very High Resolution Radiometer Optimum Interpolation Sea Surface Temperature version 2 (AVHRR-OISSTv2, 0.25° grid; Banzon et al., 2016; Reynolds et al., 2007) for shallow-water corals, and from NOAA WOA13v2 (0.25° grid) for specimens living below 10m depth (Boyer et al., 2013). When available, we used in situ temperature data that had been acquired using CTD (conductivity, temperature, depth) profiles near the coral sampling site (Table 1). Salinity data for all the sampling locations were obtained from the NOAA WOA13v2 dataset. Seawater temperature data from the AVHRR-OISSTv2 database
cover the same period corresponding to the coral portion sub-sampled for geochemistry (i.e. the last 4–6 years, see below).
Figure 1. Sampling locations of coral colonies. Red stars: zooxanthellate corals; yellow stars: non-zooxanthellate corals.
2.1.1. Reef-building zooxanthellate corals
Cores were collected from 10 living Porites sp. coral colonies along the intertropical zone of the Pacific Ocean using an underwater hydraulic drill, during the TARA Pacific expedition (2016–2018). These colonies were sampled at various depths, from 3m at Moorea Island down to 20m at Wallis Islands, and mean seawater temperatures, from 22.4 °C near Easter Island to 29.0 °C near Wallis Island. In November 2015, 25 short cores were extracted from Porites lobata colonies living in the lagoonal Uitoe and Dumbea Fausse passe reefs, New Caledonia, between 3 and 51 m, within a temperature range of 22.4–26.6 °C. These P. lobata colonies were exposed to different levels of sunlight irradiance, with 3 colonies (06, 08 and 28) having portions growing under conditions of variable intensity, from shady to direct sunlight, and two colonies (11.5 and 15.5) growing entirely under shady conditions. Short cores (~10 cm long) were collected in 2017 with a Nemo underwater drill system from 12 living Orbicella spp. (n=9) and P. strigosa (n=3) coral colonies growing at 5m water depth, within a few meters long transect, in Puerto Morelos Reef, northeast coast of the Yucatan Peninsula, Mexico (Fig. 1). The average SST at the sampling site was 27.9 °C, and temperatures ranged between 26.4 °C in winter and 29.3 °C in summer (Table 1). The Porites spp., Orbicella spp., and P. strigosa cores were imaged using a DISCOVERY CT750 HD computerized tomography scanner with 0.62mm resolution, to identify high and low density growth bands. Scans were conducted at Platform DOSEO, CEA-Paris-Saclay. The cores
were then cut along the major growth axis with a rock saw and the skeletal portion corresponding to the last 4–6 years (2010–2016), based on density banding, was sub-sampled for trace element analysis using a fine diamond saw. In addition, skeletal aragonite was collected along the thecal wall of four O. faveolata and two P. strigosa cores using a small diamond bur, carefully avoiding extrathecal material (Table 1).
2.1.2. Cold-water non-zooxanthellate corals
A small living colony of the framework-forming cold-water coral, Madrepora oculata, was collected from the Sardinia Channel (Mediterranean Sea) at 432m water depth using a Remotely Operated Vehicle on the R/V Urania during the RECORD 2014 cruise (Taviani et al., 2017). The seawater temperature was obtained from a CTD profile acquired close to the sampling location and was compared to the value sourced from the WOA13v2 dataset to obtain the long-term temperature variability (13.8 ± 0.1 °C). The topmost portion of one of the branches, corresponding to ~1 year of skeletal growth (Orejas et al., 2011), was carefully cleaned using a fine diamond saw to remove any organic material residues, and sub-sampled in 6 different aliquots of ~50 mg each. The other living non-zooxanthellate corals investigated in this study were collected from the Ross Sea (Antarctica) at 389 and 670m water depth during the XVII (2002) and XXXII (2017) Antarctic campaigns aboard the R/V Italica and include 5 different species: Javania antarctica, Caryophyllia antarctica, Flabellum impensum, Flabellum gardineri and Paraconotruchus antarcticus. The temperatures at the sampling sites are −0.76 ± 0.05 °C and 0.93 ± 0.05 °C. The topmost portion of the skeleton of each specimen, corresponding to ~5–10 years of growth based on growth estimates (Henry and Torres, 2013; Fallon et al., 2014), was sub-sampled and carefully cleaned using a diamond dental disc.
Each of the skeletal portions extracted from the zooxanthellate and non-zooxanthellate coral samples was finely crushed in an agate mortar, thoroughly mixed, and separated into two aliquots of ~50–100 mg that were transferred to acid-cleaned vials. An aliquot of each sample was cleaned through an oxidative cleaning step (Section 2.2.) before being dissolved and analysed for trace elements. The remaining aliquots of the Caribbean Sea and New Caledonia samples were rinsed with
MilliQ water (18Ω) and dissolved in 0.5 N HNO3. The comparison between “cleaned” and “uncleaned”
aliquots allowed us to evaluate the potential effects of organic contamination on the trace element compositions, and specifically on the Li/Mg temperature proxy.
Table 1. Geographic coordinates and depth of the coral sampling locations, with corresponding seawater temperature and salinity values.
Sample code Sampling location Latitude Longitude Depth (m) Coral species Temperature (°C) Salinity Source of seawater data Annual mean 1s Summer Winter
Ross Sea (Antarctica)
GRC-02-001 Iselin Bank 72°16.11' S 176°36.28' W 670 Javania antarctica 0,93 0,05 34,71 WOA13 v2 (0.25deg) GRC-02-008 Javania antarctica 0,93 0,05 34,71 GRC-02-009 Javania antarctica 0,93 0,05 34,71 GRC-02-010 Javania antarctica 0,93 0,05 34,71 GRC-02-011 Javania antarctica 0,93 0,05 34,71 GRC-02-013 Javania antarctica 0,93 0,05 34,71 GRC-02-020 Javania antarctica 0,93 0,05 34,71 GRC-02-021 Javania antarctica 0,93 0,05 34,71 GRC-02-002 Flabellum impensum 0,93 0,05 34,71 GRC-02-056 Flabellum gardineri 0,93 0,05 34,71 GRC-02-014 Paraconotrochus antarcticus 0,93 0,05 34,71 GRC-02-015 Paraconotrochus antarcticus 0,93 0,05 34,71 GRC-02-050 Paraconotrochus antarcticus 0,93 0,05 34,71 GRC-02-003 Caryophyllia antarctica 0,93 0,05 34,71 GRC-02-024 Caryophyllia antarctica 0,93 0,05 34,71
CARBONANT34 Mawson Bank 73°14.56' S 175°38.35' E 389 Flabellum impensum -0,76 0,05 34,70
Mediterranean Sea
Records 21-6 Sardinia Channel 38°42.197' N 8°54.735' E 432 Madrepora oculata 13,80 0,10 38,61 in-situ and WOA13 v2 (0.25deg)
Caribbean Sea
MEX 01
Puerto Morelos 20°52.739' N 86°50.949' W 5
Orbicella faveolata 27,9 1,1 29,3 26,4 35,98
AVHRR-OISST v2 MEX 01-Wall Orbicella faveolata 27,9 1,1 29,3 26,4 35,98
MEX 02 Orbicella faveolata 27,9 1,1 29,3 26,4 35,98
MEX 05 Orbicella faveolata 27,9 1,1 29,3 26,4 35,98 MEX 05-Wall Orbicella faveolata 27,9 1,1 29,3 26,4 35,98
MEX 06 Orbicella faveolata 27,9 1,1 29,3 26,4 35,98
MEX 06-Wall Orbicella faveolata 27,9 1,1 29,3 26,4 35,98
MEX 10 Orbicella faveolata 27,9 1,1 29,3 26,4 35,98
MEX 11 Orbicella faveolata 27,9 1,1 29,3 26,4 35,98
MEX 12 Orbicella faveolata 27,9 1,1 29,3 26,4 35,98
MEX 13 Orbicella faveolata 27,9 1,1 29,3 26,4 35,98
MEX 09 Orbicella annularis 27,9 1,1 29,3 26,4 35,98
MEX 03 Pseudodiploria strigosa 27,9 1,1 29,3 26,4 35,98 MEX 03-Wall Pseudodiploria strigosa 27,9 1,1 29,3 26,4 35,98 MEX 04 Pseudodiploria strigosa 27,9 1,1 29,3 26,4 35,98 MEX 04-Wall Pseudodiploria strigosa 27,9 1,1 29,3 26,4 35,98 MEX 15 Pseudodiploria strigosa 27,9 1,1 29,3 26,4 35,98
New Caledonia
03.P Dumbea Fausse passe 22°19.656' S 166°13.220'E 3 Porites lobata 24,6 1,6 26,6 22,6 35,42
WOA13 v2 (0.25deg) 06.N-Shadow Dumbea Fausse passe 22°19.656' S 166°13.220'E 6 Porites lobata 24,6 1,6 26,6 22,6 35,42
06.O Dumbea Fausse passe 22°19.656' S 166°13.220'E 6 Porites lobata 24,6 1,6 26,6 22,6 35,42 08.L-Shadow Dumbea Fausse passe 22°19.656' S 166°13.220'E 8 Porites lobata 24,6 1,6 26,6 22,6 35,43 08.M Dumbea Fausse passe 22°19.656' S 166°13.220'E 8 Porites lobata 24,6 1,6 26,6 22,6 35,43 09.K Dumbea Fausse passe 22°19.656' S 166°13.220'E 9 Porites lobata 24,6 1,6 26,6 22,6 35,44 11.5.8-Shadow Uitoe Fausse passe 22°17.033' S 166°10.882' E 11,5 Porites lobata 24,6 1,6 26,6 22,5 35,44 12.5.J Dumbea Fausse passe 22°19.656' S 166°13.220'E 12,5 Porites lobata 24,5 1,6 26,5 22,5 35,44 13.6 Uitoe Fausse passe 22°17.033' S 166°10.882' E 13,6 Porites lobata 24,5 1,6 26,5 22,5 35,44 15.5-Shadow Uitoe Fausse passe 22°17.033' S 166°10.882' E 15,5 Porites lobata 24,5 1,6 26,5 22,5 35,44 16.4 Uitoe Fausse passe 22°17.033' S 166°10.882' E 16,4 Porites lobata 24,5 1,6 26,5 22,5 35,44 18.I Dumbea Fausse passe 22°19.656' S 166°13.220'E 18 Porites lobata 24,5 1,6 26,4 22,5 35,44 18.5 Uitoe Fausse passe 22°17.033' S 166°10.882' E 18,5 Porites lobata 24,5 1,6 26,4 22,5 35,44
21.3 Uitoe Fausse passe 22°17.033' S 166°10.882' E 21,3 Porites lobata 24,4 1,6 26,4 22,5 35,45 23.H Dumbea Fausse passe 22°19.656' S 166°13.220'E 23 Porites lobata 24,4 1,6 26,3 22,5 35,45 24.9 Uitoe Fausse passe 22°17.033' S 166°10.882' E 24,9 Porites lobata 24,4 1,6 26,3 22,5 35,46 27.2 Uitoe Fausse passe 22°17.033' S 166°10.882' E 27,2 Porites lobata 24,4 1,6 26,2 22,5 35,46 28.F-Shadow Dumbea Fausse passe 22°19.656' S 166°13.220'E 28 Porites lobata 24,3 1,6 26,2 22,5 35,46 28.G Dumbea Fausse passe 22°19.656' S 166°13.220'E 28 Porites lobata 24,3 1,6 26,2 22,5 35,46 35 Uitoe Fausse passe 22°17.033' S 166°10.882' E 35 Porites lobata 24,2 1,6 25,9 22,5 35,48 35.E Dumbea Fausse passe 22°19.656' S 166°13.220'E 35 Porites lobata 24,2 1,6 25,9 22,5 35,48 38.D Dumbea Fausse passe 22°19.656' S 166°13.220'E 38 Porites lobata 24,1 1,6 25,8 22,5 35,48 44.C Dumbea Fausse passe 22°19.656' S 166°13.220'E 44 Porites lobata 24,0 1,6 25,5 22,4 35,49 45.1 Uitoe Fausse passe 22°17.033' S 166°10.882' E 45,1 Porites lobata 24,0 1,6 25,4 22,4 35,50 51.B Dumbea Fausse passe 22°19.656' S 166°13.220'E 51 Porites lobata 23,8 1,6 25,1 22,4 35,51
Pacific Ocean
TARA-P I2S3c21 Panama 7°12.3312' N 81°47.4632' W 8 Porites sp. 28,6 0,6 29,2 27,7 31,81
AVHRR-OISST v2 TARA-P I4S1 Easter Island 27°04.76008' S 109°19.24060' W 14 Porites sp. 22,4 1,6 25,3 20,2 36,04
TARA-P I5S4 Easter Island 27°04.76008' S 109°19.24060' W 14 Porites sp. 22,4 1,6 25,3 20,2 36,05 TARA-P I6S2 Gambier Island 23°09.54378' S 134°50.53520' W 9 Porites sp. 25,2 1,3 27,5 23,0 36,08 TARA-P I7S1c1 Moorea Island 17°28.560' S 149°48.675' W 3 Porites sp. 27,8 0,7 28,9 26,4 35,91 TARA-P I7S3c2 Moorea Island 17°29.380' S 149°45.303' W 13 Porites sp. 27,8 0,7 28,9 26,4 35,91 TARA-P I8S1c3 Aitutaki (Cook Islands) 18°50.406' S 159°48.054' W 14 Porites sp. 27,1 0,8 28,4 25,7 35,67 TARA-P I10S0c6 Samoan Islands 13°50.879' S 172°04.424' W 9 Porites sp. 28,9 0,4 29,6 27,9 35,17 TARA-P I11S1c7 Wallis Island 13°18.00' S 176°12.00' W 20 Porites sp. 29,0 0,5 29,6 28,1 35,06 TARA-P I15S1c10 Guam Island 13°14.984' N 144°38.697' E 9 Porites sp. 28,9 0,4 29,6 27,8 35,39
2.2. Chemical treatment
Most trace elements measured in coral skeletons commonly used as proxies for climate reconstructions are biased by the presence of organic matter embedded in the carbonate matrix, or adsorbed on the skeletal surface (Amiel et al., 1973a, 1973b; Allison, 1996). In addition, high concentrations of chlorophyll, associated with the endolithic algae of the genus Ostreobium (Le Campion-Alsumard et al., 1995; Masse et al., 2018), may also affect geochemical signals. However, the impact of chlorophyll on the Li/Mg temperature proxy has not yet been quantified. In this study, different cleaning protocols were tested in order to remove Mg and Li associated with organic contamination and surface adsorption, without removing the fraction incorporated into the coral aragonite matrix (Mitsuguchi et al., 2001; Watanabe et al., 2001). The cleaning protocols were tested on two samples of O. faveolata collected live from Puerto Morelos, one characterized by green bands (2–5mm thick, mainly developed at ~1.5 cm from the surface) indicating the presence of Ostreobium algae (“contaminated” sample), and the other “clean” sample with no apparent green band was used as a control. In parallel, we applied the same cleaning protocols on an inhouse Porites standard (M1P-p) to assess the possible alteration of the initial elemental composition of the skeleton. Samples were finely crushed and split into 5 groups, each consisting of 3 subsamples of ~60 mg transferred to acid-cleaned vials. All groups were acid-cleaned with MilliQ water in an ultrasonic bath for 30s, repeated twice (protocol 1).
Subsequently, groups 2, 3, 4 and 5 underwent specific chemical treatments: group 2 was cleaned with a mixture of 1% H2O2 buffered with 0.1M NH4OH (protocol 2a); group 3 with a mixture of
5% H2O2 buffered with 0.2M NH4OH (protocol 2b); group 4 with a mixture of 15% H2O2 buffered with
0.5M NH4OH (protocol 2c); and group 5 was treated with 5% NaOCl solution in an ultrasonic bath for
5 min, then rinsed with MilliQ water several times (protocol 3). During treatments, groups 2, 3 and 4 were placed in a water bath at 60 °C for 20 min and then rinsed with MilliQ several times. Between each step, vials containing the powder and the cleaning solution were centrifuged at 2320 G for 3 min and the supernatant discarded. After cleaning treatments, samples were dried at 40 °C and dissolved
in 0.5 N HNO3 to obtain 100 ppm Ca solutions that were analysed by ICP-MS (Section 2.3). Based on
the Li/Ca, Mg/Ca and Li/Mg results (Section 3), we decided to apply the cleaning protocol 2c to all the other samples.
2.3. Analytical methods
2.3.1. Solution quadrupole ICP-MS
Cleaned coral samples were dissolved in 0.5 N HNO3 (Optima Fisher Ultra Trace Element
Analysis, 67%) and analysed using a Quadrupole ICP-MS X-Series II at LSCE (Gif-sur-Yvette, France). 7Li, 24Mg, 43,44Ca, 86,87,88Sr, and 238U isotopes were selected to quantify their elemental concentration in the
skeleton following Montagna et al. (2014). Briefly, elemental analysis was performed through a standard addition protocol, using commercial SCP Sciences mono- or multi-standards Inorganic Venture solutions; all standard and sample solutions were diluted to obtain 100 ppm Ca concentration. Data quality was controlled by the analysis of five external carbonate standards (Aragonite AK, RS3, coral JCp1, clam JCt-1 and M1P-p). Replicate analyses of the standards were made after 5 or 10 samples to correct for instrumental drift. Typical mean values and external reproducibility (1σ RSD) obtained by multiple analyses (n=13) of M1P-p during several analytical sequences were: Li/Ca=6.05 μmol/mol (±1.17%), Mg/ Ca=4.35 mmol/mol (±0.52%), Sr/Ca=9.02 mmol/mol (±0.44%), U/Ca=1.10 μmol/mol (±1.00%) and Li/Mg=1.39 mmol/mol (±0.68%). The reproducibility was improved by a factor of 2 compared to the protocol described by Montagna et al. (2014), thus reducing the uncertainties from quadrupole ICP-MS measurements in the Li/Mg temperature calculations. This improvement resulted from a better control of the memory effect and blank contribution by limiting the Li concentration to 100 ppb for the most enriched standard solution. In addition, the acquisition statistic and the reading time of the Li and Mg signals were substantially increased by doubling the number of sweeps and limiting the number of isotopes analysed. Finally, sample solutions were systematically bracketed by the analysis of blanks every five or ten samples (not every sample), increasing the stability of the analytical sequences.
2.3.2. Laser ablation ICP-MS
Four cold-water coral samples from the Ross Sea were also analysed by laser ablation ICP-MS to investigate micro-scale geochemical variations related to coral microstructures (centres of calcification vs. fibrous aragonite) or the presence of mineralogical phases other than aragonite. The topmost portion of the samples was embedded in epoxy resin, glued to a glass slide and lapped to a final thickness between 50 and 100 μm. The thin sections were analysed using a 193 nm ArF excimer laser system (Teledyne® G2) connected to a SF-ICP-MS (Thermo Scientific™ Element XR) at the University of Western Australia. The isotopes 7Li, 25Mg, 43Ca, 86Sr and 238U were selected for analysis and calibrated with the standard JCp-1, which was analysed as a recrystallized powder pellet
showing identical values to those from solution-based analysis (Sadekov et al., 2019). External reproducibility (1σ RSD) assessed by analysing the JCp-1 standard was 14.6% for Li/Ca, 5.7% for Mg/Ca and 14.4% for Li/Mg. Analyses were conducted on different skeletal portions using a 80 μm spot at 8 Hz with a laser fluence of 4 J/cm2, and a dwell time of 30 ms. Data processing and outlier rejection follows Langer et al. (2015).
2.3.3. XRD and mRaman spectroscopy
X-ray powder diffraction (XRD) analyses were performed on five Antarctic samples at the Center of Analyses and Services for Certification (CEASC) of the University of Padova using a PANalytical X'Pert 3 Powder diffractometer (Bragg Brentano θ-θ geometry) equipped with Cu X-ray tube, operating at 40 kV and 40 mA, sample spinner, BBHD mirror and solid-state detector (PixCel). Powdered samples were evenly spread on a silicon zero background sample holder. Scans were performed over the range 3 to 80° 2θ with a virtual step size of 0.017° 2θ and counting times of 100 s per step. The software program High Score Plus 4 (PANalytical) was used for phase identification and quantitative phase analysis with Rietveld refinement. Refined parameters were: (i) scale factors; (ii) zero-shift; (iii) background; (iv) lattice constant; (v) profile parameters (Gaussian and Lorentzian coefficients). The detection limit for the majority of the mineral phases is around 1%. Samples GRC-02-014 (P. antarcticus) and GRC-02-056 (F. gardineri) were also analysed using mRaman spectroscopy. Aragonite and calcite were discriminated, and their spatial distribution mapped for the different L (libration lattice mode) peak in their Raman spectra, which is located at about 206 cm−1 and 282 cm−1, respectively. Spectra were recorded in the frequency range 100–3500 cm−1 using a Thermo Scientific™ DXR™ Raman Microscope with a 780 nm, a 50× long working distance (LWD) objective, at ~5mW of power and a 25 μm pinhole, obtaining ~2.5 cm−1 spectral resolution and 1.1 μm spatial resolution. To optimize the signal to noise ratio, 6 scans of 30 s were acquired per spectrum.
3. Results
3.1. Chemical treatment
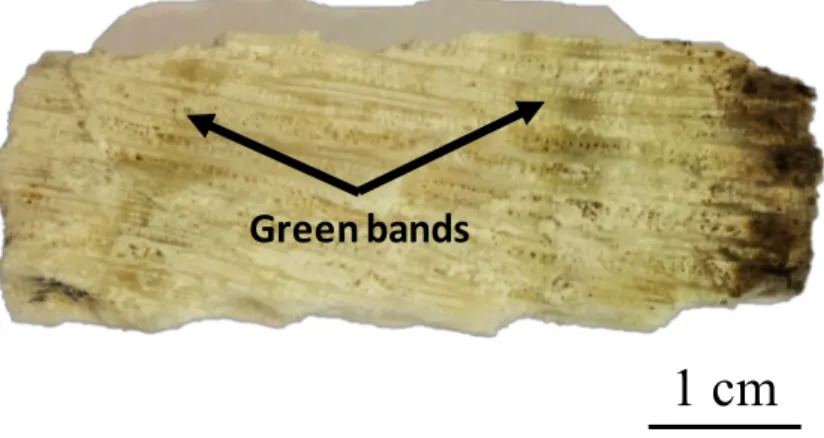
Fig. 2 and Table S1 show the results of the different cleaning protocols applied to the two O. faveolata samples from Puerto Morelos, one “contaminated” by organic matter rich bands (Fig. 3), and another “clean” without a green band used as control sample. The average Mg/ Ca ratio of the sub-samples that were treated only with MilliQ water is particularly high for the sample with the green
band (7.32 ± 0.14 mmol/mol) compared to the control sample (4.26 ± 0.01 mmol/mol), and significantly affects the Li/Mg ratio.
The application of the four treatments (2a, 2b, 2c and 3) effectively reduced the Mg/Ca ratio by 20 to 35% in the “contaminated” sample but did not alter the skeletal composition of the M1P-p Porites standard (< 1%) and only slightly that of the “clean” O. faveolata specimen (< 4%) (Table S1). The Li/Ca ratio decreased by ~7%, ~6% and < 1% in the “contaminated”, “clean” and M1P-p standard, respectively.
Figure 2. Li/Ca, Mg/Ca, Li/Mg and Sr/Ca ratios obtained from O. faveolata samples as a function of different cleaning protocol
tests (1: MilliQ water rinse; 2a: 1% H2O2 + 0.1M NH4OH ; 2b: 5% H2O2 + 0.2M NH4OH; 2c: 15% H2O2 + 0.5M NH4OH; 3: 5% NaOCl.). The contaminated sample (black dots) was characterized by a distinct green band indicating the presence of Ostreobium algae, whereas the control sample (grey dots) did not show any visible green band. Each value is the average (± 1s SD) of 3 subsamples of coral powder (see table S1).
The decrease in Mg/Ca and Li/Ca ratios in the “clean” sample might be due to the presence of organic material residues that are not visible. The most appropriate cleaning protocol was selected based on the largest decrease in Mg/Ca ratio and the lowest inter-samples variability in the “contaminated” sample. Accordingly, protocol 2c, with samples treated with 15% H2O2 buffered with
0.5M NH4OH, seems the most efficient and was systematically adopted to clean all the other coral
samples (Fig. 2). 5 6 7 8 1 2a 2b 2c 3 Li /C a (µ mo l/mo l) 0.0 0.5 1.0 1.5 2.0 1 2a 2b 2c 3 Li /M g (m m ol /m ol ) Cleaning protocol 7.5 7.6 7.7 7.8 7.9 8.0 1 2a 2b 2c 3 Sr /C a (m m ol /m ol ) Cleaning protocol Série1 Série2
O. faveolata (with green band) O. faveolata (without green band)
0 2 4 6 8 1 2a 2b 2c 3 Mg /C a (m m ol /m ol )
Figure 3. Picture of the MEX 05 Orbicella faveolata sample with well-evident greenish bands on the skeleton surface,
associated with organic matter incorporation.
3.2. Zooxanthellate corals
3.2.1. Porites sp.The 25 samples of P. lobata from New Caledonia lagoon yielded Li/Ca, Mg/Ca and Li/Mg ratios ranging from 6.07 to 7.43 μmol/mol, 3.52 to 4.33 mmol/mol, and 1.57 to 1.84 mmol/mol, respectively (Table 2). The oxidative cleaning did not significantly affect Me/Ca ratios for those samples, resulting in a mean Li/Ca, Mg/Ca and Li/Mg decrease of 1.5, 0.7 and 0.9%, respectively. The Li/Mg-derived temperatures are consistent with surface seawater temperature, but underestimate deeper waters temperatures (up to −2°C at 44 m) (Fig. 4). Nevertheless, the application of the cleaning protocol 2c led to slight reductions in the reconstructed temperatures between uncleaned (ΔT=−2.4 to 0.5 °C) and cleaned (ΔT=−2.0 to 0.6 °C) samples, where ΔT represents the shift between ambient seawater temperature and Li/Mg-reconstructed temperature, using exponential equation described by Montagna et al. (2014).
Green bands
Table 2. Li/Ca, Mg/Ca, Li/Mg and Sr/Ca values of zooxanthellate and non-zooxanthellate corals based on solution ICP-MS analysis. Li/Mg-derived temperature are calculated using Montagna et
al. (2014) equation. Trec-Tin-situ is the difference between the reconstructed and the instrumental temperature.
Sample code Species
Li/Ca Mg/Ca Li/Mg Sr/Ca Li/Mg-derived Trec - Tin-situ
(µmol/mol) (mmol/mol) (mmol/mol) (mmol/mol) T (°C) (°C)
Ross Sea (Antarctica)
GRC-02-001 Javania antarctica 15,11 3,06 4,93 11,10 1,9 1,0 GRC-02-008 Javania antarctica 15,98 2,72 5,87 11,33 -1,7 -2,6 GRC-02-009 Javania antarctica 16,22 3,62 4,48 11,17 3,8 2,9 GRC-02-010 Javania antarctica 16,09 2,95 5,46 11,43 -0,2 -1,1 GRC-02-011 Javania antarctica 15,81 3,35 4,72 11,49 2,8 1,9 GRC-02-013 Javania antarctica 15,8 2,77 5,71 11,66 -1,1 -2,0 GRC-02-020 Javania antarctica 15,84 2,66 5,95 11,76 -1,9 -2,9 GRC-02-021 Javania antarctica 15,48 2,87 5,39 11,76 0,1 -0,9 GRC-02-002 Flabellum impensum 12,95 2,59 5,00 10,90 1,6 0,7 GRC-02-056 Flabellum gardineri 25,04 17,45 1,43 10,52 27,1 26,2 GRC-02-014 Paraconotrochus antarcticus 19,40 7,49 2,59 10,59 15,0 14,1 GRC-02-015 Paraconotrochus antarcticus 15,14 3,34 4,54 11,07 3,6 2,7 GRC-02-050 Paraconotrochus antarcticus 19,22 4,29 4,48 10,59 3,8 2,9 GRC-02-003 Caryophyllia antarctica 9,95 2,00 4,98 10,43 1,7 0,7 GRC-02-024 Caryophyllia antarctica 12,98 2,65 4,89 10,72 2,0 1,1
CARBONANT34 Flabellum impensum 12,7 2,29 5,55 11,01 -0,5 0,3
Mediterranean Sea
Records 21-6 Madrepora oculata 10.72 (0.10) 3.81 (0.09) 2.82 (0.05) 10.09 (0.02) 13,3 -0,4
Caribbean Sea
MEX 01-Wall Orbicella faveolata 6,72 4,55 1,48 9,20 26,5 -1,4
MEX 02 Orbicella faveolata 6,61 4,61 1,43 9,26 27,1 -0,8
MEX 02-Wall Orbicella faveolata 6,57 4,89 1,34 9,29 28,4 0,6
MEX 05 Orbicella faveolata 6,49 5,89 1,10 9,30 32,5 4,6
MEX 05-Wall Orbicella faveolata 6,36 5,87 1,08 9,35 32,8 4,9
MEX 06 Orbicella faveolata 6,59 4,09 1,61 9,33 24,7 -3,1
MEX 06-Wall Orbicella faveolata 6,51 4,10 1,59 9,34 25,0 -2,9
MEX 10 Orbicella faveolata 6,39 4,04 1,58 9,37 25,1 -2,8
MEX 11 Orbicella faveolata 6,45 4,23 1,52 9,37 25,9 -2,0
MEX 12 Orbicella faveolata 6,28 4,36 1,44 9,03 27,0 -0,9
MEX 13 Orbicella faveolata 6,41 5,83 1,10 9,37 32,5 4,6
MEX 09 Orbicella annularis 6,65 4,76 1,40 9,03 27,6 -0,2
MEX 03 Pseudodiploria strigosa 5,95 3,89 1,53 9,18 25,8 -2,1
MEX 03-Wall Pseudodiploria strigosa 6,26 4,41 1,42 9,06 27,3 -0,6
MEX 04 Pseudodiploria strigosa 6,16 4,07 1,51 9,11 26,0 -1,9
MEX 04-Wall Pseudodiploria strigosa 6,44 4,55 1,42 9,07 27,4 -0,5
MEX 15 Pseudodiploria strigosa 5,91 3,68 1,61 9,16 24,8 -3,1
New Caledonia
03.P Porites lobata 6,36 4,04 1,57 9,21 25,2 0,6
06.N-Shadow Porites lobata 6,67 4,03 1,65 9,14 24,2 -0,4
06.O Porites lobata 6,45 4,09 1,58 9,18 25,2 0,6
08.L-Shadow Porites lobata 6,47 3,86 1,68 9,15 23,9 -0,7
08.M Porites lobata 6,49 3,93 1,65 9,16 24,2 -0,3
09.K Porites lobata 6,40 4,00 1,60 9,16 24,8 0,3
11.5.8-Shadow Porites lobata 6,07 3,59 1,69 9,22 23,8 -0,8
12.5.J Porites lobata 6,86 4,18 1,64 9,25 24,4 -0,2
13.6 Porites lobata 6,50 3,77 1,72 9,26 23,3 -1,2
16.4 Porites lobata 7,43 4,33 1,72 9,30 23,4 -1,1
18.I Porites lobata 6,84 4,09 1,67 9,24 24,0 -0,5
18.5 Porites lobata 6,29 3,82 1,65 9,18 24,3 -0,2
21.3 Porites lobata 6,85 4,28 1,60 9,15 24,9 0,4
23.H Porites lobata 6,64 4,00 1,66 9,18 24,1 -0,3
24.9 Porites lobata 6,42 3,73 1,72 9,24 23,4 -1,0
27.2 Porites lobata 6,85 4,04 1,69 9,23 23,7 -0,7
28.F-Shadow Porites lobata 6,30 3,85 1,64 9,10 24,4 0,1
28.G Porites lobata 6,49 3,87 1,68 9,23 23,9 -0,4
35 Porites lobata 7,11 3,94 1,81 9,32 22,4 -1,8
35.E Porites lobata 6,63 3,81 1,74 9,35 23,1 -1,1
38.D Porites lobata 6,62 3,67 1,80 9,32 22,4 -1,7
44.C Porites lobata 6,47 3,52 1,84 9,44 22,0 -2,0
45.1 Porites lobata 7,14 3,96 1,80 9,36 22,4 -1,5
51.B Porites lobata 6,67 3,63 1,84 9,15 22,0 -1,8
Pacific Ocean
Tara P I2S3c21 Porites sp. 5,74 4,21 1,36 9,08 28,1 -0,4
Tara P I4S1 Porites sp. 6,83 3,79 1,80 9,36 22,4 0,0
Tara P I5S4 Porites sp. 6,91 3,60 1,92 9,43 21,1 -1,3
Tara P I6S2 Porites sp. 6,92 4,92 1,41 9,02 27,5 2,3
Tara P I7S1c1 Porites sp. 6,13 4,73 1,30 8,93 29,2 1,4
Tara P I7S3c2 Porites sp. 5,58 3,77 1,48 8,98 26,5 -1,3
Tara P I8S1c3 Porites sp. 5,76 4,43 1,30 8,93 29,1 2,0
Tara P I10S0c6 Porites sp. 5,64 4,17 1,35 8,90 28,3 -0,6
Tara P I11S1c7 Porites sp. 6,66 5,30 1,26 8,91 29,8 0,8
Figure 4. Depth profile of the ambient mean annual seawater temperature in New Caledonia from WOA13, plotted together
with reconstructed temperatures from the Li/Mg exponential equation described by Montagna et al. (2014), and the multi-proxy equation calculated using the Li/Mg and Sr/Ca values from the TARA Porites sp. samples (this study). Light and dark blue envelopes represent the seasonal and interannual WOA13 temperature variability, respectively.
The cleaned Porites spp. samples from the TARA Pacific expedition show a larger geochemical variability compared to cleaned specimens from New Caledonia, with Li/Ca, Mg/Ca and Li/Mg ranging from 5.58 to 6.92 μmol/mol, 3.60 to 5.30 mmol/mol, and 1.18 to 1.92 mmol/mol respectively. These ranges are similar to those found in Porites from Ogasawara Island in Japan and Tahiti (Hathorne et al., 2013), and in the tropical Pacific (Montagna et al., 2014). However, they differ from the Porites samples analysed by Rollion-Bard and Blamart (2015) that are characterized by higher Li/Ca (6.1 to 21.6 μmol/mol) and Mg/Ca (3.05 to 8.10 mmol/mol), which they relate to the possible influence of centres of calcification (COC) enriched in both ratios. The Li/Mg-derived temperatures from the TARA samples generally agree with ambient seawater values, with most of the reconstructed temperatures deviating by<1–1.5 °C (Table 2). However, three samples display larger variations (≥2 °C).
0 10 20 30 40 50 60 20 21 22 23 24 25 26 27
D
ep
th
(m
)
Temperature (°C)
Mean temperature (WOA13)
Li/Mg-T°C (equation from Montagna et al., 2014)
3.2.2. Orbicella sp. and P. strigosa
The cleaned Orbicella spp. samples from the Mexican Caribbean show smaller Li/Mg variability
(0.53 mmol/mol) than Porites spp. (0.75 mmol/mol). Variability is largely controlled by the Mg/Ca contents (4.04 to 5.89 mmol/mol), as Li/Ca ratios are rather stable (6.28 to 6.72 μmol/mol). The Mg/Ca and Li/Ca ratios of the P. strigosa samples (Mg/Ca: 3.68 to 4.55 mmol/mol; Li/Ca: 5.91 to 6.44 μmol/mol) are lower than values in Orbicella spp., and the Li/Mg ratios show lower variability (0.19 mmol/mol).
The oxidative cleaning of the Mexican coral species had a strong impact on trace elements. The mean loss of Mg/Ca for Orbicella spp. Was up to 25%, while Li was less affected by cleaning (< 1% of loss), resulting in a mean Li/Mg enrichment of ~26%. For P. strigosa, the mean Mg/Ca loss was<4%, leading to a Li/Mg enrichment of ~3% (Table 2, Table S2). The influence of organic matter related to the green band on the Li/Mg-derived temperatures is clearly detectable. The cleaning protocol induces a strong decrease in Mg/Ca that leads to more realistic temperature estimates, and reduces the difference between the reconstructed and in situ temperatures (Table 2).
3.3. Non-zooxanthellate corals
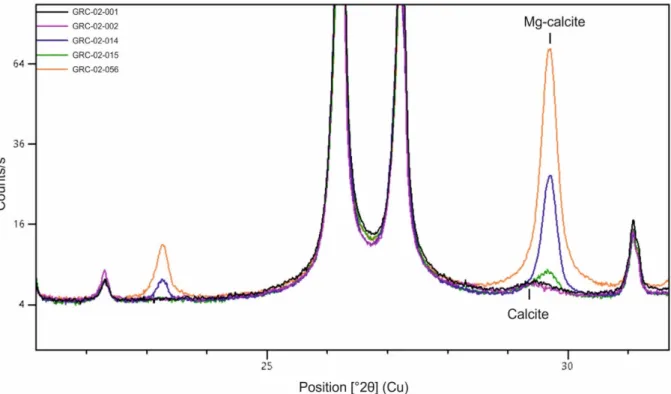
3.3.1. Javania antarcticaThe J. antarctica samples show Li/Ca, Mg/Ca and Li/Mg ratios ranging from 15.11 to 16.22 μmol/mol, 2.66 to 3.62 mmol/mol, and 4.48 to 5.95 mmol/mol, respectively. As for Orbicella spp., the larger variability is observed for Mg/Ca (11%, 1σ RSD), while Li/Ca is relatively stable (2%, 1σ RSD). The difference between Li/Mg-derived and ambient temperatures varies from −2.9 to 2.9 °C (Table 2). XRD analyses of J. antarctica sample GRC-02-001 revealed it has a pristine aragonite skeleton without any detectable calcite (Fig. 5).
3.3.2. Paraconotrochus antarcticus
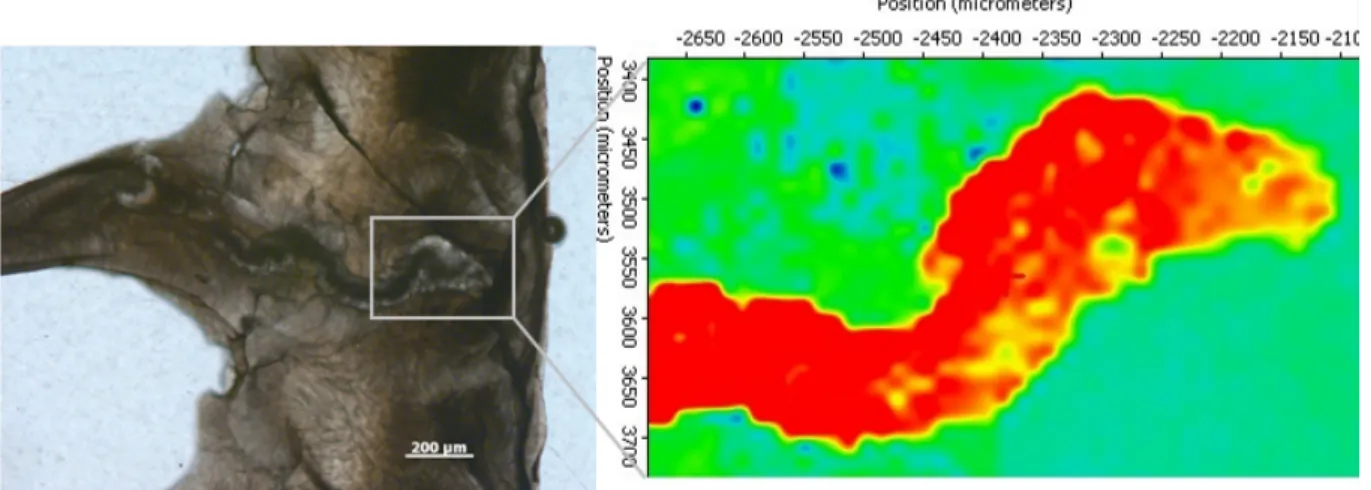
The P. antarcticus samples show quite different Li/Ca, Mg/Ca and Li/Mg values, with sample GRC-02-014 showing the highest Li/Ca (19.40 ± 0.05 μmol/mol) and Mg/Ca (7.49 ± 0.02 mmol/mol) and the lowest Li/Mg value (2.59 ± 0.08 mmol/mol), leading to an excessively warm estimated temperature (15 ± 0.9 °C) (Table 2). XRD analysis of this sample revealed the presence of 5.3 ± 1.0% of Mg-calcite (Fig. 5). 2D mRaman analysis was used to locate the Mg-calcite within the coral skeleton and showed the presence of diagenetic calcite filling a former cavity created by a microborer (Fig. 6). This cavity is 100–150 μm wide and can be few mm long, meandering within the living portion of the
coral aragonite (Fig. 6). The LA-ICP-MS analysis of the calcite portion is consistent with high values of Li/Ca (70.83 ± 39.15 μmol/mol) and Mg/Ca (67.08 ± 42.47 mmol/mol), resulting in low Li/Mg (1.06 ± 0.24 mmol/mol) and anomalously high Li/Mg-derived temperature (> 33 °C) (Table S3). The adjacent fibrous aragonite shows much lower values of Li/Ca (13.19 ± 3.05 μmol/mol) and Mg/Ca (2.68 ± 0.51 mmol/mol) and higher Li/Mg (4.92 ± 0.39 mmol/mol) that corresponds to a Li/Mg-derived temperature of 1.9 ± 1.8 °C, closer to the ambient temperature value (0.93 ± 0.05 °C).
Figure 5. XRD spectra of the Antarctic samples GRC-02-001, GRC-02-002, GRC-02-014, GRC-02-015 and GRC-02-056. Large
high-Mg calcite peaks are observed for samples GRC-02-014, GRC 02-015 and GRC-02-056.
Two other P. antarcticus samples show lower Mg/Ca values, leading to Li/Mg-derived temperatures of 3.6 and 3.8 (±0.9 °C), which are closer to the ambient seawater value, but still overestimated by ~3 °C. XRD analysis of the GRC-02-015 sample revealed the presence of ~0.9% of Mg-calcite.
Figure 6. (left) Cross-section of the thecal wall of the sample GRC-02-014 (P. antarcticus), seen under the plane-polarized
light. The thecal wall is composed of aragonite fibres radiating in different directions. The micro-structure in the center of the image seems a former cavity created by a microborer that was subsequently filled by diagenetic calcite. (right) 2-D mRaman map of the area delimited by the rectangle. Red and green colours identify pure calcite and aragonite, respectively.
3.3.3. F. impensum and F. gardineri
The F. gardineri sample GRC-02-056 has anomalously high Li/Ca (25.04 ± 0.05 μmol/mol) and Mg/Ca (17.45 ± 0.02 mmol/mol) ratios, resulting in a very low Li/Mg value (1.43 ± 0.01 mmol/mol) for cold-water corals from the polar regions (cf. Case et al., 2010; Montagna et al., 2014). The Li/Mg-derived temperature appears to be the most biased, due to the high-Mg/Ca content, resulting in reconstructed temperatures of 27.1 ± 0.9 °C, which over-estimates the in situ temperature (0.93 ± 0.05°C) by >26 °C. Conversely, the F. impensum samples GRC-02-002 and CARBONANT34 have Li/Ca values of 12.95 ± 0.07 and 12.70±0.07 μmol/mol, and Mg/Ca of 2.59 ± 0.02 and 2.29 ± 0.02 mmol/mol, resulting in Li/Mg ratios of 5.00 ± 0.01 and 5.55 ±0.02 mmol/mol, respectively, which are similar to the value reported by Montagna et al. (2014) (5.22 ± 0.06 mmol/mol) for a F. impensum specimen collected live from the Balleny islands and growing at 0.75 °C. Sample GRC-02-056 contains 16.5 ± 1% of Mg-calcite (Fig. 5), whereas no Mg-calcite was detected in the sample GRC-02-002. Similar to the P. antarcticus sample GRC-02-014, 2D mRaman analysis showed the presence of diagenetic calcite filling a former cavity. This calcite, analysed by LA-ICP-MS, contains very high values of Li/Ca (92.23 ± 13.90 μmol/mol) and Mg/Ca (107.86 ± 5.30 mmol/mol), and very low Li/Mg (0.85 ± 0.09 mmol/mol), leading to a high Li/Mg-derived temperature (> 37 °C) (Table S3). The values of Li/Ca (18.85 ± 1.90 μmol/mol), Mg/Ca (3.70 ± 0.36 mmol/mol), and Li/Mg (5.09 ± 0.61 mmol/mol) of the adjacent fibrous aragonite, are similar to those obtained from samples of J. antarctica and P. antarcticus. The Li/Mg-derived temperature of the fibrous aragonite is 1.2 ± 2.5 °C.
3.3.4. Caryophyllia antarctica
The C. antarctica sample GRC-02-024 shows Li/Ca and Mg/Ca values (12.98 ± 0.07 μmol/mol,
2.65 ± 0.02 mmol/mol) that are higher than those obtained from sample GRC-02-003 of the same species (9.95 ± 0.07 μmol/mol; 2.00 ± 0.02 mmol/mol). The Li/Mg ratio is similar in both samples (4.89 and 4.98 ± 0.02 mmol/mol) yielding reconstructed temperatures that are very close to the ambient seawater value.
3.3.5. Madrepora oculata
The element/Ca ratios of the M. oculata sample from the Mediterranean Sea are reported as the average ± 1σ SD of 6 different aliquots sub-sampled from the same polyp (Table 2). The Li/Ca, Mg/Ca and Li/Mg values are 10.72 ± 0.10 μmol/mol, 3.81 ± 0.09 mmol/mol and 2.82 ± 0.05 mmol/mol, respectively, with a Li/Mg-derived temperature being only 0.4 °C different from the in situ value.
4. Discussion
4.1. Effects of the organic matrix on the coral geochemistry
Most of the Orbicella samples collected live from the Mexican Caribbean revealed distinct 2– 5mm thick green bands (Fig. 3), related to the presence of the endolithic green algae Ostreobium (Tribollet, 2008; Quiroga Garcia, 2014; Masse et al., 2018). The analyses of coral sub-samples containing the green bands show high levels of Mg/Ca, associated with relatively stable Li/Ca, leading to unusually low Li/Mg values for tropical corals (e.g. 0.59 mmol/mol for MEX 13 compared to ~1.5 mmol/mol for corals living at similar temperatures; Montagna et al., 2014), and temperatures overestimated by >15 °C (Table S2).
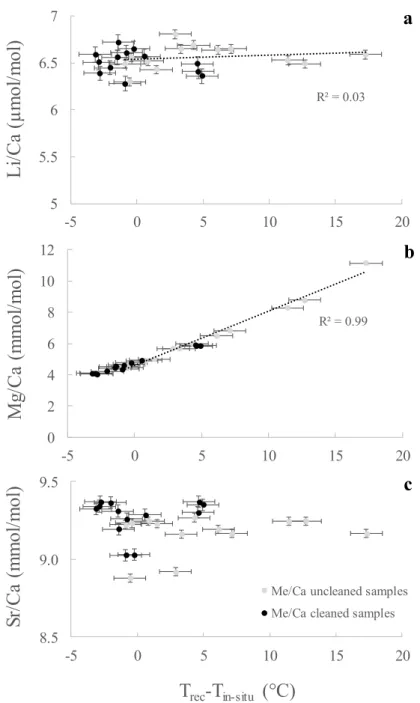
The difference between the Li/Mg-derived temperature and the ambient seawater is mostly attributed to the Mg/Ca ratio (Fig. 7). Conversely, specimens of P. strigosa from the same environment are not affected by green bands, and the levels of Mg/Ca and Li/Mg are similar to those for Porites spp. (this study; Hathorne et al., 2013; Montagna et al., 2014; D'Olivo et al., 2018; Zinke et al., 2019) and Siderastrea siderea (Fowell et al., 2016). Once treated with the oxidative protocol, the Orbicella spp. and P. strigosa samples show a reduction in Mg/Ca by >25% and ~4%, respectively, suggesting that Mg is strongly linked to the presence of the green band. In particular, for the O. faveolata samples MEX 05 and MEX 13, which are characterized by a very distinct green band (Fig. 3), the Mg/Ca reduction was up to 36%. This value is similar to that reported for Montastrea faveolata (now O. faveolata) by
Watanabe et al. (2001) who suggested that 40% of Mg can be absorbed in organic matter at the surface of the crystals.
Conversely, the chemical treatment did not affect the Li/Ca content, being reduced by only 1% for both genera. This is indicative that the green band is due to the presence of chlorophyll, as the photosynthetic pigment in Ostreobium (Jeffrey, 1968) incorporates Mg in its molecular structure. In contrast, the band is not enriched in Li, which is not a chlorophyll component, leading to a significant modification of the initial skeletal Li/Mg ratio. Those results differ from Fowell et al. (2016), who reported a decrease of 25% in Li/Ca due to the removal of organic matter after cleaning with 1% H2O2
buffered in 0.1M NH4OH. This difference may be explained by a different origin of the organic matter,
which can be attributed to skeletal tissue in Fowell et al. (2016), and chlorophyll from the Ostreobium algae in our study.
Other studies focused on Li/Ca and Li/Mg ratios in corals applied very different cleaning protocols. Case et al. (2010) cleaned the samples (only cold-water corals) using the oxidative and reductive steps of Cheng et al. (2000); Montagna et al. (2014) applied a sequence of oxidative and reductive steps following Lomitschka and Mangini (1999); Hathorne et al. (2013) dissolved samples without any precleaning treatment; Raddatz et al. (2013) used a small quantity of 30% H2O2 to clean
the skeleton of the cold-water coral Lophelia pertusa; and D'Olivo et al. (2018) and Zinke et al. (2019) bleached Porites coral slabs in 6% reagent-grade NaClO solution for 24 h.
Overall, our cleaning protocol significantly improved the reconstructed temperatures, reducing the difference with ambient seawater values to <3 °C, except for samples MEX 05 and MEX 13 (~5 °C) (Table 2). The incomplete removal of organic matter in those samples strongly marked by green bands could explain this larger shift. Our protocol thus appears to be the most efficient in removing Mg associated with green bands, giving Li/Mg ratios closer to published values for tropical corals. However, reconstructed temperatures can still be up to 3 °C lower than expected for some samples (e.g. MEX 06 and MEX 15) (Table 2), which cannot be easily explained by organic-bound Mg. Part of this difference could be related to the uncertainty of the Li/Mg vs. temperature calibration (Montagna et al., 2014) at the high (tropical) temperatures, but it also reveals a potential species-specific effect regarding the amount of COC-like structures, which is known to be enriched in Mg and can also alter the Li/Mg ratio (Montagna et al., 2014; Rollion-Bard and Blamart, 2015).
The cleaning treatment did not affect the Li/Ca, Mg/Ca and Li/Mg ratios of the P. lobata samples from New Caledonia, which is consistent with results from the cleaning test of the M1P-p Porites standard (Table S1), suggesting either that the amount of organic matter entrapped in the skeleton of this genus is much less than that present in O. faveolata, or the organic component in Porites contains little (or no) chlorophyll.
Moreover, similar pre- and post-cleaning geochemical values for the New Caledonia samples confirm that our cleaning protocol did not alter the skeletal composition. These results differ somehow from those reported by Montagna et al. (2014) that showed a systematic and comparable % decrease in Li/Ca and Mg/Ca ratios after applying different cleaning steps to the JCp-1 Porites standard, all involving a weak acid treatment (i.e. 0.01 and 0.05 N HNO3). However, the Li/Mg ratio did not change
between treated and untreated samples. We speculate that the decrease in Li/Ca and Mg/Ca ratios in Montagna et al. (2014) was due to the weak acid treatment that might have selectively attacked COC and/or fibres.
Overall, our results show a possible species-specific effect. Indeed, despite being collected from the same site, thus implying similar environmental conditions, Orbicella spp. and P. strigosa differ in relation to the organic matter incorporated, or the nature of this organic component. The genus Orbicella seems particularly affected by the organicbound Mg content, confirming the results of Jones et al. (2015) who obtained high Mg/Ca values (~4.6 mmol/mol) for O. annularis from the Southern Gulf of Mexico. Conversely, P. strigosa and Porites appear to be more suitable for paleo-temperature reconstructions based on the Li/ Mg proxy.
Figure 7. Li/Ca, Mg/Ca and Sr/Ca values for chemically-treated (black dots) and untreated (grey dots) Orbicella sp. samples,
plotted against the difference between the reconstructed and instrumental temperature (Trec – Tin-situ). Li/Mg-reconstructed temperatures were calculated using Montagna et al. (2014) equation.
4.2. Effect of diagenetic calcite on the Li/Mg proxy
Antarctic samples GRC-02-014 (P. antarcticus), and GRC-02-056 (F. gardineri) show high Mg/Ca values despite being treated with the oxidative cleaning (Table 2). This suggests that the anomalous Mg in these corals is not bound to the organic component oxidized by hydrogen peroxide, and therefore may be associated with calcite. Furthermore, high Mg/Ca values correspond to higher Li/Ca ratios (and relatively lower Sr/Ca), with both ratios showing a strong correlation (R=0.85, p-value < 0.001). A selection of five Antarctic cold-water corals was therefore analysed by X-ray powder
R² = 0.99 0 2 4 6 8 10 12 -5 0 5 10 15 20
M
g/
Ca
(m
m
ol
/m
ol
)
b
8.5 9.0 9.5 -5 0 5 10 15 20Sr/
Ca
(m
m
ol
/m
ol
)
T
rec-T
in-situ(°C)
Me/Ca uncleaned samples Me/Ca cleaned samples
c
R² = 0.03 5 5.5 6 6.5 7 -5 0 5 10 15 20L
i/Ca
(
µ
m
ol
/m
ol
)
a
diffraction (XRD) and mRaman spectroscopy to identify the presence of carbonate phases other than aragonite. XRD revealed variable amounts of calcite, from 0.9 to 16.5% (Fig. 5), while mRaman allowed precise location of the calcite at micrometer scale within the coral skeleton (Fig. 6). The presence of diagenetic calcite was previously observed in live corals, notably in Porites sp. (Lazareth et al., 2016), and is known to bias paleoclimate reconstructions from Sr/Ca or Mg/Ca ratios (McCulloch et al., 1996; McGregor and Gagan, 2003; Nothdurft et al., 2007). However, only a few studies have evaluated the impact of calcite on the Li/Mg ratio.
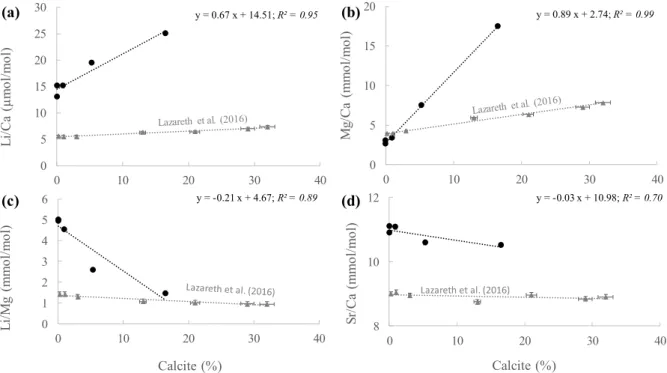
Lazareth et al. (2016) showed that Li/Mg in a Porites in Vanuatu has a higher sensitivity to calcite compared to Sr/Ca. These biases are notably due to a considerable enrichment of Mg content in skeleton infilled by diagenetic calcite (Berner, 1975; Allison et al., 2007; Nothdurft et al., 2007; Bryan and Marchitto, 2008; Hathorne et al., 2011; Lazareth et al., 2016). XRD analysis revealed the presence of high-Mg calcite in the skeleton of samples GRC-02-015 (0.9%), GRC-02-014 (5.3%) and GRC-02-056 (16.5%), whereas this carbonate phase was below the detection limit for samples GRC-02-001 and GRC-02-002. Consequently, the Mg/ Ca in high-Mg calcite-contaminated samples is much higher than those of pristine samples, which reduces the Li/Mg ratio as previously observed for Porites sp. (Lazareth et al., 2016). Li/Mg decreases linearly with the amount of calcite (R2=0.89, p-value < 0.001)
(Fig. 8c) in response to a steeper increase of Mg/Ca compared to Li/Ca (Fig. 8a, b). Sr/Ca shows a weak decrease with the amount of calcite (Fig. 8d).
Figure 8. Variation of Li/Ca, Mg/Ca, Sr/Ca and Li/Mg ratios as a function of high-Mg calcite percentage for the Antarctic
samples GRC-02-001, GRC-02-002, GRC-02-014, GRC-02-015 and GRC-02-056. Data from Porites sp. Me/Ca vs %Calcite from Lazareth et al. (2016) are shown for comparison.
0 5 10 15 20 25 30 0 10 20 30 40 L i/ Ca ( µ mo l/ m ol ) (a) y = 0.67 x + 14.51; R² = 0.95 0 5 10 15 20 0 10 20 30 40 M g/ Ca (m m ol /m ol ) (b) y = 0.89 x + 2.74; R² = 0.99 0 1 2 3 4 5 6 0 10 20 30 40 L i/ M g (m m ol /m ol ) Calcite (%) (c) y = -0.21 x + 4.67; R² = 0.89 8 10 12 0 10 20 30 40 Sr/ Ca (m m ol /m ol ) Calcite (%) (d) Lazareth et al. (2016) y = -0.03 x + 10.98; R² = 0.70
We can estimate the effect of the Mg-calcite on the different Me/Ca ratios based on the following equations:
Li/Ca (µmol/mol) = 0.67 (± 0.09) x %Calcite + 14.51 (± 0.70) (1)
(R² = 0.95, p-value < 0.001)
Mg/Ca (mmol/mol) = 0.89 (± 0.02) x %Calcite + 2.74 (± 0.13) (2)
(R² = 0.99, p-value < 0.001)
Sr/Ca (mmol/mol) = -0.03 (± 0.01) x %Calcite + 10.98 (± 0.09) (3)
(R² = 0.70, p-value < 0.04)
Li/Mg (mmol/mol) = -0.21 (± 0.04) x %Calcite + 4.67 (± 0.34) (4)
(R² = 0.89, p-value < 0.001)
Mg/Ca and Li/Ca increase by 0.89 mmol/mol and 0.67 μmol/mol/% calcite respectively, leading to a decrease in Li/Mg of 0.21 mmol/mol/% calcite, which corresponds to a Li/Mg-derived temperature sensitivity of ~+1.5 °C/% calcite for the Antarctic cold-water coral samples (Fig. 9). This is much higher than the temperature sensitivity estimated for the Porites sp. in Lazareth et al. (2016) (+0.27 °C/% calcite; Fig. 9).
Figure 9. Difference between the reconstructed and instrumental temperature (Trec – Tin-situ) as a function of the percentage of high-Mg calcite in Antarctic corals (this study) and Porites sp. (Lazareth et al., 2016). Li/Mg-reconstructed temperatures were calculated using Montagna et al. (2014) equation.
This difference is likely related to a different composition of the calcite at both sites (e.g. high-Mg vs. low-high-Mg calcite), precipitated under very different environmental conditions, but further analyses are needed to support this hypothesis. The Sr/Ca ratio is less impacted by the presence of diagenetic calcite, as observed in Lazareth et al. (2016), showing a slight decrease of 0.03 mmol/mol/% calcite. Taking advantage of such strong linear correlations between Li/Caand Mg/Ca with % of calcite (R2=0.95 and 0.99, respectively) (Fig. 8), corrections were applied to Li/Mg ratios based on the presence
of calcite.
This correction is based on the assumption that calcite is the only source of anomalous Mg and Li. By normalizing the two intercepts of Li/Ca and Mg/Ca at 0% of calcite (14.51 ± 0.70 μmol/mol and 2.74 ± 0.13 mmol/mol, respectively), a Li/Mg (0% calcite) ratio of 5.30 ± 0.51 mmol/mol is obtained. This corresponds to a reconstructed temperature of 0.4 ± 2.1 °C, which is similar to the ambient seawater temperature of 0.9 °C. The difference between the Li/Mg-derived temperature and the ambient seawater temperature for the sample showing the highest calcite value (GRC-02-056; 16.5%) is thus significantly reduced, from 26.2 ± 2.4 °C to 0.5 ± 2.1 °C. Similar calculations for Porites sp. from Vanuatu provide average corrected temperatures of 27.8 ± 2.1 °C (1σ SD, n=7), which is consistent with in situ annual mean value of 27.9 ± 0.5 °C (Lazareth et al., 2016; Fig. 10).
Although the calcite contribution on the Li/Mg proxy can be reasonably corrected based on a linear regression model, it is important to note that regression coefficients might depend on a series of different factors, including the Mg content of the infilling calcite (i.e. high-Mg vs. low-Mg calcite),
y = 1.55 x+ 1.88 R² = 0.96 y = 0.27 x + 0.15 R² = 0.93 0 10 20 30 0 10 20 30 40 Trec -Tin -si tu (° C) Calcite (%)
Antarctic corals (this study) Lazareth et al., 2016 (Porites)
Antarctic corals (this study) Lazareth et al., 2016 (Porites sp.)
and specific regression lines need to be derived for each case study, making this approach problematic. Here, we emphasise the limitations of the Li/Mg-temperature proxy when utilising both live and fossil coral samples that contain traces of diagenetic calcite and suggest possible solutions rather than attempt to provide robust ‘universal’ equations. This approach might be employed when working with particularly valuable samples, such as the Antarctic aragonite cold-water corals, rather than discarding samples with detectable calcite.
As calcite within the aragonite skeleton can be located using both mRaman and optical microscopy (Fig. 6), high resolution analysis using laser ablation ICP-MS can be adopted to target pristine aragonite and hence avoid calcite contamination. We focused the laser beam on both the fibrous aragonite and the calcite vein of two Antarctic corals (F. gardineri GRC-02-056 and P. antarcticus GRC-02-014) (Fig. 6). The Li/Ca and Mg/Ca values of the calcite vein are much higher than those in the fibrous aragonite (Table S3), and are consistent with values obtained by extrapolating the linear regressions for Li/Ca (Eq. (1)) and Mg/Ca (Eq. (2)) to 100% calcite (81.51 ± 9.7 μmol/mol and 91.74 ± 2.13 mmol/mol, respectively). The Li/Mg-derived temperature is ~1.5 °C for the aragonite portion and ~35 °C for the calcite vein (Fig. 10, Table S3).
This value is close to the Li/Mg-derived temperature using the linear regression extrapolated to 100% of calcite (~37 °C). Although, laser ablation micro-scale analysis of corals contaminated by calcite appears as a promising method to reconstruct reliable temperature by targeting only pristine aragonite portions, it would not necessarily avoid the issue of organic contaminants. An effective strategy might be to chemically clean coral slabs before analysing the pristine aragonite portions by laser ablation (see D'Olivo et al., 2018). This approach should be tested in the future to assess whether the organic-bound Mg content is totally removed before laser analysis.
Figure 10. Ambient and reconstructed temperatures from the Antarctic cold-water corals and Porites sp. (Lazareth et al.,
2016) affected by diagenetic calcite. Temperatures values were derived from the Li/Mg-T exponential equation reported in Montagna et al. (2014), using the Li/Mg data obtained from the solution-based ICP-MS analysis and the laser ablation ICP-MS analysis of the aragonite and calcite portions, as well as the extrapolated Li/Ca and Mg/Ca values at 0% of calcite (“Linear regression”; see text).
4.3. Depth and light conditions
The 25 P. lobata samples collected in New Caledonia along a depth gradient (from 3 to 51 m) were studied in order to investigate the potential effect of depth and light exposure on proxies as recently proposed (e.g. Reynaud et al., 2007; Dissard et al., 2012; Thil et al., 2016).
The Li/Mg ratios of these samples do not appear to be affected neither by organic matter nor by the presence of calcite. The Li/Mg-derived temperature, based on the general equation of Montagna et al. (2014), shows an average value of 23.7 ± 0.9 °C (1σ SD, n=25) that matches well the ambient seawater temperature (24.4 ± 0.2 °C, average ± 1SD of the first 51m of the water column) (Fig. 4), with a coherent signal of decreasing temperature with depth. Although the Li/Mg-derived temperature shows accurate values compared to ambient seawater for the upper 28 m, with a moderate offset of −0.4 ± 0.6 °C relative to WOA13 v2 temperatures, reconstructed temperatures differ below 35 m, with a greater temperature offset of −1.6 ± 0.6 °C between 35 and 51m (Table 2, Fig. 4). This underestimation of reconstructed temperature with depth may be attributed to the decrease of light availability along the water column. Impact of light on coral proxies (e.g. Sr/Ca, B/Ca, δ18O, δ11B) has been highlighted previously (e.g. Cohen et al., 2001; Reynaud et al., 2007; Dissard et
28.0 2.6 2.4 38.7 28.4 36.7 30.0 0.7 -1.8 0.7 32.3 27.4 26.5 25.6 0.9 9.8 0.4 1.6 35.5 27.9 31.8 27.8 -10 0 10 20 30 40 50 WOA13-T°C Solution
ICP-MS RegressionLinear (aragoniteLaser portion)
Laser (calcite portion)
IGOSS SST Solution
ICP-MS RegressionLinear
Te m pe ra ture ( °C)
al., 2012; Juillet-Leclerc et al., 2014; Thil et al., 2016; Juillet-Leclerc et al., 2018), but its effect on Li/Mg proxy is still to be documented.
To confirm the potential effect of light on Li/Mg accuracy, some Porites colonies were collected at various depths (6, 8, 11.5, 15.5 and 28 m; Table 2) under permanent shady conditions. Reconstructed
temperatures from these colonies tend to slightly underestimate the ambient values, with a mean shift of −0.8 ± 0.5 °C (n=4) for the upper water column (3–15.5 m) and larger underestimation observed for Porites at 15.5m (−1.5 ± 0.6 °C). Such temperature difference is comparable to the values calculated from samples growing in deeper water (35–51 m). Shallow-water samples (3–15.5 m) exposed to direct sunlight show negligible temperature difference (0.0 ± 0.7 °C) (n=6).
These observations confirm the possible influence of light on the Li/Mg ratio as already observed for other geochemical proxies, thus underestimating temperatures with increasing depth/shady conditions, and may represent a source of uncertainty for paleo-reconstructions from shallow water corals. This needs to be corroborated further with other field data (e.g. corals collected along a depth profile), and/or through culture experiments at different light conditions.
4.4. Refining the Li/Mg calibration and the use of a multi-proxy approach
Most of the existing exponential and linear Li/Mg-temperature calibrations are not well constrained for the very low polar temperatures (< 1 °C), especially owing to the paucity of coral living in extreme subfreezing conditions (Case et al., 2010; Hathorne et al., 2013; Raddatz et al., 2013; Montagna et al., 2014; Fowell et al., 2016; D'Olivo et al., 2018; Zinke et al., 2019), with the only notable exception being the F. impensum specimen analysed by Montagna et al. (2014). New Antarctic samples investigated in the present study represent a unique opportunity to extend the general Li/Mg-temperature equation described by Montagna et al. (2014) to Li/Mg-temperatures lower than 1 °C.
A revised exponential regression was obtained by combining the Li/ Mg values of all the corals reported in Montagna et al. (2014) with those from the samples analysed in the present study, excluding the ones showing detectable traces of calcite and green bands to avoid integrating anomalous values in the calculation (Fig. 11). The regression analysis was also limited to the two datasets and excluded other less well constrained literature data to minimize differences in the analytical techniques and uncertainties associated with different sample treatments applied before the analysis (e.g. different cleaning protocols or coral sub-sampling).