HAL Id: hal-03003458
https://hal.umontpellier.fr/hal-03003458
Submitted on 13 Nov 2020
HAL is a multi-disciplinary open access
archive for the deposit and dissemination of sci-entific research documents, whether they are pub-lished or not. The documents may come from teaching and research institutions in France or abroad, or from public or private research centers.
L’archive ouverte pluridisciplinaire HAL, est destinée au dépôt et à la diffusion de documents scientifiques de niveau recherche, publiés ou non, émanant des établissements d’enseignement et de recherche français ou étrangers, des laboratoires publics ou privés.
Direct Observation of the Surface Topography at High
Temperature with SEM
Renaud Podor, X. Le Goff, Joseph Lautru, H.P. Brau, Mathias Barreau,
Xavier Carrier, Jerôme Mendonça, Dorian Nogues, Antoine Candeias
To cite this version:
Renaud Podor, X. Le Goff, Joseph Lautru, H.P. Brau, Mathias Barreau, et al.. Direct Observation of the Surface Topography at High Temperature with SEM. Microscopy and Microanalysis, Cambridge University Press (CUP), 2020, 26 (3), pp.397-402. �10.1017/S1431927620001348�. �hal-03003458�
1
Direct observation of the surface topography at high temperature with SEM
RenaudPODOR*1, Xavier LE GOFF1, Joseph LAUTRU1, Henri-Pierre BRAU1, Mathias BARREAU2, Xavier CARRIER2,
Jerôme MENDONÇA1,3, Dorian NOGUES3, Antoine CANDEIAS3
1 ICSM, UnivMontpellier, CNRS, CEA, ENSCM, Bagnols sur Ceze, France
2 Sorbonne Université, CNRS, Laboratoire de Réactivité de Surface, F-75252 Paris, France
3 NewTEC Scientific, 285 Rue Gilles Roberval, 30900 Nîmes, France
* Corresponding author.
Adress : Institut de Chimie Séparative de Marcoule ICSM UMR 5257 – CEA / CNRS / UM / ENSCM Site de Marcoule, Bâtiment 426
BP 17171
F-30207 Bagnols sur Cèze Cedex FRANCE
Phone : ++ 33 (0)4 66 33 92 02 Email : [email protected]
2
Highlights
Observation of the topography of sample surfaces while heating Reconstruction of 3D images at high temperature
Description of surface transformations at high temperature at the microscopic scale
Keywords
SEM, high temperature, 3D surface reconstruction, topography
Running title
3
Abstract
High temperature scanning electron microscopy allows the direct study of the temperature behaviour of materials. Using a newly developed heating stage, tilted images series were recorded at high
temperature and 3D images of the sample surface were reconstructed. By combining 3D images
obtained at different temperatures, the variations of material roughness can be accurately described and associated with local changes of the topography of the sample surface.
4
1. Introduction
Most of the thermal processes occurring during the high temperature transformation of materials (oxidation of materials, crystallization, sintering of metals, formation of coatings, glass-ceramic formation, glass foams…) involve large topographic modifications that are not observable directly by conventional characterization techniques.
Most often, post mortem observations can provide information relative to the final sample topography. Only few methods are reported for the direct observation of surface topographic modifications at the microscopic scale as a function of temperature. Among them, on can cite Atomic Force Microscopy, up to 500°C in ambient air and 750°C in vacuum (Broekmaat et al., 2008 ; Hobbs et al., 2009 ; Roobol et al., 2015 ; Chandra et al., 2019) or 3D profilometry up to 400°C (Li, 2015). They are generally limited to relatively low temperatures and / or to limited regions of interest. High temperature Environmental Scanning Electron Microscopy (ESEM) is one of the techniques allowing to observemorphological modifications of a sample as a function of heat treatment but it did not directly yield to a 3D surface description.
3D reconstruction methods of surfaces can be achieved through commercial (Alicona Mex, Digitalsurf Mountains®) or homemade softwares (Ponz et al., 2006; Tafti et al., 2015) based upon the recording of SEM tilted image series that is in constant development (Tafti et al., 2016; Slowko et al., 2018; Weili et al., 2019). If this method is routinely used to characterize the topography of sample surfaces at room temperature (Shi et al., 2018; Podor et al., 2019a), it has been only recently reported for the description of material surfaces at high temperature (Joachimi et al., 2018; Podor et al., 2019b). However, no complete characterization of the topographic transformations occurring during a complete heat treatment has been reported yet. We herein propose to use an ESEM coupled with a high temperature
5 heating stage to record tilted image series and reconstruct 3D images of the sample surface with a submicrometric resolution. To achieve this goal, we have developed a new heating stage that can be tilted within the +5 / -5 degrees angles and that can be heated up to 1050°C under various gaseous atmospheres. In the present study, the model sample is an Al-Si coated boron steel employed into the body structure of vehicles (Karbasian et al., 2010; Fan et al., 2012). In order to achieve the desired mechanical properties, this ultra-high strength steel is usually hot stamped at 900°C. Consequently, it will be heated from RT to 900°C under 100Pa air in the ESEM chamber to observe and characterize the coating formation and 3D surface modifications in order to determine the possibilities of the method. In the case of steels or coated steels, control of the surface roughness parameters is crucial because of their close relationship with numerous properties such as weldability, paintability, corrosion resistance or hydrogen diffusivity. Heating parameters, such as temperature, heating rate or dwell time (Jenner et al., 2010), strongly affect the final surface morphology. In order to select the proper conditions for the targeted application, it is of high interest to have a real-time and temperature-dependent information for a better understanding of the different surface transformations.
As another example, the surface structure is also a critical parameter in heterogeneous catalysis. During its preparation or activation, a catalyst can undergo several heat treatments under different
atmospheres (reductive, oxidative…), which will cause changes in the surface morphology with important implications in its final activity. For a defined system, a better comprehension of the
temperature-dependent changes occurring during activation will be highly useful.
2. Methods
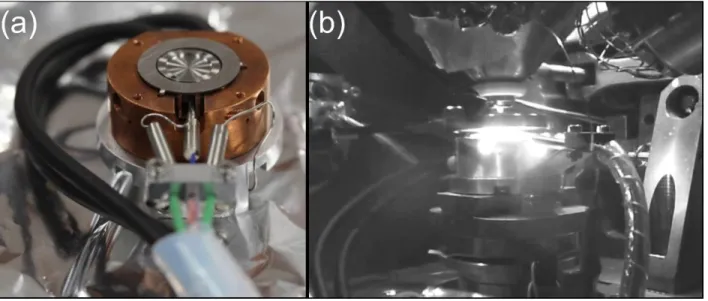
HT-ESEM experiments have been performed using a Quanta 200 ESEM FEG (FEI / Thermo Fisher Scientific) coupled with a heating stage developed by NewTEC Scientific Company (NewTec, 2019) (Fig.
6 1a). This heating stage is fully metallic and cooled by an external cooling system. The maximum
achievable temperature is 1050°C and the heating rate can range between 1°C/minute to 10°C/second. Two thermocouples allow a very precise control of both heating stage and sample temperatures (±0.1°C). A view of the heating stage heated at T=900°C is reported on Fig. 1b.
Figure 1. Views of the FurnaSEM heating stage. a) Positioned on the stage of the ESEM. b) Heated at 900°C in 100Pa air inside the ESEM chamber.
During the experiment, the heating rate is 10°C/minute. Images of a Region of Interest (ROI) are continuously recorded at magnification X500. After a change of the sample morphology is observed, sample heating is stopped, the sample is maintained at a constant temperature and a tilted image series (+5 / 0 / -5 angles) is recorded. Then, heating is continued to the next step. The electron beam conditions for image recording are a 0.5nA beam current and a 6kV high voltage. Both values have been optimized in order to enhance the secondary electron emission from the sample surface while keeping a sufficient signal/noise ratio on the high temperature gaseous secondary electron detector (provided by FEI
7 company – refer to Podor et al., 2019b, for more information). Furthermore, the working distance was constrained by the heating stage and heat shield geometry (see Fig. 1b) and it has been fixed to 15.5mm for this study. This value does not correspond to the eucentric height and it was necessary to center manually the ROI of the sample after tilting the heating stage. For the 3D image reconstruction, Alicona Mex software is used (Alicona). Several parameters of interest will be used to qualify the 3D
reconstruction quality and the surface morphology (average height Sa, maximum height Sz and volume of grains).
3. Results and discussion
The movie showing the 2D morphological modifications is reported as Supplementary File S1. All the surface transformations can be directly seen. These transformations are mainly related to phase
transformations between monometallic Al and Si, Al-Fe binary and Al-Fe-Si ternary phases with different volumes. The transformations possibly occurring at the surface were already described in numerous studies, using ex situ cross-sections characterizations (Rivlin & Raynor, 1981; Grigorieva et al., 2011) and 3D surface reconstructions (Liang et al., 2017) of the coated steel after the heat treatment. The detailed description of real-time observed transformations is the topic of another paper (Barreau et al.,
submitted).
Several 3D tilted images series were recorded up to 900°C. Between room temperature and 675°C, 12 successive tilted image series were recorded, even if no specific morphological modification can be observed from conventional 2D images. Regarding the important transformation occurring at 715°C, one image series was recorded at this temperature when the equilibrium seemed to have been reached. Morphological transformations are still observed with increasing temperature, and 5 other tilted image series were recorded up to 900°C. Two supplementary image series were recorded after a 30 minutes
8 heat treatment at 900°C and after sample cooling at room temperature for comparison. When T≥775°C, image series with different magnifications ranging from X4000 to X250 were recorded in order to determine what is the highest magnification that can be experimentally reached while maintaining an optimal image quality for 3D reconstructions.
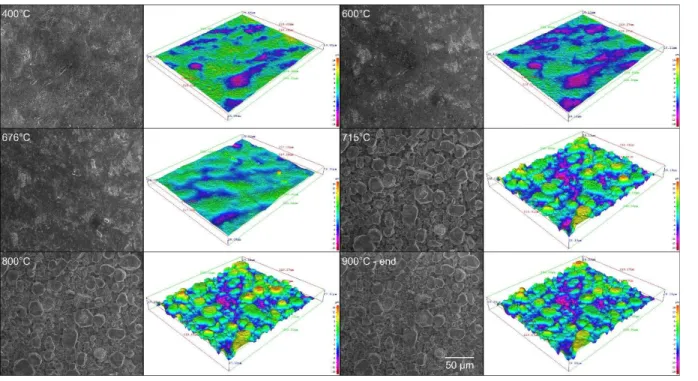
3D surfaces were reconstructed in the complete temperature domain and at different magnifications. Several 3D reconstructions are reported in Fig. 2, with the corresponding HT-ESEM images (recorded with a 0 tilt angle). All the 3D surfaces have been aligned together and represented in a (-15µm ; +15µm) z-scale for comparison. The alignment procedure of two successive 3D images (recorded at 800°C and 850°C as an example) was performed using the “automatic rough alignment” and the “automatic fine alignment” functions implemented in the Mex software. The movie obtained by stacking the 3D images is reported as Supplementary file S2.
From these images, the variation of the surface morphology, in term of topography, is clearly evidenced. First, in the temperature range 400-675°C, topographic transformations are observed whereas no clear transformation can be observed on the HT-ESEM images. Second, when the main transformation is occurring at T=715°C, the 3D surface reconstructed from X500 magnification images exhibits hills and valleys and proposes a 3D view of the sample surface after heat treatment. Thus, the modifications of the sample surface that have occurred during the heat treatment can be characterized and described through roughness parameters, depth profile variations or local volume variations of grains.
9 Figure 2. 2D and corresponding 3D reconstructions of the sample surface recorded in situ at high temperature
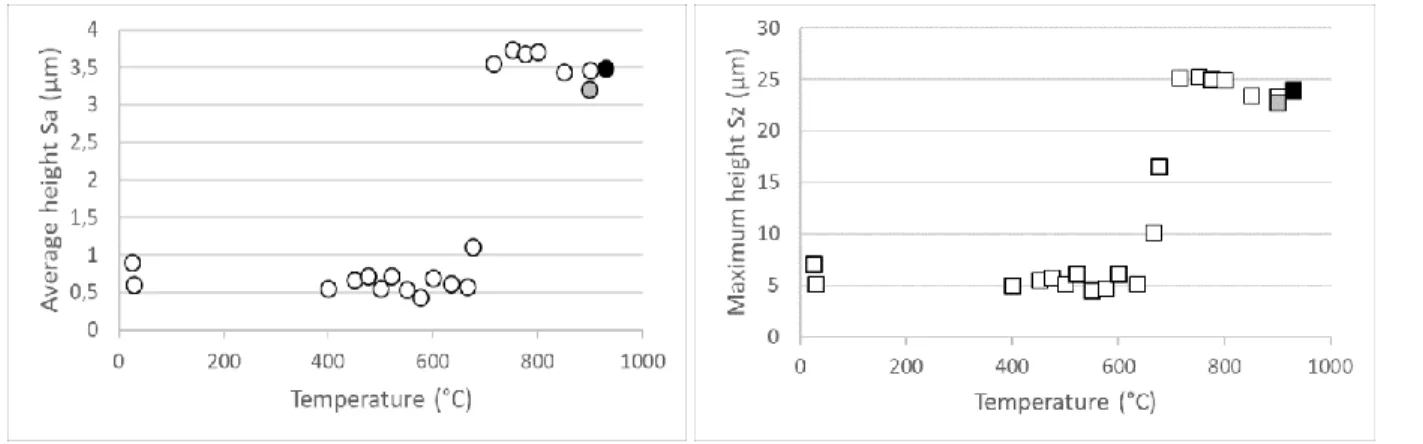
On the basis of the 3D reconstructions obtained for each temperature, the Sa and Sz parameters, which characterize the surface roughness, were calculated. They are reported in Figures 3a and 3b. The variations of these parameters with temperature remain very slight between room temperature and 665°C. Then, they increase up to 750°C. This highlights the effect of chemical reactions occurring
between the deposited layer and the substrate on the surface roughness. From 750 to 900°C, a small but steady decrease in these parameters is observed. When continuing the heat treatment for 30 minutes at 900°C, the surface roughness decreases (see grey circle and grey square in figures 3a and 3b). Finally, after cooling the sample to room temperature, the values of these parameters slightly increase (these values are reported at T=930°C and represented by a black circle and a black square respectively for clarity). Although this variation remains limited, this indicates that differences in thermal expansion coefficients between the formed phases, or phase transformations occurring during sample cooling, can
10 lead to a change in surface roughness during cooling. This justifies the need to be able to determine directly at high temperature the 3D view of the sample surface, in order to avoid any artifacts that can be generated during cooling.
Figure 3. Variations of Sa (a) and Sz (b) parameters as a function of temperature, determined from 3D reconstructions at magnification 500X. The grey circle and the grey square are associated to the Sa and Sz values obtained after 30 minutes heat treatment at 900°C. The black circle and the black square are associated to the Sa and Sz values obtained after sample cooling at room temperature (these points are arbitrary reported at T=930°C for clarity).
These variations are closely related to local morphological changes that can be observed on 3D
reconstructions, but not systematically observed on 2D HT-ESEM images. No change can be observed up to 400°C. Between 400°C and 675°C, limited modifications are observed on 3D reconstructions, whose are difficult to observe on ESEM images. However, these transformations do not modify the values of the Sa and Sz parameters. In the temperature domain ranging between 675 and 715°C, topographic changes that are characterized by the formation of valleys and hills are associated with huge variations of the Sa and Sz parameter values. During the heat treatment between 715 and 900°C, the limited variations of the Sa and Sz parameters can be associated with local topographic transformations. They correspond to
11 the formation of new phases (Al-Fe binary and Al-Fe-Si ternary phases) that locally lead to transfers of matter and / or variations of the phase densities (Barreau et al., submitted).
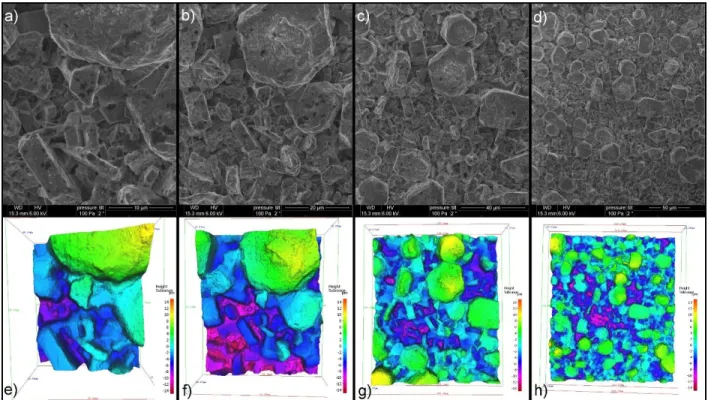
These local transformations can be highlighted by image processing of the 3D reconstructions obtained with series of tilted images recorded at higher magnification. 3D reconstructions (4e to 4h) obtained from images recorded at T=900°C at different magnifications, X4000 (4a), X2000 (4b), X1000 (4c) and X500 (4d), are shown in Figure 4. Similar reconstructions were obtained in the temperature range 800 - 900°C. The quality of these reconstructions is similar to the one obtained from X500 magnification images. This clearly shows the potential of this technique and really opens new opportunities for future works where the precise description of local sample surface modifications is required.
Figure 4. (a-d) High temperature (T=900°C) ESEM images (tilt angle =0°) and (e-h) corresponding 3D reconstructions recorded at different magnifications.
12 On the basis of these data, it is possible to work on very localized areas at the sample surface while heating. The images reported in Figure 5 show the evolution of the 3D morphology of a grain (called Grain 1) that has formed on the coating surface. The series of images (Fig. 5a) represents the evolution of the topography of Grain 1 as a function of temperature. Local variations of the sample morphology are clearly observable. To go to quantitative measurements, a line profile (Fig. 5b) is drawn along the 3D image series in order to plot profiles of Grain 1 at different temperatures (Fig. 5c). Associated differences between the profiles measured at a given temperature with the profile determined after the heat treatment are also reported in the form of dot lines (T - 900°C_end). The colors of the dot lines correspond to the color of the profile determined at temperature T. These profiles show that the morphology of the grain surface can change rapidly for relatively limited temperature variations (from 25°C to 50°C). For Grain 1, an increase of the size of the grain is first observed up to 850°C. Thus, the size of the grain decreases (at 900°C). These variations reflect the chemical reactions that are on progress and that lead to a continuous modification of the coating composition and morphology.
13 Figure 5. (a) 3D reconstructions obtained at different temperatures showing Grain 1 morphological modifications, (b) Zone where the profiles are measured and (c) Profiles determined at different
temperatures (lines) and associated differences between the profile determined at a given temperature and the profile determined at the end of the heat treatment (dot lines). NB. “900°C - end” means a 30 minutes heat treatment at 900°C.
14 Another way to use the 3D reconstructions is to focus more specifically on the volume variations of a particular area of the sample surface. In the present case, particular attention was paid onto Grain 1 and on a group of 5 grains. For each temperature, 7 different measurements of the volumes have been determined from the 3D reconstructions using the Mex software. Averaged values are reported on Fig. 6a and 6b. The standard deviations to the mean value are the error bars. The values of the standard deviation indicate that the volume measurement strongly depends on the reference plane that defines the base of the grain. Indeed, as the surface is not flat around the grain to be studied (see fig. 5), the drawing of the reference plane can vary with the way to draw the contour of the grain. Fig. 6a shows the evolution of the Grain 1 volume as a function of temperature. These data highlight that the variations are not regular in the 700 – 900°C temperature range, according to what has already been determined using Grain 1 profiles (Fig. 5c). A slight increase of the volume of the grain is observed first up to 850°C. Then, the volume of Grain 1 decreases when the sample heating is continued to 900°C. A limited volume decrease is also observed when the heat treatment at T=900°C is prolonged for 30 minutes (grey circles at T=900°C), while a slight volume increase is measured after sample cooling to room temperature (dark circles on Fig. 6a). These variations reflect the complex chemical processes involved in the coating elaboration. Similar measurements were performed on a group of 5 grains (Fig. 6b). The variations that have been obtained are significantly different, which further indicates the complexity of the phenomena involved in the development of the coating.
15 Figure 6. Variations of the volume of (a) Grain 1 and of (b) a group of 5 grains determined from the 3D reconstructions obtained at different temperatures. Error bars were determined from 7 different measurements performed at the zone. The grey circles are associated to the volumes obtained after 30 minutes heat treatment at 900°C. The black circles are associated to the volumes obtained after sample cooling at room temperature (these points are arbitrary reported at T=910°C for clarity).
These results clearly demonstrates that it is possible to observe directly 3D material surfaces at high temperature. The maximum magnification that was achieved in the present study is X4000. This is a relatively low magnification for a scanning electron microscope but the sample that was studied does not exhibit details at higher magnification. Regarding the image resolution on 3D reconstructions already reported from SEM images recorded at room temperature (Podor et al, 2019a), it is possible to go to much higher magnifications while keeping details on the images. Indeed, the quality of the 3D
reconstructions mainly depends on the initial quality of the SEM images. Thus, as it is possible to record images up to an X160000 magnification at high temperature (Nkou Bouala et al., 2015), it should be possible to observe the surface topography with a few nanometer lateral and height resolutions.
The 3D reconstruction of a sample surface requires the recording of tilted image series. This can be quite easily and rapidly achieved if the sample is at the eucentric position. However, working with a heating stage in the SEM chamber generally constrains a particular geometry and this prevents working under the ideal conditions. Thus, in the present work, we had to adjust manually the position of the sample at the center of the image while tilting the sample. This constraint is time consuming, limits the number of image series that can be recorded and requires recording images when no transformation is occurring at the sample surface. Particular SEM electronic column geometries (rocking beam mode proposed by Tescan Company (Tescan, 2016) or adapted in a Zeiss microscope (Mansour, 2016)) allow working with a
16 tilted beam. Then, it is possible to record very rapidly tilted image series (within a few seconds). Thus, coupling a high temperature stage to a SEM that offers this possibility will allow recording 3D image series of the sample surface with a fast time resolution at high temperature. Thus, live characterization of the surface transformations would be achieved and faster sample surface transformations would be described.
4. Conclusions
In this work, a new method for the measure of sample topography at high temperature is developed. This method is based on the use of an ESEM coupled with a new heating stage that allows recording tilted image series and further reconstruction of 3D sample surface images. Phase transformations that yield to topographic modifications of a coating during its elaboration at high temperature are observed. This experimental procedure can be used to characterize in situ many different processes occurring at high temperature. Among them, one can cite oxidation processes with the formation of oxides at the surface of metals or alloys, crystallization in glass-ceramics, crack opening during mechanical testing performed at high temperature… This procedure overcomes the limits of the conventional method that is generally used, i.e. sample cooling to room temperature before characterization. Indeed, in particular applications where molten phases can form at high temperature, cooling of the sample to room
temperature can result in important sample morphology transformations due to the solidification / crystallization of the liquid phase. This can strongly modify the sample surface and this does not allow describing accurately the surface of the sample as it was at high temperature.
The technique will be further improved by implementing the heating stage into a SEM that allows using the rocking beam mode and recording continuously tilted image series for live observation of the 3D transformations of the sample surface.
17
Acknowledgments
The authors would like to thank the Région Occitanie for the financial support through project Readynov “FurnaSEM” n°2017-005529-01.
References
ALICONA. https://www.alicona.com/en/products/mex/
BARREAU,M.,MÉTHIVIER,C.,ALLELY,C.,CREMEL,S.,DRILLET,P.,GRIGORIEVA,R.,NABI,B.,PODOR,R.,LAUTRU,J., HUMBLOT,V.,LANDOULSI,J.,STUREL,T.&CARRIER,X. (submitted). In situ surface imaging: High
temperature Environmental SEM study of the surface changes in morphology and structure during heat treatment of an Al-Si coated boron steel.
BROEKMAAT,J.,BRINKMAN,A.,BLANK,D.H.A.&RIJNDERS,G. (2008). High temperature surface imaging using atomic force microscopy. Appl Phys Lett 92, 043102.
CHANDRA,A.,NAKATANI,R.,UCHIYAMA,T.,SEINO,Y.,SATO,H.,KASAHARA,Y.,AZUMA,T.&HAYAKAWA,T.(2019). Direct in situ observation of the early‐stage disorder–order evolution of perpendicular lamellae in thermally annealed high‐χ block copolymer thin films. Adv Mater Interfaces 6(11), 1801401.
DIGITALSURF MOUNTAINS. https://www.digitalsurf.com/software-solutions/scanning-electron-microscopy/
Fan, D.W. & De Cooman, B.C. (2012). State-of-the-knowledge on coating systems for hot stamped parts.
Steel Res Int 83, 412–433.
GRIGORIEVA,R.,DRILLET,P.,MATAIGNE,J.M.&REDJAÏMIA,A. (2011). Phase transformations in the Al-Si
18 HOBBS,J.K.,FARRANCE,O.E.&KAILAS,L. (2009). How atomic force microscopy has contributed to our
understanding of polymer crystallization? Polymer 50, 4281–4292.
JENNER,F.,WALTER,M.E.,MOHAN IYENGAR,R.&HUGHES,R.(2010). Evolution of phases, microstructure, and surface roughness during heat treatment of aluminized low carbon steel. Metall Mat Trans A 41, 1554–1563.
JOACHIMI,W.,HEMMLEB,M.,GRAUEL,U.,WANG,Z.J.,WILLINGER,M.G.&MOLDOVAN,G. (2018). High temperature BSE and EBAC electronics for ESEM. Microsc Microanal 24(1), 694–695.
KARBASIAN,H.&TEKKAYA,A.E. (2010). A review on hot stamping. J Mater Process Technol 210, 2103–2118.
LI,D. (2015). in situ high temperature surface morphology using 3D profilometry
(https://nanovea.com/in-situ-morphology-at-high-temperature-using-3d-profilometry/)
LIANG,W.,TAO,W.,ZHU,B.&ZHANG,Y. (2017). Influence of heating parameters on properties of the Al-Si
coating applied to hot stamping, Sci China Technol Sci 60, 1088–1102.
MANSOUR,H.(2016). Caractérisation des défauts cristallins au MEB par canalisation d’électrons assistée
par diagrammes pseudo-Kikuchi haute résolution : application à l’acier IF, UO2 et TiAl. PhD thesis.
Université de Lorraine.
NEWTEC (2019). http://www.newtec.fr/fr/furnasem/
NKOU BOUALA,G.I.,CLAVIER,N.,LECHELLE,J.,MESBAH,A.,DACHEUX,N.&PODOR,R.(2015). In situ HT-ESEM study of crystallites growth within CeO2 microspheres. Ceram Int 41, 14703-14711
PODOR,R.,LE GOFF,X.,CORDARA,T.,ODORICO,M.,FAVRICHON,J.,CLAPAREDE,L.,SZENKNECT,S.&DACHEUX,N. (2019a). 3D-SEM height maps series to monitor materials corrosion and dissolution, Materials
19 PODOR,R.,NKOU BOUALA,G.I.,RAVAUX,J.,LAUTRU,J.&CLAVIER,N. (2019b). Working with the ESEM at high
temperature. Materials Characterization 151, 15-26.
PONZ,E.,LADAGA,J.L.&BONETTO,R.D. (2006). Measuring surface topography with scanning electron microscopy. I. EZEImage: a program to obtain 3D surface data. Microsc Microanal 12(2), 170-177. RIVLIN,V.G.&RAYNOR,G.V. (1981). Critical evaluation of constitution of aluminium-iron-silicon system. Int
Met Rev 26, 133–152.
ROOBOL,S.B.,CAÑAS-VENTURA,M.E.,BERGMAN,M., VAN SPRONSEN,M.A.,ONDERWAATER,W.G., VAN DER TUIJN,
P.C.,KOEHLER,R.,OFITSEROV,A., VAN BAARLE,G.J.C.&FRENKEN,J.W.M. (2015). The ReactorAFM: Non-contact atomic force microscope operating under high-pressure and high-temperature catalytic conditions. Rev Sci Instrum 86, 033706.
SHI,Q.,ROUX,S.,LATOURTE,F.,HILD,F,LOISNARD,D.,&BRYNAERT,N. (2018). Measuring topographies from
conventional SEM acquisitions, Ultramicroscopy 191, 18–33
SLÓWKO,W.,WIATROWSKI,A.&KRYSZTOF,M.(2018).Detection of secondary and backscattered electrons for 3D imaging with multi-detector method in VP/ESEM. Micron 104, 45-60.
TAFTI,A.P.,KIRKPATRICK,A.B.,ALAVI,Z.,OWEN,H.A.&YU,Z. (2015). Recent advances in 3D SEM surface reconstruction. Micron 78, 54–66.
TAFTI,A.P.,HOLZ,J.D.,BAGHAIE,A.,OWEN,H.A.,HE,M.M.&YU,Z. (2016). 3DSEM++: Adaptive and intelligent 3D SEM surface reconstruction. Micron 87, 33–45.
TESCAN (2016). https://www.azom.com/article.aspx?ArticleID=11694
WEILI,D.,YANXIN,Z.,HAOJIAN,L.,WENFENG,W.&YAJING,S. (2019). Automatic 3D reconstruction of SEM images based on Nano-robotic manipulation and epipolar plane images. Ultramicroscopy 200, 149– 159.