HAL Id: hal-02955586
https://hal.archives-ouvertes.fr/hal-02955586
Submitted on 9 Oct 2020
HAL is a multi-disciplinary open access
archive for the deposit and dissemination of
sci-entific research documents, whether they are
pub-lished or not. The documents may come from
teaching and research institutions in France or
abroad, or from public or private research centers.
L’archive ouverte pluridisciplinaire HAL, est
destinée au dépôt et à la diffusion de documents
scientifiques de niveau recherche, publiés ou non,
émanant des établissements d’enseignement et de
recherche français ou étrangers, des laboratoires
publics ou privés.
Climatic trends and interdecadal variability from
south-central Pacific coral records
Muriel Boiseau, Michael Ghil, Anne Juillet-Leclerc
To cite this version:
Muriel Boiseau, Michael Ghil, Anne Juillet-Leclerc. Climatic trends and interdecadal variability from
south-central Pacific coral records. Geophysical Research Letters, American Geophysical Union, 1999,
26 (18), pp.2881-2884. �10.1029/1999GL900595�. �hal-02955586�
Climatic trends and interdecadal variability from
Sou[h-Cenral
Pacific
coral records
Muriel Boiseu Michael Ghil
Depar•men• of A•mospheric Sciences and Institute of Geophysics and Planetary Physics, University of
California, Los Angeles, CA •00•5-1565.
Anne Juille-Leclerc
Labora•oire des Sciences du Clima• e• de l'Environnemen•, •1 Gif-sur- Yvette Cedex, France.
Abstract. We study climate variability over interdecadal
time scales
from 5•3C and 5•SO records,
measured
in a
Porites lutea coral core drilled in the Mootea lagoon. Pre-viously, we demonstrated
that the annual 5•SO variations
reflect those
in sea-surface
temperature
(SST), while the an-
nual 5•3C variations
record
primarily
cloud-cover
changes.
We apply two distinct spectral
analysis
methods
to the 5•3C
and 5•sO time series
from 1853
to 1989. Our analysis
of the
5•SO
record
shows
a secular
warming
trend and a 35-year
oscillation in temperatures over the last 137 years. A trend
and a 34-year cycle are also found in the 5•3C record. The
latter trend may be caused by either anthropogenic effectsor a cloud-cover
increase
in this region of the Pacific Ocean,
while the interdecadal oscillation appears to be related to changes in cloud cover, as well as in precipitation.1. Introduction
and Motivation
Tropical ocean-atmosphere interactions play a worldwide role in interannual chmate variabihty. These interactions undergo significant changes on decadal to centennial time scales. To follow and hence understand these longer-term changes, we have to extend the instrumental data with pa-
leochmatic records.
Stable-isotope records from corals have already been used to
study chmate variabihty in the equatorial [Cole et al., 1993;
Dunbar et al., 1994]
and southwest
Pacific
Ocean [Quinn et
al., 1993, 1998] on interannual
to centennial
time scales;
not
so for the central South Pacific. We have performed there-fore 5•So and 5•3C analyses
of a 165-cm
core from a mas-
sive head of Potires lutea, collected in the Moorea lagoon ofFrench Polynesia
(17ø30'S,
149ø50'W). Based on the result-
ing isotopic time series with a bimonthly resolution, Boiseauet al. [1998] studied the interannual climate variability in
the central South Pacific from 1852 to 1989, and demon-strated that the annual 6xsO variations
essentially
reflect
those
in SST, while the annual
6X3C
variations
record
those
in cloud cover.
Advanced spectral methods permit us to decompose
each
isotopic signal into three coherent types of variability: along-term trend, an interdecadal oscillation, and two in-
terannual modes associated
with the E1-Nifio/Southern-
Oscillation (ENSO) phenomenon. The latter modes were
Copyright ! 999 by the American Geophysical Union.
Paper number !999GL900595.
0094-8276/99/1999GL900595505.00
detected
and described
by Boiseau
et al. [1998]. In the
present paper, we study climatic variations in the central
South Pacific on interdecadal
to century time scales,
based
on the annual-mean 5xsO and 5x3C time series. The annual
means
are taken from July through June, and are nominally
referred to the second of the two years involved; thus 1910 indicates the average of July 1909 through June 1910.2. Isotopic Data and Spectral Methods
A colony of Porites lutea located off Moorea was drilled in
1990 [Boiseau
et al., 1998]. The analytical
methods
used to
obtain
the bimonthly
5•SO and 5•3C values
were
presented
in the earlier paper; the annual-mean time series studiedhere contain 137 yearly values
each, from 1853 through 1989.
Yiou et al. [1996] reviewed
a number of advanced
spec-
tral methods for the analysis of such short, noisy data sets.We chose
here the Multi-Taper Method (MTM) [Thomson,
1982]
and Singular-Spectrum
Analysis
(SSA) [Vautard
et al.,
1992],
applied
both to the annual
5XSO
and 5XSC
time series
by using
the SSA-MTM toolkit of Dettinger
et al. [1995].
MTM works by applying an optimized set of fixed-shape
tapers to our isotopic time series; we used 3 tapers and a bandwidth parameter value of 2. A discrete Fourier trans-
form is then applied to the sum of the tapered signals to
detect the sinusoidal
modes
contained
therein. SSA permits
us to separate each of our isotopic records into trend, os-cillations, and noise components
by diagonalizing
the time
series'
lag-covariance
matrix; the separation
is obtained by
projection onto this matrix's eigenvectors, which act as data-adaptive filters. The SSA window width used is 40 years,
which is broad enough to capture the interdecadal climaticvariations we are interested in here. Similar results are ob-
tained with windows of 30 and 50 years.
3. Long-Term Variations in the 5sO
Record
For this coral core, Boiseau
et al. [1998] demonstrated
that the annual 5•sO is not affected
by sampling
resolu-
tion, extension rate, or calcification processes. Hence the isotopic variations shown in Fig. la as a centered andnormalized
time series
reflect environmental
changes
in the
Moorea
lagoon.
The coral
5•SO
signal
depends
both on SST
variations and changes of the seawater isotopic composition(SXSOw•t•r).
On this time scale,
the 5xsOw=t•r
variations
are controlled by the evaporation-precipitation balance. Ourearlier study demonstrated that- for the 1958-1989 inter-
val, for which instrumental SSTs are quite reliable
the
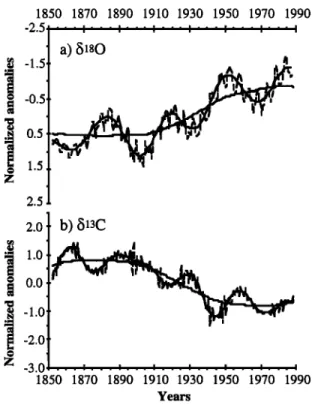
2882 BOISEAU ET AL.: CLIMATIC VARIABILITY FROM MOOREA CORAL RECORDS 1850 1870 1890 1910 1930 1950 1970 1990 -2.5 ß :' :' :' :' :' :' :' :' :' :' :' :' :' :
-0.5
0.5
1.5
2.5b)
513C
' A!i
t
il.O
.•
,,., /! ,t,t•
,. ;•,
• •/ ,,••', .,,,
,
,,
•1 It' V •1 II • I ' -•.0 . •. • . •. t. t. t. I. t. tf. t. t . t. t. I •50 •70 •0 •0 •0 •50 •70 •0 YearsFigure 1. (a) Profile
of 6•80 anomalies
vs. time (dashed)
and reconstruction of the trend (i.e., projection onto theleading eigenvector)
by SSA vs. time (solid), both from
1853 to 1989; negative
6•sO anomalies
correlate
with posi-
tive SST anomalies.
(b) Profile
of 6•aC anomalies
(dashed)
and reconstruction
of the trend (same
procedure
as for 6•80)
by SSA (solid);
positive
6•aC anomalies
correlate
with de-
creased precipitation and cloud cover.
year-to-year
variations
of 5x80 are dominated by those in
SST, rather than by hydrology. Assuming, as customary in
the interpretation
of proxy records
for the pre-instrumental
past, that this good
5XSO-SST
correlation
has not changed,
interannual
6x80 variations
permit us to study SST varia-
tions near Moopea
for the entire length of the 6xsO record.
We applied
MTM as well as SSA to the annual
6XSO
time
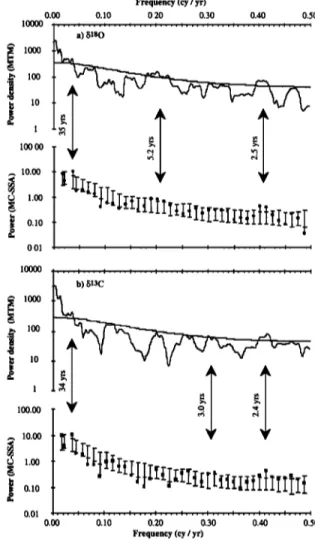
series. Both spectral methods extract three statistically sig-nificant types of variability: a trend, a 35-year oscillation,
and two interannual-variability
peaks (Fig. 2a). The latter
two peaks, at 2.5 and 5.2 years, are related to ENSO's quasi-
biennial and low-frequency
modes [Rasmusson
et al., 1990],
and were discussed
by Boiseau et al. [1998]. We focus here
on the long- term trend and the interdecadal variability. The SSA's pure-trend component contains a major part of
the variance (39%). This trend reflects a strong isotopic
depletion
in XSO
from 1853 to 1989 (see Fig. la). This
depletion
is not uniform over the last 137 years: the 5xsO
values stay fairly fiat from 1853 to 1910, while the coralskeleton
is depleted
rapidly in XSO
from 1911 to the end of
the 1940s; from 1950 through 1989, the isotopic values con-
tinue to decrease
at a very small rate (Fig. la). From the
raw annual
5xsO
record
(not shown
here), we calculate
that
the total XSO
depletion
over
the last 137 years
is of 0.26•oo.
According
to the 5XSO-SST
regression
slope
of Boiseau
et al.
[1998],
this depletion
corresponds
to a temperature
increase
of 1.2+0.4øC, which is slightly higher than obtained for thetropical Pacific Ocean by Smith et al. [1994], who statisti-
cally processed the sparse instrumental data. The nonuni-
form warming
trend deduced
at Moopea
from the 6XSO
data
shows fiat variations in temperature from 1853 to 1910, arapid warming from 1910 to 1950, and progressive cessa- tion of warming thereafter. Very similar changes in warm- ing trend have been observed on a global scale by Ghil and
Vautard [1991] and Mann and Park [1994].
The 35-year cycle contains 21% of the total variance in
the 5XSO
record. It is superimposed
on the trend in (Fig.
3a) and reveals
that the 5xsO minima (1882-1886,
1917-
1921, 1949-1954, and 1985-1989) correspond to substan-tial temperature maxima, while the isotopic maxima of the
interdecadal cycle (1861-1865, 1901-1905, 1932-1936, and
Frequency (cy / yr)
0.00 0.10 0.20 0.30 0.40 0.50 10000
aiil•) ...
lO m 1 lOO.OO 6 1.00i 0.10
tlI•
I
0.01 .... I .... I .... I .... I .... i .... I .... I .... I .... I .... I 10000• lOO0
g 10 1 100.00 ,-, 10.00 ;) 1.00 • 0.10 b) 813C 0.01 .. ,I .... , .... I .... , .... I .... I .... I .... I .... I .... I 0.0• 0.10 0.20 0.30 0.40 0.50Frequency (cy / yr)
Figure 2. Spectral analyses by multi-taper method
(MTM: upper plot) and singular- spectrum analysis
(SSA:
lower
plot) of (a) the 6xsO
record
and (b) the 6xaC
record.
In the MTM spectra, the heavy solid lines give the power spectrum of the time series, while the light solid lines rep- resent a 90% confidence interval with respect to a red-noise null hypothesis; in the SSA spectra, the confidence intervals are the 10% and 90% percentties of Monte-Carlo simulations of a red-noise process with the same lag-zero and lag- onecovariances as the time series. Components that fall within the confidence intervals are thus statistically indistinguish- able from red noise, whereas the red-noise null hypothesis can be rejected when eigenvalues stand above the bars.
1968-1971) are associated
with strong temperature
minima.
The 35-year oscillation has thus contributed to noticeably warmer and cooler multi-year spells in the central South Pacific Ocean over the last 137 years.
4. Long-Term Variations in 51C
The profile of the annual 6xaC anomalies
also exhibits a
nonuniform
trend over the last 137 years (Figs. lb and 3b).
This trend captures an even larger part of the variance than
for the 5•sO profile
(47% vs. 39%) and reflects
a strong
5•sC
depletion
from 1853
through
1989,
by 0.680/00.
From 1853
to 1890 the gradual changes
in 5xsC are weak, from 1890 to
the middle
of the 1960s
the decrease
in XSC
is strong
and
persistent, while from 1976 on, the coral skeleton becomes
slightly enriched
in xsC again.
Over the entire 1853-1989 interval, the total depletion of
$3C could have resulted from changes
in cloud-cover
pat-
terns or dissolved
inorganic carbon (DIC) in the seawater
[Swart et al., 1996]; it could also reflect anthropogenic
ef-
fects [Quinn et al., 1993]. Bolseau et al. [1998] reported
that an annual-mean cloud-cover increase diminishes the al-
gae's photosynthetic activity for that year; this in turn im-
plies
XSC
depletion
in the coral
skeleton
deposited
at Moopea
during the same year.
Cloud cover has only been recorded since the 1960s at Tahiti,
so we cannot
compare
its impact
on coral
5•aC variability
di-
rectly. Diaz et al. [1989]
and Dai et al. [1997], however,
de-
duced from adjacent land data a slight precipitation increase
1850 1870 1890 1910 1930 1950 1970 1990 -2.5 .... :--- :---:--- :---:--- :---:
a)
blaO
0.5=-
1.5
2.52.0 b) (•3C
1.0
0.0
-1.0
-2.0-3.0
...,...,...,...,...,...,..., 1850 1870 1890 1910 1930 1950 1970 1990 YearsFigure 3. SSA reconstruction
of the trend (light solid), in-
terdecadal
(heavy solid
line), and interannual
(dashed)
oscil-
lations
found
in (a) the 5s80 record
and (b) the 5xaC
record
over the 1853-1989 interval.
in the tropical Pacific since the beginning of this century; this correlates presumably with an increase in cloud cover. On the other hand, there is no upwelling in the Moopea la- goon that could modify seawater DIC. Finally, Quay et al.
[1994]
have
shown
that, from 1970
to 1994,
the 5XaC
of DIC
in the surface ..,waters of the Pacific Ocean as a whole has
decreased because of anthropogenic CO2 that is isotopically
enriched
in X2C.
Consequently,
we think that the coral
5XaC
trend at Moopea is mainly caused by increased cloud cover and anthropogenic impacts. The relative influence of these
two factors on the 5xaC signal cannot be distinguished
by
our current analytic methodology.
Both spectral methods also detect a coherent 34-year signal
in the an•nual
6•aC values
(Fig. 2b). This oscillatory
com-
ponent captures 12% of the total variance, somewhat lessthan for the 5xso record. The reconstructed interdecadal
oscillation
(Fig. 3b) exhibits
negative
5XaC
anomalies
be-
low the data-adaptive, nonuniform trend, for 1870- 1885,1910-1923, 1938-1951, and 1967-1984. Using a land-based annual precipitation index over the 1892-1990 interval, Diaz
et al. [1989] deduced
a slight rainfall increase
over the trop-
ical Pacific in the 1890s, from 1910 to 1922, 1930 to 1935,1942 to the end of the 1960s, and a stronger increase from
1970 on. Our 34-year oscillation
in 5xaC seems
therefore to
be related to precipitation patterns near Mootea.
5. Concluding remarks
We studied climate variability over the last 137 years in the south-central Pacific Ocean from coral 5x80 and 5XaC records. Our spectral analysis of the time series of the annual-mean isotopic values suggests that climate variabil- ity here manifests itseft as a nonuniform trend, on which interdecadal and interannual oscillations are superimposed.
The long-term
trend present
in the annual
5XSO
record
re-
flects overall warming, while the large negative excursions of the 35-year oscillation describe warm spells from 1882 to 1886, 1917 to 1921, at the beginning of the 1950s, and from 1985 on. It cannot be excluded, though, that the salinity changes besides those in temperature could have af- fected the 5xsO record. A trend contained in the annual
5xaC record appears
to be associated
with both cloud-cover
increase and anthropogenic perturbations, while the 34-year
cycle in 5xaC seems
related mainly to interdecadal
precipi-
tation variability.
The connection between precipitation changes and those in cloud cover at Moopea is not yet clear at this point. Bolseau
et al. [1998] showed
that the seasonal
cycles
of the two, av-
eraged over the last 30 years, are well correlated. On the other hand, the local interannual variabilities of these two meteorological parameters are poorly correlated in the in-
strumental
record at Tahiti [Rougepie
et al., 1985]. The in-
terdecadal
variability
in 5XSO
is also
poorly
correlated
with
that in 5xaC
at zero lag (not shown);
this suggests
that pos-
sible variations
in 5XSO-
poor precipitation
in the Moopea
lagoon,
as reflected
by the 5XaC
record,
did not affect sub-
stantially the dominant effect of SST on the 5xsO for this
time scale. On the other hand, the correlation between the
two isotopic
profiles
equals 0.71 when 5xaC leads 5xsO by
6-7 years. This strong lag correlation at about one quarter of the 34-35-year period suggests an oscillatory mechanism that has fleshwater fluxes in phase quadrature with SSTs.
2884 BOISEAU ET AL.: CLIMATIC VARIABILITY FROM MOOREA CORAL RECORDS
year and a 33-year peak in their cross-spectral analysis of
5XaC
and 5xsO,
while Dunbar
et al. [1994]
found
an 11-year
and a 33-year
cycle
from a coral 5XsO
record
at Urvina Bay
(Galapagos
Islands). The latter authors
related the 11-year
peak to solar-cycle changes in insolation. This interpreta- tion is controversial and, given the absence of this peak in the records of either Quinn et al. or our own, we shall not
dwell on it here.
The 15-year peak corresponds to a global peak detected by
Ghil and Vautard [1991]; its spatio-temporal
aspects
have
been described
luther by Mann and Park [1994] and Plaut
et al. [1995]. This 15-year peak seems,
given the record's
limited length, to be the harmonic of the 33-year one; it is not clear why its amplitude is too small for significant de-
tection at Moorea. Cook et al. [1995] also found a 31-year
peak in 2290 years of Tasmanian tree-ring data. Thus a sta- ble, persistent oscillation with a period of 31-35 years seems to encompass the entire South Pacific for the last two mil- lennia, and be characterized by a phase quadrature between
SSTs and freshwater fluxes.
Acknowledgments. We thank F. Varadi and P. Yiou for
fruitful discussions, J.C. Duplessy and K. Jackson for a critical reading of the manuscript, and A. Robertson, R. Tailleux, and two anonymous reviewers for constructive comments. Our work was supported by the Soci•t• de Secours des Amis de la Science
and the IGPP Director's Laboratory Fund (M. B.), and by an NSF Special Creativity Award (M. G.). This is publication no.
5263 of UCLA's Institute of Geophysics and Planetary Physics.
References
Boiseau M., A. Juillet-Leclerc, P. Yiou, B. Salvat, P. Isdale, and M. Guillaume, Atmospheric and oceanic evidences of ENSO events in the south central Pacific Ocean from coral stable isotopic records over the last 137 years, Paleoceanography, 13, 671-685, 1998.
Cole, J. E., R. G. Fairbanks, and G. T. Shen, Recent variability in the Southern Oscillation: Isotopic results from a Tarawa Atoll coral, Science, 260, 1790-1793, 1993.
Cook, E. R., B. M. Buckley, and R. D. D'Arrigo, Interdecadal temperature oscillations in the Southern Hemisphere: Evi- dence from Tasmanian tree rings since 300 B.C., in Natural Climate Variability on Decade-to-Century Time Scales, edited by D. G. Martinson et aI., pp. 523-532, National Academy Press, Washington, D.C., 1995.
Dai, A., I. Y. Fung, and A.D. Del Genio, Surface observed global land precipitation variations during the 1900-1988, J. CIim., 10, 2943- 2962, 1997.
Dettinger, M.D., M. Ghil, C. M. Strong, W. Weibel, and P.
Yiou, Software expedites singular spectrum analysis of noisy
time series, Eos Trans. AGU, 76(2), 12, 14, 21, 1995 (Ver-
sion 3.1 available as freeware on the World Wide Web at
http://WWWo at mo s. ucla. ed u /tcd / ).
Diaz, H. F., R. S. Bradley, and J. K. Eischeid, Precipitation fluc- tuations over the global land areas since the late 1800's, J.
Geophys. Res., 96, 1195-1210, 1989.
Dunbar, R. B., G. M. Wellington, M. W. Colgan, and P. W. Glynn, Eastern Pacific sea surface temperature since 1600
A.D.: The 5xso record of climate variability in Galkpagos
corals, Paleoceanography, 9, 291-315, 1994.
Ghil M., and R. Vautard, Interdecadal oscillations and the warm- ing trend in global temperature time series, Nature, 350, 324- 327, 1991.
Mann, M. E., and J. Park, Global-scale modes of surface tem- perature variability on interannual to century time scales, J. Geophys. Res., 99, 25,819- 25,833, 1994.
Plaut, G., M. Ghil, and R. Vautard, Interannual and interdecadal variability in 335 years of Central England temperatures, Sci- ence, 268, 710-713, 1995.
Quay, P. D., B. Tillbrook, and C. S. Wong, Oceanic uptake of fossil fuel CO2:Carbon-13 evidence, Science, 256, 74-79, 1994. Quinn, T. M., and F. W. Taylor, T. J. Crowley, A 173 year stable isotope from a tropical South Pacific coral, Qua. Sci. Rev., 12, 407-418, 1993.
Quinn, T. M., T. J. Crowley, F. W. Taylor, C. Henin, P. Joan- not, and Y. Join, A multicentury stable isotope record from a New Caledonia coral: Interannual and decadal sea surface tem- perature variability in the Southwest Pacific since 1657 A.D.,
Paleoceanography, 13, 412-426, 1998.
Rasmusson, E. M., X. Wang, and C. F. Ropelewski, The biennial
component of ENSO variability, J. Mar. Syst., 1, 71-96, 1990. Rougerie, F., P. J. Vienney, and L. Marec, Les eaux cSti•res nord de Tahiti et leur contexte hydroclimatique, ORSTOM Tahiti, Notes et Documents Ocdanographie, 26, p. 26, 1985.
Smith, T. M., R. W. Reynolds, and C. F. Ropelewski, Optimal averaging of seasonal sea surface temperatures and associated
confidence intervals (1860- 1989), J. CIim., 7, 949-964, 1994.
Swart P. K., J. J. Leder, A.M. Szmant, and R. E. Dodge, The origin of variations in the isotopic record of scleractinian corals: II. Carbon, Geochim. Cosmochim. Acta, 60, 2871-2886, 1996. Thomson, D. J., Spectrum estimation and harmonic analysis,
Proc. IEEE, 9, 1055-1096, 1982.
Vautard, R., P. Yiou, and M. Ghil, SSA: A toolkit for short, noisy chaotic time series, Physica D, 58, 95-126, 1992.
Yiou, P., E. Baert, and M. F. Loutre, Spectral analysis of climate data, Surv. Geophys., 17, 619-663, 1996.
M. Boiseau and M. Ghil, Department of Atmospheric Sci- ences and Institute of Geophysics and Planetary Physics, Uni-
versity of California, Los Angeles, CA 90095-1565. (e-mail: g hil@clo ud. at mos. ucla. ed u)
A. Juillet-Leclerc, Laboratoire des Sciences du Climat et de l'Environnement, 91 Gif-sur-Yvette Cedex, France.
(Received February 5, 1999; revised May 17, 1999; accepted May 28, 1999.)