Developing System-Based Leading Indicators for Proactive Risk Management in theMASACH ARCHS NSrUES Chemical Processing Industry
by
Ibrahim A. Khawaji
MASSACHUSETTS INS
C 2 I
2E2
?I-FE
B.S., Chemical Engineering, Colorado School of Mines, 2001SUBMITTED TO THE ENGINEERING SYSTEMS DIVISION IN PARTIAL FULFILLMENT OF THE REQUIREMENTS FOR THE DEGREE OF
MASTER OF SCIENCE IN ENGINEERING SYSTEMS
AT THE
MASSACHUSETTS INSTITUTE OF TECHNOLOGY JUNE 2012
0 2012 Massachusetts Institute of Technology. All rights reserved.
Signature of Author: E
Engineering Systems Division May 4, 2012 Certified by:
Accepted by:
Nancy G. Leveson
Profe f Aeronautics and Astronautics and Engineering Systems
Thesis Supervisor
Olivier de Weck Associate Professor of Aeronautics and Astronautics and Engineering Systems Chair, ESD Education Committee
Developing System-Based Leading Indicators for Proactive Risk Management in the Chemical Processing Industry
by
Ibrahim A. Khawaji
Submitted to the Engineering Systems Division on May 4th, 2012 in Partial Fulfillment of the
Requirements for the Degree of Master of Science in Engineering Systems
ABSTRACT
The chemical processing industry has faced challenges with achieving improvements in safety performance, and accidents continue to occur. When accidents occur, they usually have a confluence of multiple factors, suggesting that there are underlying complex systemic problems. Moreover, accident investigations often reveal that accidents were preventable and that many of the problems were known prior to those accidents, suggesting that there may have been early warning signs.
System-based analysis addresses systemic aspects and leading indicators enable the detection of ineffective controls and degradation of the system. Together, they could enable taking needed actions before an incident or a loss event. To develop process safety indicators, the chemical processing industry currently uses guidelines that are mainly based on the concepts of the "Swiss Cheese Model" and the "Accident Pyramid." The current guidelines lack a systemic approach for developing process safety indicators; the guidelines view indicators as independent measures of the safety of a system (e.g. a failure of a barrier), which can be misleading because it would not identify ineffective controls, such as those associated with the migration of the system towards an unsafe state, or associated with interdependencies between barriers. Moreover, process safety indicators that are currently used in the chemical industry are more focused on lagging as opposed to leading indicators.
This main objective of this thesis is to develop a structured system-based method that can assist a hydrocarbon/chemical processing organization in developing system-based process safety leading indicators. Building on developed safety control structures and the associated safety constraints, the proposed method can be used to develop both technical and organizational leading indicators based on the controls, feedbacks, and process models, which, ultimately, can ensure that there is an effective control structure.
Thesis Supervisor: Nancy G. Leveson
ACKNOWLEDGEMENTS
I would like to express my sincere appreciation to Professor Leveson first for believing in me
and for believing that I could contribute to her research group. Working with her has been an inspiration and I am very blessed that I got the opportunity to work with such world-known expert in system safety that continuously works at the forefront of the field and continuously challenges the forefront for more breakthroughs and more innovative ways to make the world a safer place. During my time here, I have had a complete paradigm shift in my understanding of system safety. Many thanks go to Professor Leveson for her open-mind attitude, continued guidance and support, inspiration to join the "system thinkers club," and more importantly for the opportunity given to me to be here.
I wish also to express my sincere utmost thanks Professor de Weck. He has certainly inspired
me into the Engineering Systems world. His remarkable knowledge, enthusiastic attitude, and willingness to share were incredible. To all of the Complex Systems Research Lab (CSRL) team members, without exception, being around you has been a critical part of my learning experience at MIT. I have learned so much from you and I am delighted to have had the opportunity to work with such highly talented and intelligent team that has diverse background. This has certainly broadened my knowledge by learning from you about other industries: food, nuclear, software, aero/astro, automotive, medical/healthcare, financial, etc.
To my dad and mom, I hope that I can make you proud, and thanks for encouraging me throughout, for your immense support, and for the ever-lasting love. To my wife, without your incredible support, I would not have made it through MIT. I am forever grateful for your patience with my long hours studying and extended time outside home. I could not have done this without you. To my kids, Abdullah, Danyah, Rana, and Laura you being around is a blessing and has made a difference, and I wish that you achieve more than this in your future. To all my sisters and brothers, you made me who I am today.
I would also like to thank Anwar Haque, Abdullah Al-Ghamdi, William Kochinski, and Hameed
Kassem (my managers and mentors at Saudi Aramco) who continue to believe in me and continue to give me all the support I need.
TABLE OF CONTENTS
A B S T R A C T ... 3
ACKNOW LEDGEM ENTS...5
TABLE OF CONTENTS ... 7 LIST OF FIGURES ... 9 LIST OF TABLES ... 10 LIST OF ACRONYM S...11 1.0 INTRODUCTION ... 13 1.1 THE PROBLEM 13 1.2 BACKGROUND: TECHNIQUES CURRENTLY USED 14 1.3 RESEARCH GOAL AND HYPOTHESIS: WHAT SHOULD BE DONE DIFFERENTLY? 15 1.4 RESEARCH APPROACH 15 2.0 BACKGROUND AND LITERATURE REVIEW ... 16
2.1 SYSTEMS THEORY 16 2.1.1 Chemical Processes as Complex Engineering and Socio-Technical Systems ... 16
2.1.2 Systems Safety and Safety as a Control Problem ... 17
2.1.3 Control and Plant States... 18
2.2 LEADING INDICATORS 21 2.3 TECHNIQUES CURRENTLY USED FOR DEVELOPING LEADING INDICATORS 23 2.3.1 UK HSE Guidance for Developing Process Safety Indicators; HSG254 (2006)...24
2.3.2 OECD Guidance on Developing Safety Performance Indicators (2008)... 25
2.3.3 Center of Chemical Process Safety Guidance... 26
2.3.4 API 754 "Process Safety Performance Indicators" (2010) ... 27
2.3.5 Shortcomings and Summary ... 28
3.0 SYSTEM S M ODELING AND LEADING INDICATORS... 31
3.1 ACCIDENT MODELS AND LEADING INDICATORS 31 3.1.1 Approaches to Accident M odels ... 31
3.1.2 Introduction to STAM P ... 32
3.1.3 Safety Control and Leading Indicators ... 33
3.2 ADDRESSING THE SYSTEM DYNAMICS 34 3.2.1 Introduction to System Dynamics... 34
3.2.2 Incorporating the System Dynamics ... 35
3 .2 .3 F eedb ack L oop s ... 36
3.3 ACCIDENTS AND INEFFECTIVE CONTROL - CASE STUDY 40 3.3.1 Description of the System ... 40
3.3.2 System Hazards, Safety Constraints, and Risk Control ... 41
3 .3 .3 C ontrol Structure...4 2 4.0 SYSTEM -BASED M ETHOD ... 48
4.1 OBJECTIVES 48 4.2 DEVELOPING A SYSTEM-BASED METHOD 50 4.2.1 Leading Indicators Goals ... 50
4.2.2 Achieving the Goals - Leading Indicators Development Process ... 51 4 .2 .3 P roposed M ethod ... 54 4.2.4 Description of the Method ... 57
4.3 APPLYING THE METHOD -EXAMPLE 60
5.0 SUMMARY, FUTURE RESEARCH, AND CONCLUSION... 67
5.1 SUMMARY 67
5.2 LIMITATIONS AND FUTURE RESEARCH 68
5.3 CONCLUSION 69
6.0 D E F IN IT IO N S ... 7 1 APPENDIX A - ACCIDENTS AND INEFFECTIVE CONTROL ... 73 R E F E R E N C E S ... 7 8
LIST OF FIGURES
Figure 2.1: Traditional Risk Reduction Principle ... 18
Figure 2.2: Systems View of Controls to Reduce Risk ... 19
Figure 2.3: Risk Reduction Impact ... 19
Figure 2.4: Plant States: Modes of Operation and Control... 20
Figure 2.5: Loss of Control Snapshot ... 21
Figure 2.6: Timeline for Developed Process Safety Performance Indicators Guidance used in the P rocess In du stry ... 24
Figure 2.7: James T. Reason's "Swiss Cheese Model" and Christopher A. Hart's "Spinning D isk s M od el".. ... 2 8 Figure 2.8: H.W. Heinrich's "Accident Pyramid"... 29
Figure 3.1: Generic STAMP Control Structure ... 33
Figure 3.2: System D ynam ics Loops... 37
Figure 3.3: System D ynam ics M odel... 38
Figure 3.4: Raffinate Splitter and the Blowdown Drum... 40
Figure 3.5: Simple Control Structure; Controller: Operator... 43
Figure 3.6: BP Texas City Incident - Ineffective Control... 47
Figure 4.1: Process for Ensuring Effective Control... 52
Figure 4.2: Leading Indicators Development Process (Engine)... 52
Figure 4.3: Leading Indicators Development Method... 56
Figure 4.4: Typical Separation Unit... 60
Figure 4.5: Separation Unit Control Loop and Causal Factors of Inadequate Control... 61
Figure 4.6: Developing Leading Indicators for the Separation Unit ... 63
Figure Al: Simple Control Structure; Controller: Maintenance and Inspection Staff ... 73
Figure A2: Simple Control Structure; Controller: Engineering Staff... 75
LIST OF TABLES
Table 2.1: Summary of the Guidelines for Developing Process Safety Indicators ... 30
Table 3.1: Mapping Safety Constraints to System Components ... 41
Table 3.2: Physical Controls for the Blowdown Drum... 42
Table 3.3: Inadequate Control: Operator ... 43
Table 3.4: BP Texas City case study- Examples of ineffective controls that existed prior to the in cid en t... 4 4 Table 4.1: Goals for Leading Indicators ... 49
Table 4.2: Summary of how the goals for leading indicators can be achieved using the leading indicators development process "engine... 53
Table 4.3: Leading Indicators for the Separation Unit ... 64
Table 4.4: Additional Leading Indicators for Monitoring Progress at the Facility Level ... 66
Table Al: Inadequate Control: Maintenance and Inspection Staff... 74
Table A2: Inadequate Control: Engineering Staff ... 75
LIST OF ACRONYMS
AICHE: American Institute of Chemical Engineers
API: American Petroleum Institute
BLEVE: Boiling Liquid Expanding Vapor Explosion
CCPS: Center of Chemical Process Safety EPA: Environmental Protection Agency HSE: Health and Safety Executive
LPG: Liquefied Petroleum Gas
LOC: Loss of Containment
LOD: Lines of Defense
NFPA: National Fire Protection Agency
NIOSH: National Institute of Occupational Safety and Health
NPRA: National Petroleum Refiners Association
OECD: Organization for Economic Coordination and Development OSHA: Occupational Safety and Health Administration
PRV: Pressure Relief Valve PSM: Process Safety Management RMP: Risk Management Plan
STAMP: Systems Theoretic Accident Model and Processes
STPA: STAMP Based Process Hazard Analysis VCE: Vapor Cloud Explosion
1.0 INTRODUCTION
The chemical processing industry has changed considerably over the past several decades, and has become more advanced and complex. Technology has focused on safer designs, companies have established operating procedures and safety management systems, and best practices are being shared between companies. To further enable and make standards and procedures more effective, companies have attempted to tackle cultural norms in an effort to promote healthier
safety cultures, and, thus, improve safety performance. However, companies continue to
struggle with achieving improvements in safety performance, and accidents continue to occur.
When accidents occur, they usually have a confluence of multiple factors, suggesting that there are underlying complex systemic problems. Moreover, accident investigations often reveal that accidents were preventable and that many of the problems were known prior to those accidents, suggesting that there may have been early warning signs.
System-based analysis addresses systemic aspects and process safety indicators enable the detection of ineffective controls and degradation of the system. Together, they could enable taking needed actions before an incident or a loss of containment event happens in a complex system. It is vital that process safety indicators focus on leading indicators rather than lagging
ones. Lagging indicators measure incidents after they occur, while leading indicators are
proactive and forward looking measures that can identify performance degradation or deterioration of the system prior to an incident. These indicators go hand-in-hand. However, this research is focused on leading indicators that enable proactive risk management. This Chapter discusses the problem, current techniques that are used, and what is proposed to be done differently to improve the process.
1.1 THE PROBLEM
Process safety indicators that are currently used in the chemical processing industry are more focused on lagging as opposed to leading indicators. There have been attempts in the industry to develop leading indicators, but these efforts have fallen short of addressing the systemic aspects that can enable the possibility of predicting potential incidents before they occur or detecting the
migration of a system to an unsafe state. Most companies have established risk management programs that are either reactive (lack a forward-looking approach), or fragmented (system-based models are not used). A risk management program and the associated decision-making can only be effective if it considers the system as a whole and its dynamics, and if it is proactive enough to enable early actions.
1.2 BACKGROUND: TECHNIQUES CURRENTLY USED
To develop process safety indicators, the chemical processing industry currently uses guidelines provided by government regulators or professional organizations such as the UK HSE, OECD, API and CCPS. These guidelines are mainly based on the concepts of the "Swiss Cheese Model" by James T. Reason and the "Accident Pyramid" by H. W. Heinrich. The current guidelines used by the industry lack a systemic approach for developing process safety indicators; the guidelines view indicators as independent measures of the safety of a system (e.g. a failure of a barrier), which can be misleading because it would not identify ineffective controls, such as those associated with the migration of the system towards an unsafe state, or associated with interdependencies between barriers.
There have been several attempts in the process industry to improve the way process safety leading indicators are developed to monitor and improve safety performance. Recently, the process industry collectively began to place a significant focus on process safety indicators, and redefined how indicators should be developed by issuing a series of guidelines. These guidelines lack the systems approach, particularly involving the following aspects:
e They lack a structured systematic framework that can systemically facilitate obtaining
feedback on the state of the system during the different phases of the lifecycle or during the different states of operations.
" Although the new guidelines have clarified the differences between personal versus
process safety indicators, as well as leading versus lagging indicators, there are still vague definitions of their application.
e Organizational aspects are covered by some of the guidelines, but not in a systematic
* Current guidelines rely on hazard identification techniques that consider only linear chains of events.
e The guidelines do not provide a framework for monitoring the performance of the system
as a whole. They provide significant focus on individual indicators versus aggregate ones.
In summary, these guidelines do not provide a structured mechanism for developing process safety indicators that can proactively detect system performance degradation.
1.3 RESEARCH GOAL AND HYPOTHESIS: WHAT SHOULD BE DONE DIFFERENTLY?
The primary aim of this research thesis is to answer the following question: "How can a
hydrocarbon/chemical processing organization develop system-based process safety leading indicators for the purpose of systematically and proactively managing risk?"
The objective of this research is to develop a method that can assist managers and decision-makers in proactively managing risk in their organizations by identifying better means for developing leading indicators that can monitor systemic factors and, thus, prevent incidents before they occur. A more systematic review that would enable a better understanding of the system, as well as the complex interactions within its subsystems, and external factors is needed to provide better risk management. The hypothesis used in this research is that STAMP-based
modeling concepts can be used to achieve this objective. This provides for a better
understanding of the system, helps in identifying better means for developing leading indicators, assists in monitoring a system's status, and, thus, helps in making timely informed decisions to prevent accidents from occurring or to identify needs for safety improvements.
1.4 RESEARCH APPROACH
In order to answer the research question, this research involves reviewing the literature and current practices, defining gaps particularly in the use of a systems approach for developing leading indicators in the process industry, exploring means for building on safety control structures, and developing a system-based method that can be used to develop leading indicators to proactively manage risk.
2.0 BACKGROUND AND LITERATURE REVIEW
This Chapter provides background information on some of the essential concepts that are related
to systems theory, systems safety, and leading indicators. The latter part of the Chapter
summarizes the findings from a literature review, which include descriptions of the current state of the techniques used, their new contributions, and their shortcomings particularly as they relate to the systems approach.
2.1 SYSTEMS THEORY
Systems theory is the "interdisciplinary study of systems in general, with the goal of elucidating principles that can be applied to all types of systems at all nesting levels in all fields of research [1]." Booton and Ramo defined systems engineering as the design of the whole rather than the individual parts. They state that the "systems engineer harmonizes optimally an ensemble of subsystems and components [2]."
Systems theory is based on non-linear events and dynamics as well as feedback or feed-forward
control. It also includes cognitive, psychological, organizational, and social aspects. The
systems approach involves defining goals, formulating the problem, developing objectives, developing alternatives, and selecting the best alternatives [3]. The concepts of systems theory and the implementation of systems engineering date back to the mid-1900s, with major applications of the associated concepts during the development of railroad systems and telephone systems, as well as applications in World War II [2].
2.1.1 Chemical Processes as Complex Engineering and Socio-Technical Systems
Leveson states that, "while abstractions and simplifications are useful in dealing with complex systems and problems, those that are counter to reality can hinder us from making forward progress [4]." Complex systems are different from traditional systems in that they involve a high level of automation, social aspects, and complex internal and external interactions. System engineering concepts based on reductionism, like those developed in earlier times, may not be appropriate for complex systems. This is due to the intersection of natural science and human
social systems, as was recognized by Bertalanffy in the General Systems Theory [5]. C. Perrow
has described some attributes of socio-technical complex systems [6]:
e Large problem space * Dynamic properties
* Social interaction * Hazards in operations
* Heterogeneous perspectives * Automation
* Distributed nature * Uncertainty in the data
These attributes apply equally well to processing facilities in the chemical processing industry.
2.1.2 Systems Safety and Safety as a Control Problem
Checkland suggested that "systems thinking is founded upon two pairs of ideas, those of emergence and hierarchy, and communication and control [7]." Leveson also suggested that safety is an emergent system property and that safety should be treated as a control problem for complex systems [8]. Systems safety concepts extends to addressing complex interactions, and in complex systems, according to Leveson, analyzing the system can not only prevent similar accidents, but also other types of future accidents by evaluating dysfunctional interactions between system components [4]. Investigations of catastrophic incidents such as Longford, Piper Alpha, and BP Texas City have identified multiple systemic flaws and common safety culture weaknesses. "Process safety' incidents are rarely caused by a single catastrophic failure, but rather by multiple events or failures that coincide and collectively result in an incident [9]." Risk management efforts should not only focus on addressing previous accidents, because different interactions of the system and the social aspects may result in unforeseen inadequate control.
The term "process safety" is used more widely than "system safety" in the chemical process industry. The process safety concept probably began in the early 19th century in a du Pont black powder plant [10]. However, this was a self-regulated effort on the part of du Pont, and regulations of the chemical process industry most likely began to be formalized following the 1974 Flixborough disaster. Since then, process safety technology has advanced and loss prevention principles have been formulated in an effort to prevent loss of containment of hazardous material. In the 1980s, the industry recognized that technology alone would not result in process safety improvements and that there is a need for process safety management. "The evolution of process safety from a purely technical issue to one that demanded management approaches was essential to continued process safety improvement [11]." Process safety has been addressed through prescriptive and performance based regulations. Regulations in the chemical processing industry vary from country to country and they are often a combination of prescriptive and performance-based regulations. In the U.S., regulations are largely prescriptive and partly performance-based with the introduction of OSHA's Process Safety Management (PSM) requirements in 1991 [12].
2.1.3 Control and Plant States
The traditional view of risk control or risk reduction strategies are based on a linear view of the barriers that are in place [13]. This begins with a certain risk level and layers of protection are
added to reduce the level of risk, as seen in Figure 2.1.
Figure 2.1: Traditional Risk Reduction Principle (Adopted from IEC 61508 [14])
This traditional view relies heavily on the chain of events model. However, a systems view of
risk reduction requires treating safety as a control problem. Controls can be physical,
Positive Control: Social
I Positive Control: Organizational Inadequate Control: Organizational
0 U 0
U,
Positive Control: Physical
Figure 2.2: Systems View of Controls to Reduce Risk
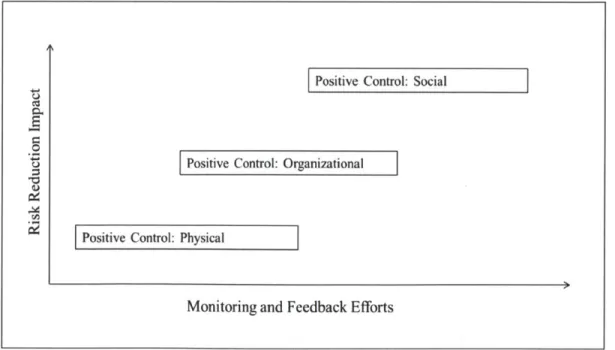
Such controls can have varying degrees of impact on risk reduction. It can be argued that addressing systemic aspects can have a greater effect on risk reduction, while addressing specific physical or component failures may not be as effective. These effects on risk reduction are demonstrated in Figure 2.3.
Figure 2.3: Risk Reduction Impact
C.)
*0
I
Positive Control: Social8
0Positive Control: Organizational
Positive Control: Physical
Monitoring and Feedback Efforts
IInadequate Control: Social
Inadequate Control: Physical
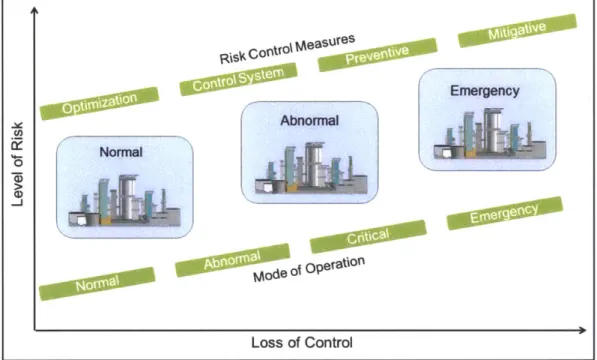
Accidents occur due to ineffective controls, including those that gradually develop over time and involve the combinations of smaller failures caused by people and failures of the physical
equipment [15]. Processing plants gradually change their states from normal to emergency
modes of operations, as illustrated in Figure 2.4.
contro measure Is Emergency Abnormal R Normal Modeo Of rt~f Loss of Control
Figure 2.4: Plant States: Modes of Operation and Control
It can begin to drift from normal operations and, if no controls are in place, it will begin drifting towards abnormal operations, subsequently followed by critical operations and, finally, an emergency situation where loss of containment hazards can occur. Safety controls prevent a system from moving towards an abnormal state. Moreover, controls can bring the system back to normal operations, which can vary depending on the state of the plant, from mitigation, prevention, control, or optimization.
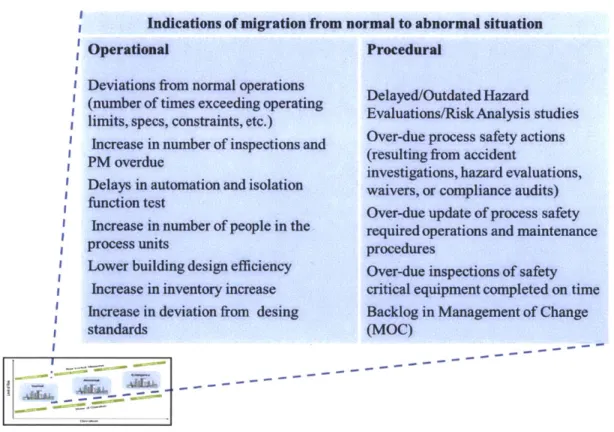
Even for incidents that occur outside the chemical processing domain, socio-technical complex systems involved in major accidents often have similar causes associated with inadequate
emergency modes of operations, ineffective controls can be found through the use of leading
indicators. An example is shown in Figure 2.5.
Indications of migration from normal to abnormal situation Operational
Deviations from normal operations (number of times exceeding operating limits, specs, constraints, etc.)
Increase in number of inspections and PM overdue
Delays in automation and isolation function test
Increase in number of people in the process units
Lower building design efficiency Increase in inventory increase Increase in deviation from desing standards
Procedural
Delayed/Outdated Hazard Evaluations/Risk Analysis studies Over-due process safety actions (resulting from accident
investigations, hazard evaluations, waivers, or compliance audits) Over-due update of process safety required operations and maintenance procedures
Over-due inspections of safety critical equipment completed on time Backlog in Management of Change (MOC)
Figure 2.5: Loss of Control Snapshot
2.2 LEADING INDICATORS
Leading indicators are "something that provides information that helps the user respond to changing circumstances and take actions to achieve desired outcomes or avoid unwanted outcomes [16]. "
According to Hollnagel and Woods, "in order to be in control it is necessary to know what has happened (the past), what happens (the present) and what may happen (the future), as well as knowing what to do and having the required resources to do it [17]." There are different definitions for leading indicators that can be found in literature. Some definitions overlap with each other. In general, leading indicators can be referred to as measures that can be used to predict future performance. Kjellen defined them as "indicators that change before the actual risk level has changed or signs of changing vulnerabilities [18]." Building on this definition,
leading indicators will be defined for the purposes of this research, as measures that detect ineffective control well before the risk level increases. Moreover, the terms "metric" and "indicator" have been used interchangeably in many cases. This research thesis will use the term "metric" for the process of how an indicator is developed, and the term "indicator" for what needs to be measured.
The objective of developing leading indicators is to enable detecting ineffective controls early enough before an accident occurs. This requires implementing a set of performance goals, so that safety performance can be measured, monitored, and analyzed and corrective actions can be taken. This can be achieved by instituting a program for process safety indicators with its associated processes, conducting reviews periodically, evaluating and applying the required process adjustments and corrective actions. Leading indicators should be developed part of a continuous improvement program that has a component relating to developing and monitoring leading indicators.
2.3 TECHNIQUES CURRENTLY USED FOR DEVELOPING LEADING INDICATORS
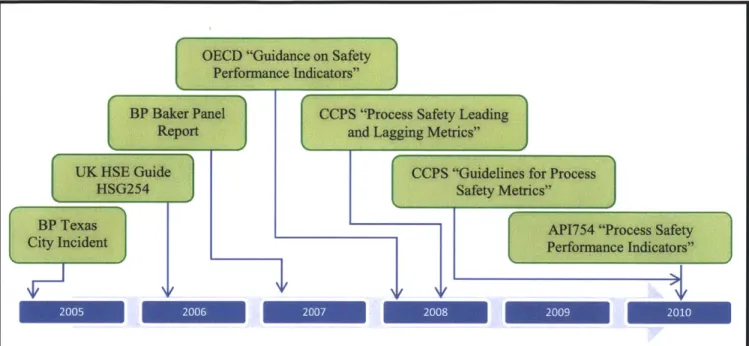
Historically, there have been several attempts in the process industry to use process safety indicators to monitor and improve safety performance. Early attempts to develop process safety metrics guidance by the CCPS go back to the mid-1990's with the subsequent release of software tools for performance measurements. In 2000, the BP Grangemouth Major Incident Investigation report recommended that "companies should develop key performance indicators for major hazards and ensure that process safety performance is monitored [19]." That report highlighted key questions regarding the need for performance indicators for safety culture, leadership, employee participation, as well as more specific processes such as management of change. It also suggested that industries may have a false sense of safety performance due to their focus on managing personal safety rates rather than process safety.
In 2003, the Working Group on Chemical Accidents (WGCA), chaired by the U.S. EPA, has introduced "Guidance on Developing Safety Performance Indicators [20]." This was developed
by using the best practices implemented by different organizations. This document was classified as an interim guidance report so that it could be tested in pilot programs. However, industry implementation of these recommendations and the associated guidelines was limited to some extent.
Only after the BP Texas City incident in 2005 did the process industry for the first time collectively begin to place a significant focus on process safety indicators and subsequently redefine how indicators should be developed. The Baker Panel Report recommended that "BP should develop, implement, maintain, and periodically update an integrated set of leading and lagging performance indicators for more effectively monitoring the process safety performance [21]." The U.S. Chemical Safety and Hazard Investigation Board (CSB) issued a recommendation to develop "performance indicators for process safety in the refinery and petrochemical industries to ensure that the standard identifies leading and lagging indicators for nationwide public reporting as well as indicators for use at individual facilities, which should include methods for the development and use of the performance indicators [22]."
A series of documents and guidelines have been issued since then. The following timeline (in
Figure 2.6) shows the release of key guidance documents that should pave the way forward for the implementation of process safety indicators and should influence their application in the process industry.
Figure 2.6: Timeline for Developed Process Safety Performance Indicators Guidance used in the Process Industry
To develop leading process safety indicators, the process industry currently uses guidelines primarily provided by UK HSE, OECD, API and CCPS. The following sections discuss some of the key documents used by the process industry, and provide some background information on the basis of these documents, their new contributions to the process industry, as well as the areas that they did not address.
2.3.1 UK HSE Guidance for Developing Process Safety Indicators; HSG254 (2006)
These guidelines were developed by the UK HSE and the Chemical Industries Association (CIA) in collaboration with the process industry [23]. It outlines a six-stage process: establish a team; develop the scope; identify risk controls; identify controls critical elements; collect data; and review the results.
'v-J
-2008 2009 2010
The guidelines recommend starting by identifying "what can go wrong?" using traditional hazard identification techniques, followed by defining each Risk Control System (RCS) that control each of these hazards. In this document, each RCS represents a barrier based on the "Swiss-Cheese" model, which, if it fails, can give rise to an accident. Leading indicators are developed based on the barriers' failures, i.e., "holes" that are discovered during reviews, while lagging indicators are developed based on "holes" that are discovered after an incident or near-miss occurring.
The main new contribution of this document was its focus on leading indicators. Although limited to some extent, it suggests using these indicators to provide early warnings against deterioration or degradation. Another key addition was introducing the "dual assurance" concept of leading and lagging indicators to ensure that safety controls were functioning as expected. It also introduced the concept of using a hierarchical approach, where lower level indicators would feed into higher level indicators in an organization with an emphasis on senior management involvement. The suggested hierarchal approach is limited to communicating information from an individual site level to higher levels in the organization using more generic indicators. They suggest that this can be achieved through indexing and weighting low level indicators into higher level indicators based on the importance of an individual site in the overall organization.
2.3.2 OECD Guidance on Developing Safety Performance Indicators (2008)
These guidelines were developed by the Environment, Health and Safety (EHS) Division of the
OECD in collaboration with the process industry [24]. It outlines a seven-stage process: establish a team; identify key issues of concern; define lagging indicators; define leading indicators; identify risk controls; identify controls critical elements; collect data and report results; act on findings; and review performance and indicators. Unlike the UK HSE's document, it provided more guidance on developing leading and lagging indicators. It also distinguishes 'act on recommendations' as a separate step.
The guidelines recommend starting by identifying critical potential hazards using, for example, Process Hazard Analysis (PHA), which could include "What-If' Analysis, Layers of Protection
Analysis, Checklist Reviews, Quantitative Risk Analysis, etc. This is followed by defining areas of concern, i.e. processes, procedures, etc. that are most critical to control risk. According to this document, failure of such risk controls would result in an accident. Indicators are, then, developed based on potential failures in the areas of concerns, or where there are ineffective barriers. For each area of concern, the document provides a predetermined list or a "menu" for potential lagging "outcome" or leading "activities" indicators. The lists are intended to support
organizations in identifying which ones are of particular interest to them.
The main new contributions of this document were differentiating outcome indicators (lagging) from activities indicators (leading) along with additional details on their development. This document provided guidance for setting priorities and ranking indicators as an aid to monitoring
and reducing the scope of indicators' development. It suggests that prioritization can be
achieved by assessing the potential consequences of failures of processes, procedures, etc. and the likelihood of that happening. The document also provided guidance for setting targets, monitoring policies' performance, and safety management. It highlighted the importance of engaging the stakeholders and sharing knowledge within and outside a company as well as monitoring performance early in a project lifecycle (i.e., in R&D, standards development, design and inherent safety).
2.3.3 Center of Chemical Process Safety Guidance
The American Institute of Chemical Engineers (AIChE), Center of Chemical Process Safety
(CCPS), issued a series of guidelines:
e Risk Based Process Safety (2007) [25]
e Process Safety Leading and Lagging Metrics (2008) [26]
e Guidelines for Process Safety Metrics (2010) [27]
The guidelines recommend categorization of indicators based on the "Accident Pyramid" and the selection of indicators based on the "Swiss-Cheese" model. It refers to other guidelines, e.g.
HSG254, for identifying hazards and selecting indicators, and provides a list of suggested
leading indicators that can be used, which are based on process safety elements and based on indicators' lists provided by other organizations. The main new contributions of these guidelines
were that they highlighted the importance of communication and provided more guidance for developing metrics based on targeted audiences within and outside an organization, as well as the type of indictors to be reported and the frequency of reporting. They promoted the development of consensus metrics and knowledge sharing among companies, as well as promoting social interests, such as sustainability (reporting performance progress towards
sustainability) and demands for public transparency. They also addressed the need for a
performance-based safety management system.
2.3.4 API 754 "Process Safety Performance Indicators" (2010)
The guidelines were developed by the American Petroleum Institute. The purpose of this API is to identify process safety leading and lagging indicators in the refining and petrochemical
industries [28]. Other personal safety and health safety indicators are not part of this
recommended practice. This API provides a framework for measuring activity, status or
performance that can be used to classify process safety indicators into four tiers of leading and lagging indicators.
The guidelines recommend identifying leading indicators based traditional Process Hazard Analysis (PHA) and risk assessments to define what can go wrong?, what are the consequences?, what is the likelihood?, what are the most critical barriers?, etc. Alternatively, it recommends using incident investigation findings to identify barriers that contributed to the incident, or using what other have successfully used to develop leading indicators. The guidelines are based on the assumptions of the "Swiss-Cheese" model that incidents result from failures of the barriers, and it recommends categorization of indicators into tiers based on the "Accident Pyramid". The document provides a set of leading indicators examples that can be used.
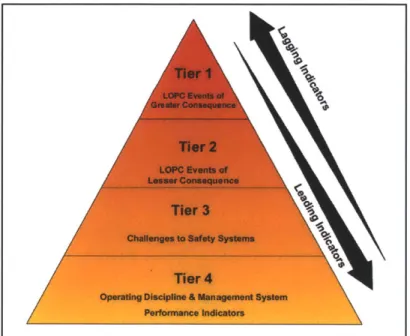
The main new contribution of this API is the tiering process for developing process safety indicators. For example, it defines Tier 1 and 2 indicators which are somewhat lagging and include, injury and/or fatality, fire or explosion, as well as flammable or toxic releases. On the other hand, Tier 3 and 4 indicators are more leading indicators that can be indicative of process safety system weaknesses that can lead to Tier 1 or Tier 2 incidents. Examples of Tier 3 and 4 are the number of training completed, inspections overdue, etc.
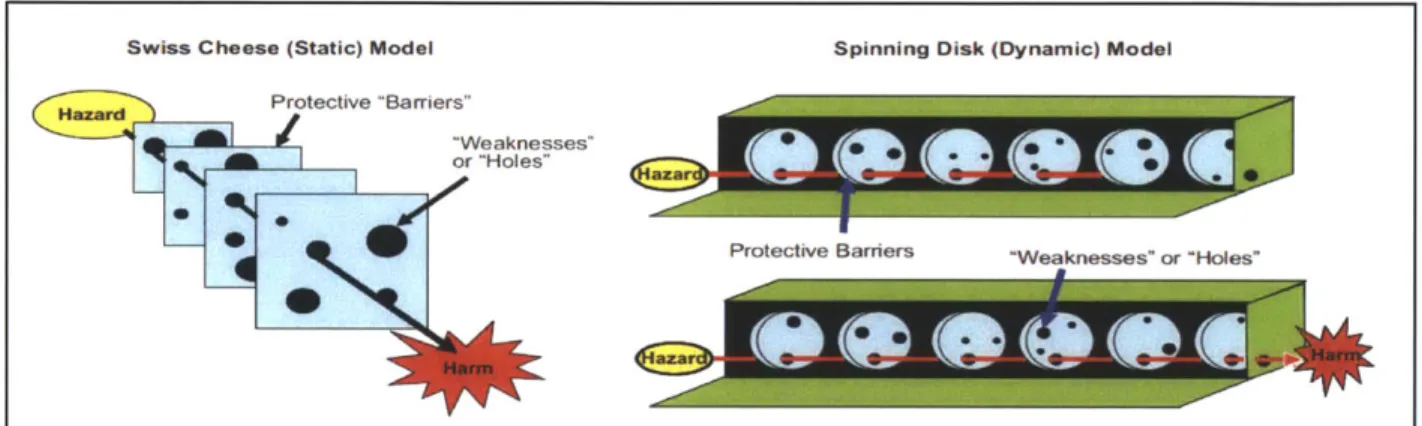
2.3.5 Shortcomings and Summary
The problems with these guidelines are that they are primarily based on the concepts of James T. Reason's "Swiss Cheese Model" and Christopher A. Hart's "Spinning Disks Model (Figure 2.7)
[28]. These models assume linear chains of events in accidents and do not address the complex
systemic causes of incidents. According to Reason in Managing the Risks of Organizational
Accidents, "major accidents result when a series of failings within several critical risk control
systems materialize concurrently [15]."
Swiss Cheese (Static) Model Spinning Disk (Dynamic) Model
Hazr Protective "Barriers"
"Weaknesses"
Protective Barriers 'Weaknesses" or "Hoies"
Figure 2.7: James T. Reason's "Swiss Cheese Model" and Christopher A. Hart's "Spinning Disks Model"
(From API 754 [28])
Also, most of these guidelines are based on the H. W. Heinrich accident pyramid. For example, the latest API uses this pyramid and groups accidents depending on their impact, into four tiers, representing a continuum of process safety indicators, varying from leading to lagging. It starts with Tier 1 as the most lagging and ends with Tier 4 as the most leading (Figure 2.8). While this provides a logical differentiation between leading and lagging indicators and while it suggests that high impact incidents are associated with precursor low impact incidents, there is no proof that this pyramid applies to process safety or to complex systems.
Figure 2.8: H.W. Heinrich's "Accident Pyramid"
(From API 754 [28])
While the concept that preventing a loss of containment is proactive, and mitigating the loss is reactive, the concept still assumes linear chains of events. Because incidents occur when there are complex interactions among events, there is a need for a more systematic view to account for these nonlinear factors. In addition, these guidelines use risk and reliability as parts of their recommendations. Most of them suggest using the likelihood of failures to reduce the scope of development, which can be deceiving as this may result in overlooking low likelihood events.
The Heinrich proposal describes indicators as a continuum or time dependent, while the Swiss Cheese model suggests that lagging indicators precede harm and focuses on the functionalities of the safety barriers. Rather than discussing failures, near misses, incidents, or events, a complex sociotechnical system must be reviewed to determine whether or not it is functioning safely. Moreover, although some guidelines provide the means to address culture, policies, and management system, integration and providing for feedback is lacking. Also, there is vague guidance on how individual plants or different processing facilities in an organization should be treated. For example, they do not cover transportation risks and do not fully address industrial parks, as they suggest applying these concepts individually and not to a site as a whole.
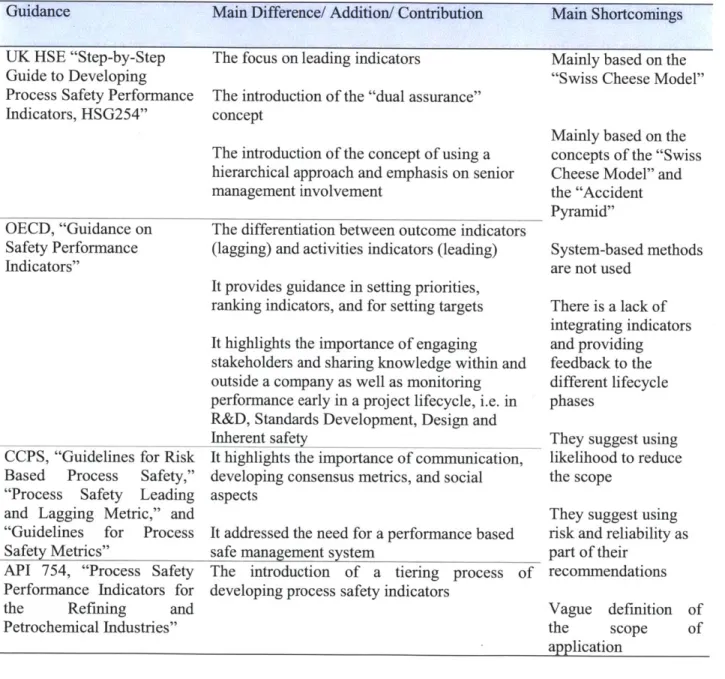
To summarize, Table 2.1 lists the new contributions of the previously discussed guidelines that were developed for process safety indicators development in the process industry, as well as those areas that they did not fully address.
Table 2.1: Summary of the Guidelines for Developing Process Safety Indicators Guidance Main Difference/ Addition/ Contribution Main Shortcomings
UK HSE "Step-by-Step The focus on leading indicators Mainly based on the
Guide to Developing "Swiss Cheese Model"
Process Safety Performance The introduction of the "dual assurance" Indicators, HSG254" concept
Mainly based on the The introduction of the concept of using a concepts of the "Swiss hierarchical approach and emphasis on senior Cheese Model" and
management involvement the "Accident
Pyramid"
OECD, "Guidance on The differentiation between outcome indicators
Safety Performance (lagging) and activities indicators (leading) System-based methods
Indicators" are not used
It provides guidance in setting priorities,
ranking indicators, and for setting targets There is a lack of integrating indicators It highlights the importance of engaging and providing stakeholders and sharing knowledge within and feedback to the outside a company as well as monitoring different lifecycle performance early in a project lifecycle, i.e. in phases
R&D, Standards Development, Design and
Inherent safety They suggest using
CCPS, "Guidelines for Risk It highlights the importance of communication, likelihood to reduce Based Process Safety," developing consensus metrics, and social the scope
"Process Safety Leading aspects
and Lagging Metric," and They suggest using
"Guidelines for Process It addressed the need for a performance based risk and reliability as
Safety Metrics" safe management system part of their
API 754, "Process Safety The introduction of a tiering process of recommendations Performance Indicators for developing process safety indicators
the Refining and Vague definition of
Petrochemical Industries" the scope of
3.0 SYSTEMS MODELING AND LEADING INDICATORS
3.1 ACCIDENT MODELS AND LEADING INDICATORS 3.1.1 Approaches to Accident Models
Because the goal of developing early warnings is to prevent accidents from occurring, it is important to understand how accidents develop. Leveson [8], [30], [31], Hollnagel [32], and Qureshi [33] have discussed different accident models and approaches to accident management. In general, accident causality models are grouped into two main categories: traditional and modem. Traditional accident models involve sequential, chain of events models. In contrast, modem models involve systematic analyses in which complex interactions and structural hierarchies in complex socio-technical systems are addressed.
Traditional sequential models were developed in the early 1940s by Heinrich [34] and later by Reason's proposed "Swiss Cheese" Model [15]. As discussed by Leveson, these models have limitations with regard to analyzing and understanding complex socio-technical systems [8],
[30], [31]. Although they provide simple graphical representation for developing scenarios, they
oversimplify causality and do not address interactions and complexities. Without addressing system complexity, leading indicators would not properly detect ineffective controls. By comparison, systemic models are intended to address the system as whole, rather than specific
component failures or deviations. Therefore, system-based accident analyses are more
appropriate to address system risk; accordingly, these were used in this research.
It is important that system-based models are used (i.e. STAMP, as in this research) to develop leading process safety indicators that are appropriate to address ineffective controls. This is important because most installations in the chemical processing industry are considered to be complex engineered systems involving internal and external interactions among physical equipment, people, and social aspects (discussed in Section 2.1.1). Leveson suggested that system-based models (i.e. STAMP) would address such complexities [8], [30], [31]. Also, catastrophic incidents in the chemical industry involve complex, multiple factors; there are frequently couplings between different systems components and decisions are made under certain operational pressures. The Piper Alpha and the BP Texas City incidents are notable
examples of how accidents occur as a result of multiple independent events stemming from system design flaws.
3.1.2 Introduction to STAMP
Safety is an emergent property of a system based on systems theory concepts and principles, as discussed in Section 2.1.2. This emergent property results from the enforcement of safety-related constraints on the behavior of the system components through design and operation [8]. Loss of containment in chemical processing complex socio-technical system results from inadequate controls or lack of safety control enforcement. Systems Theoretic Accident Model and Processes (STAMP) is a systemic accident model. It can be considered a comprehensive model that addresses complex socio-technical systems, and with which proactive safety and risk
management strategies can be developed. Unlike traditional accident models that address
component failures and analyze accidents using the chain of events approach, STAMP treats safety as a safety control problem in which enforcement of system safety constraints involve physical, organizational, and/or social elements, as illustrated in Figure 3.1 [8].
SYSTEM DEVELOPMENT
Congress and Legislatures Government Reports
Legislation Lobbyig
f Hearings and open meetings
Accidents
Government Regulatory Agencies Industry Associations, User Associations, Unions, Insurance Companies, Courts Regulations Certificaton Info Standards Change reports Certification Whistleblowers
Legal penalties Accidents and Incidents
Case Law Company Management
Safety Policy 1 Status Reports Standards Risk Assessments Resources Incident Reports
Policy, sids Project
Management
Haza Safety Standards Hazard Analyses Safe
S I Progress Reports Prog Design,
Documentation Safety Constraints A Test reports
Standards Hazard Analyses
Test Requirements Review Results implementation and assurance Safety Reports ReportsHazard Aiatysas nufacturing Documentation
Management Design Rationale
Work safety reports
procedues audis wouk "g inspections Manufacturing SYSTEM OPERATIONS ard Analyses ty-Related C ress Reports oper Harid Maintenance and Evolution
Congress and Legislatures 4 Government Reports Legislahon Lobbying
Hearings and open meetings Accidents
Government Regulatory Agencies
Industry Associations, User Associations, Unions,
Insurance Companies, Courts
Regulations Accident and incident reports Operations reports Gertification Maienance Repors Legal penalties c ne Reports Case Law 1 Changeteortswhisbeblowiers
Company
Safety Pokiy Operations Reports Standards
Resources
Operations
hanges Management
Work Instructions Chang requests Audit reports Problem reports Operating Assiumptions I
Operating Procedures Operating Process
Human Controllier(s)
imt
Automad Revised eCotroller
ating procedures
Itware revisions Actuator(s) I Sensor(s) ware replacements Physical PPcess Probtemn Report Incidents Partormance PAudts
Figure 3.1: Generic STAMP Control Structure (Developed by Leveson [8])
Control structures are based on controls and feedback. Using STAMP, the higher level control components are analyzed to determine how the physical system controls might be violated. Feedback comes in the form of communications with the higher levels of the hierarchy. Feedback from physical systems derives from process parameter indicators, inspection test results, preventive maintenance, and so on. Feedback from the staff to the line and higher management levels, and to external bodies, drives from reports, data, etc.
3.1.3 Safety Control and Leading Indicators
To enable developing process safety leading indicators, safety needs to be addressed as a control problem. Systems and their subsystems interact in unwanted ways, which result in conditions of
inadequate control. It is important to identify these interactions and controls as a means to develop proactive process safety indicators. Charles Perrow illustrated how unplanned and tightly-coupled nonlinear complex interactions are characteristics that could make a socio-technical system susceptible to degradation, increased level of risk, and potential accidents [6]. He stressed the time-dependence of coupling (i.e. the criticality of how coupled non-linear events vary with the time available or slack time). In addition, it is necessary to establish indicator targets at the different levels of a hierarchy, operating windows or envelopes, where the system
can operate safely.
Leading indicators can be developed by analyzing the safety controls at the different levels of the hierarchy. An approach that can be taken is that if system safety constraints are violated and inadequate controls results, then this would be an indication of system degradation that could lead to a loss. By using STAMP, the control theory concepts are addressed by defining the objectives/constraints, structure, functions/process, as well as the context in a holistic approach.
3.2 ADDRESSING THE SYSTEM DYNAMICS
STAMP-based modeling addresses the static safety control of the system, and does not address the dynamics involved. The dynamics of the system needs to be analyzed so that the different reinforcing pressures, feedbacks, expectations, etc. are incorporated to get a better understanding of the dynamics of ineffective control, and, thus, having better decision-making. This will help in evaluating what needs to be done for more proactive risk management, i.e. enabling early actions to take corrective actions. The objective is to determine possible decisions that could have a positive impact on the safety state of the system over time and to assess whether or not these decisions reinforce safety improvement efforts.
3.2.1 Introduction to System Dynamics
The system dynamics field was created by Jay Forrester, an MIT Professor, in the 1950s. System dynamics modeling is a tool that can help with understanding and evaluating complex systems, as it addresses the technical, organizational, and social aspects of systems. It also helps
by assisting managers and decision makers in evaluating policies and their impacts over time.
control concepts. Change, policy resistance, and response in a complex system can be analyzed in a system dynamics modeling [35].
In system dynamics, a system is modeled using flows, stocks, and causal loops. The system behavior and interactions (technical, organizational, and social), in addition to the associated non-linearities are addressed by reinforcing (positive) feedback loops and balancing (negative) feedback loops. The former results in positive reinforcing effects on the system's behavior, while the latter results in negative, counter effects. The system can be analyzed, understood, and
explained by the behavior resulting from the interactions among these loops. "The most
complex behaviors usually arise from the interactions (feedbacks) among the components of the
system, not from the complexity of the components themselves [35]." Modeling can also
incorporate delays, which can introduce instability in the behavior of a system.
3.2.2 Incorporating the System Dynamics
The system dynamics model can be developed by tying, linking and mapping its components to the developed STAMP control structure [36]. This can be achieved by navigating through the different levels of the control structure to develop input information, internal variables, and output information for each level, as well as interactions, information, feedback, and control across the defined boundaries.
The model can be developed further by building on earlier developed archetypes or models. There were a number of system dynamics modeling efforts, where reference modes, causal loop diagrams, etc. were developed for either analyzing actual accidents or for developing safety archetypes. They are based on conceptual understanding or theoretical foundations supported with findings from actual loss incidents, which is referred to by Goh et al. as "theorizing-to-practice" models [37]. Marais et al. provided a set of six system safety archetypes that could be used for modeling common system dynamics behaviors that could lead to accidents [38]. The archetypes developed by Marais et al. can be used to describe the qualitative nature of the complexity of interactions and feedback, and to get insight on the underlying structure and
behavior of the system under study. Moreover, Rudolph and Repenning have studied
disturbances [39] through the use of system dynamics models. System dynamic modeling of actual accidents or archetype models of accidents also offer a great learning opportunity for modeling.
3.2.3 Feedback Loops
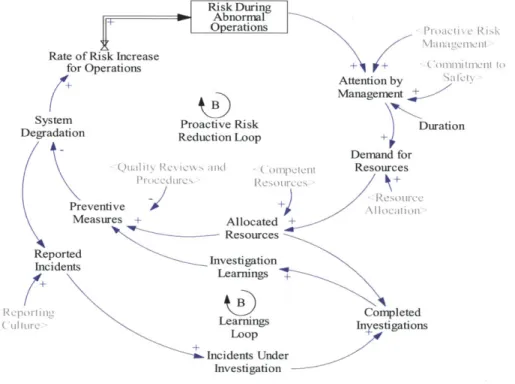
Feedback loops will influence whether or not system degradations would result in an increased level of facility risk. Using safety monitoring in addition to reporting proves that, given the same time allocation, hazards can be effectively controlled both in the long- and short-terms [40]. Based on this concept, two of the most important feedback loops that must be considered are: Proactive Risk Reduction: This loop addresses taking corrective actions when there is an increase in the leading indicators. The ability to detect degradation can be accomplished by proactively detecting possible degradation of the system before an incident occurs. Therefore, this loop captures system degradation through the proactive risk reduction loop, which has the leading indicators feeding into it to detect degradation of the system or to detect an increased level of risk.
Incident Learning: This loop addresses taking corrective actions based on lessons learned from other incidents. Kletz highlighted that, for accidents in the chemical industry, there would be similar incidents that have occurred a number of times in an organization prior to that accident's occurrence [41]. The same conclusion was drawn by independent investigation reports of major accidents. The investigation report of the Piper Alpha disaster [42] and those for the BP Texas City Refinery accident in 2005 [21], [22] indicated that similar incidents had occurred, or that problems were known prior to the occurrence of those accidents. "BP Texas City lacked a reporting and learning culture. Reporting bad news was not encouraged and often Texas City managers did not effectively investigate incidents or take appropriate corrective action [21]." This suggests that incident learning could have been limited in those organizations. Cooke and Rohleder suggested that, in order to reduce accidents, an organization incident learning system is needed [43]. Therefore, using incident learning to prevent accidents could be used as a loop in the model.
Learning may not prevent all potential accidents, but it will uncover many of them and could provide more insights into the chemical process or system that is being managed. This loop complements the proactive risk reduction loop, as safety performance improvement could have some limitations as the system becomes more complex. Amalberti indicated that reporting could become less relevant for predicting major disasters in complex systems [44]. The two feedback loops can be demonstrated in the following graph (Figure 3.2).
Risk During Abnormal
Operations Pmei R
Rate of Risk Increase
for Operations + + CommimCnt to
Attention by v
Management
System Proactive Risk Duration
Degradation Reduction Loop +
Demand for Qjualityk Reiews md ( )mpetent Resources
PceuRreReouc Preventive 0 +) Measures + Allocated + Resources Reported Investigation Incidents[erig Learnings+ ± Report ns Completed
cuu Learngs Inestigations
Loop Incidents Under
Investigation
Figure 3.2: System Dynamics Loops
These feedback loops can be integrated into a system dynamics model if developed based on the STAMP control structure. Figure 3.3 demonstrates incorporating these loops in the control of process excursions, integrity degradation, and overdue risk assessment.
Resource Directives Limitations
Completed 4- Alloca&
e Investigations + Resources
e for Ind dents
+ Learning
Taking Loop
SCorreclve Aclions
ncidents Under
Inc dent + Invesiligation Er
3Reportina
De san for
Correchlng ntegrity Integity Correcting Process Degradations Degradation Excursions
00 Operatiomi Pressures Demand for ed for htr Acton Process Excursions
-1
External Reporting Pressures Performance and-~ Results + Allocated Resource for Preventon +1Preventive Measures Proactive Risk" Reduction Loop +
Conductg Risk Overdue Assessmients Enneering Studies
System degradations part of the structure of the model were broken down and grouped into process-related excursions, integrity-related degradation, and overdue risk assessments.
" Process excursions: corresponds to an increased level of risk due to demands and
activations of alarms, safety instrumented systems, relief valves, etc.
" Integrity degradation: corresponds to an increased level of risk due to inspections found
to be outside the limits, defective safety critical equipment, etc.
e Risk assessments: covers delays in engineering studies and reviews
These groups can, thus, be linked to the level of risk of the facility. They impact the system degradation and level of risk, which can be improved if actions are taken to address any deviations. Taking the necessary corrective actions, however, depends on the ability of the organization to detect and acknowledge the information provided by leading indicators to prevent degradations. This requires management commitment, and the organizational safety
3.3 ACCIDENTS AND INEFFECTIVE CONTROL - CASE STUDY
Accidents result from ineffective control. In this Section, the BP Texas City Incident will be used to demonstrate how ineffective control resulted in this incident. The data were obtained from the CSB and Baker Panel investigation reports [21], [22]. Some of this information was limited. However, for purposes of this demonstration, the available information is sufficient.
3.3.1 Description of the System
In this case, the system involved in the accident are the Raffinate Splitter and the Blowdown Drum (receives and quenches hydrocarbons from the Splitter relief systems, and vents vapor to the atmosphere), as shown in Figure 3.4.
Safet Reler vases
Stack
Figure 3.4: Raffinate Splitter and the Blowdown Drum
(Reference: [22])
The incident occurred during a start-up of the Raffinate Splitter.
0 The Splitter was 85% liquid filled at high temperature and pressure;
e The pressure in the Splitter continued to increase rapidly;
e The vapor and liquid were relieved through the relief valves, which were connected to the
Blowdown Drum;
e The Blowdown Drum filled up quickly, and hydrocarbons were discharged from an
![Figure 2.1: Traditional Risk Reduction Principle (Adopted from IEC 61508 [14])](https://thumb-eu.123doks.com/thumbv2/123doknet/14731420.573064/18.918.148.750.265.527/figure-traditional-risk-reduction-principle-adopted-iec.webp)
![Figure 3.1: Generic STAMP Control Structure (Developed by Leveson [8])](https://thumb-eu.123doks.com/thumbv2/123doknet/14731420.573064/33.918.177.717.105.669/figure-generic-stamp-control-structure-developed-leveson.webp)