HAL Id: hal-03181732
https://hal.archives-ouvertes.fr/hal-03181732
Submitted on 25 Mar 2021HAL is a multi-disciplinary open access
archive for the deposit and dissemination of sci-entific research documents, whether they are pub-lished or not. The documents may come from teaching and research institutions in France or abroad, or from public or private research centers.
L’archive ouverte pluridisciplinaire HAL, est destinée au dépôt et à la diffusion de documents scientifiques de niveau recherche, publiés ou non, émanant des établissements d’enseignement et de recherche français ou étrangers, des laboratoires publics ou privés.
On the Coupling between Ionic Conduction and Dipolar
Relaxation in Deep Eutectic Solvents: Influence of
Hydration and Glassy Dynamics
Aicha Jani, Benjamin Malfait, Denis Morineau
To cite this version:
Aicha Jani, Benjamin Malfait, Denis Morineau. On the Coupling between Ionic Conduction and Dipolar Relaxation in Deep Eutectic Solvents: Influence of Hydration and Glassy Dynamics. Journal of Chemical Physics, American Institute of Physics, 2021, 154 (16), pp.164508. �10.1063/5.0050766�. �hal-03181732�
1
On the Coupling between Ionic Conduction and
Dipolar Relaxation in Deep Eutectic Solvents:
Influence of Hydration and Glassy Dynamics
Aicha Jani,† Benjamin Malfait,† and Denis Morineau†*
†Institute of Physics of Rennes, CNRS-University of Rennes 1, UMR 6251, F-35042 Rennes,
France
ABSTRACT
We have studied the ionic conductivity and the dipolar reorientational dynamics of aqueous
solutions of a prototypical deep eutectic solvent (DES), ethaline, by using dielectric spectroscopy
on a broad range of frequency (MHz-Hz) and for temperatures ranging from 128 to 283 K. The
fraction of water in the DES was varied systematically to cover different regimes, starting from
pure DES and its water-in-DES mixtures to the diluted electrolyte solutions. Depending on these
parameters, different physical states were examined, including low viscosity liquid, supercooled
viscous liquid, amorphous solid and freeze-concentrated solution. The ionic conductivity and the
reorientational relaxation both exhibited characteristic features of glassy dynamics that could be
quantified from the deviation from Arrhenius temperature dependence and non-exponential decay
2
where the dipolar relaxation and ionic conductivity remained inversely proportional to each other,
and the DES-in-water regime, (> 40 wt %), where a clear rotation-translation decoupling was
observed. This suggests that for low water content, on the timescale covered by this study (~10-6 s
to 1 s), the rotational and transport properties of ethaline aqueous solutions obey classical
hydrodynamic scaling despite these systems being presumably spatially microheterogeneous. A
fractional scaling is observed in the DES-in-water regime, due to the formation of a maximally
freeze-concentrated DES aqueous solution coexisting with frozen water domains at sub-ambient
temperature.
3
1.
Introduction
Recently, deep eutectic solvents (DESs) have received increased attention as an emerging class
of solvents.1-6 A majority of DESs are obtained by mixing of an H-bond donor (HBD) (typically
an organic molecular component such as an amide, carboxylic acid, or polyol) with an H-bond
acceptor (HBA) or witha molecular ionic species.6 In most frequently studied systems, i.e. type
III DESs, the latter consists of a quaternary ammonium salt. For compositions approaching the
eutectic point a large decrease of the melting point is obtained, so that DESs form a liquid phase
at room temperature.7, 8 This phenomenon can be amplified by non-ideal mixing effects, which are
favored by ionic and H-bonding interactions, and specific spatial correlations between the DES
constituents.9, 10 Nowadays, DESs are contemplated as cost-effective and sustainable alternatives
to classical organic solvents.3-6 They present many performant properties, such as low volatility,
and high solvating and extracting properties. DESs have been considered for practical applications
in a growing number of industrial processes, including extraction, (bio)synthesis, catalysis,
electrochemistry, and carbon dioxide capture.6
The ionic conductivity of DESs makes them good candidates as alternative electrolytes for
applications related to energy harvesting and storage.6, 11-15 Recently, choline chloride-based DESs
(i.e. ethaline, reline and aqueous solution of glyceline) have been studied as electrolytes for
electrochemical applications,11, 12 redox flow batteries,13 lithium-ions batteries,14 and
dye-sensitized solar cells.15
From a fundamental point of view, it is striking that the ionic and molecular mobilities of DESs
4
studied in reline,16 ethaline,17 and acetamide-urea DESs.18 They exhibit fractional viscosity
dependence and deviations from the hydrodynamic predictions based on Stokes-Einstein and
Stokes-Einstein-Debye theories. These results suggest that the molecular motions of the
fluorescent dyes are sensitive to the existence of dynamic heterogeneity in DESs. High frequency
(GHz) dielectric relaxation (DR) have also concluded on the deviation from the hydrodynamic
predictions for molecular rotation, indicating the critical role of collective reorientation relaxation
and H-bond fluctuations in regulating the DR dynamics.19, 20 From the combination of molecular
dynamics (MD) simulation and neutron scattering (NS), a microscopic relation was made between
transport properties and liquid structure of ethaline.21 Different translational diffusion and
rotational relaxation depending on the DES constituent were observed, and evidence for
long-lasting dynamic heterogeneity (> 10 ns at 298 K) was inferred from the non-Gaussian character of
the van Hove function related to self-diffusion of Chloride anion. Interestingly, dynamic
heterogeneities were found to result from the complex interplay of solvation structure and H-bond
dynamics.21
Aiming at a better understanding of the dynamics of DESs, it is worth noting that only a few
studies have addressed longer time relaxation processes (i.e. longer than a few ns), so far.22-24
Dielectric spectroscopy (DS) is a perfectly well-suited method because it allows independent
measurements of the ionic conductivity and the orientation dipolar dynamics on an extended
frequency range.25 This provides a complementary view on the translation and rotational motions
of DES species.24 Moreover, it bridges the gap from short (~10-9 to 10-6 s) to ultra-long timescale
(~102 s), which are typical for the dynamical range going from a low-viscosity liquid to an
amorphous solid. Due to the large depression of the eutectic melting point, DESs are usually liquid
5
This further extends the slowing down of the DES dynamics in the supercooled and glassy states,
implying that their dynamics should be studied over many decades.24, 26 For ethaline, a
comprehensive DS study has shown that the ionic transport and the reorientation dipolar motions
were strongly influenced by the glassy dynamics.24 In addition, it was demonstrated that both
dynamics obeyed the same temperature dependence. The origin of this unique scaling has not been
clarified yet. It might arise from a direct translational-rotational coupling, such as revolving-door
mechanism or be due to the coupling of both dynamics to viscosity. The latter case would imply
that hydrodynamics predictions from Stoke-Einstein and Stoke-Einstein-Debye models are
fulfilled, thus minimizing the influence of dynamic heterogeneity.
In order to better understand the role of dynamic heterogeneity, an attractive approach would
consist in varying gradually the solvation properties and H-bond interactions. Although
conceivable in molecular models, this goal is more challenging in experiments. In the present
study, we propose to use different hydration levels of DES as control parameters. In fact, water
addition is recognized as a way to formulate DES-based solvents with tailored properties.10, 26-37
More specifically, the structure of DESs is greatly influenced by water in several ways.10, 27, 28, 36,
38, 39 Although supramolecular ionic clusters formed by the association of the initial DES
components seem resistant to moderate hydration levels in the so-called ‘water-in-DES’ regime,
water molecules often participate in the H-bond complexes of the original DESs as an additional
HBD.38, 40-42 The preferential solvation of chloride by water was also reported in choline chloride
based DESs.27, 33, 43, 44 Dielectric relaxation study of aqueous solution of glyceline and reline
performed at room temperature and high (microwave) frequencies (0.05 to 89 GHz) indicates that
a structural transition occurs for water mole fraction about 0.8, from the homogeneous electrolyte
micro-6
segregation of species into regions of different composition can result in co-continuous structures
and mesoscopic length scale heterogeneities.10, 35, 36, 39, 46
In the present study, we have addressed the relative impact of these structural reorganizations
on transport properties, dipolar relaxation and glassy behavior. We have performed a dielectric
spectroscopy study of the prototypical ethaline DES (choline chloride/ethylene glycol 1:2) and
nine different aqueous mixtures thereof, which were recently studied by differential scanning
calorimetry (DSC) and neutron scattering.26, 39 The ionic conductivity and reorientation dynamics
were shown to vary by more than 6 decades on the entire studied temperature range 128 – 283 K. In the ‘DES-in-water’ region, (> 40 wt %), according to the designation introduced by
Roldán-Ruiz et al.36, an abrupt decoupling between transport properties and dipolar relaxation was
observed. This was attributed to phase separation and the formation of a maximally freeze
concentrated DES solution during cooling. In the ‘water-in-DES’ regime, (< 40 wt %), the solution
obviously formed a macroscopically homogeneous liquid phase and presented characteristic
features of a glassy dynamics, i.e. non-Arrhenius temperature dependence and non-exponential
relaxation functions. In this range of composition, temperature, and timescale, this study indicates
that only a marginal decoupling between ionic transport and dipolar dynamics is observed.
2. Methods
2.1. Samples.
Choline chloride (>99%) and ethylene glycol (anhydrous, 99.8%) were purchased from
Sigma-Aldrich. DES was prepared by weighting and adding ethylene glycol and choline chloride in a
7
mixed by mechanical agitation at about 60°C for 30 min until a clear homogeneous liquid phase
was obtained and served as stock solutions. Series of 10 working solutions were prepared by
pipetting and addition of deionized water, corresponding to regularly spaced values of the mass
fraction of water W from 0 to 90 (%wt).
2.2. Dielectric Spectroscopy Experiments.
The sample was prepared in parallel plate geometry between two gold-plated electrodes with a
diameter of 20 mm and a spacing of 260 m maintained by Teflon spacers. It was placed in the
cryostat and maintained under a dry nitrogen atmosphere. The complex impedance of the
as-prepared capacitor was measured from 1 Hz to 106 Hz with a Novocontrol high resolution
dielectric Alpha analyzer with an active sample cell. The measurements were performed at thermal
equilibrium with a temperature step of 5 K, and covering the temperature range from 283 K to 128
K (10 °C to -145 °C). The temperature of the sample was controlled by a Quatro temperature
controller (Novocontrol) with nitrogen as a heating/cooling agent providing a temperature stability
within 0.1 K.
3. Results and discussion
3.1. Dielectric permittivity spectra.
The complex dielectric function of the sample 𝜀∗(𝑓) = 𝜀′(𝑓) − 𝑖𝜀′′(𝑓) was evaluated for the
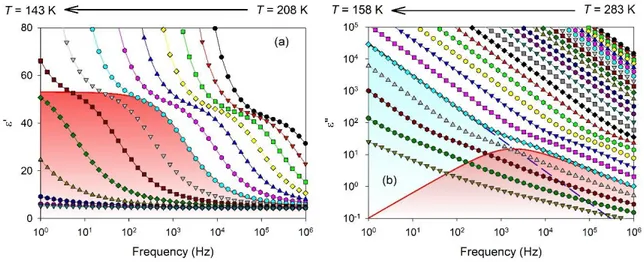
ten DES samples with different hydration levels, where f denotes the frequency of the electric field, ´ and ´´ the real and loss part of the complex dielectric function and i symbolizes the imaginary unit. The two components are presented in Fig. 1(a) and (b) for a mixture of ethaline with W = 10
8
the temperature and the frequency ranges, different contributions were observed in the
instrumental frequency window. At high temperature, the complex dielectric function was
dominated by ionic conductivity. This was revealed by a power law term (-1/f) in the intensity of
the dielectric loss (cf. blue dashed line with slope -1 in log-log scale in Fig. 1(b)). This ionic conductivity ultimately led to a huge increase of both ´ and ´´ at lower frequency, with deviation of ´´ from the (-1/f) scaling. These phenomena were attributed to polarizations effects due to the blocking electrodes, as usually observed for conducting liquids. They do not hold any useful
physical information on the samples and have been excluded from the discussion. In the low
temperature range, typically below 210 K, a main peak appeared in the dielectric loss. It was also associated to a jump in the real permittivity ´, as indicated by solid lines and red filled areas in Fig. 1(a) and (b). This was attributed to the dipolar -relaxation process, in agreement with the
interpretation made for anhydrous ethaline.24
FIG. 1. (a) Real and (b) loss part of the complex dielectric function of a mixture of ethaline with
W = 10 wt% of water as a function of the frequency and the temperature. The different curves
9
decreasing steps of 5 K from right to left. The components of the fitted model are illustrated for
the selected temperature T = 178 K. The dipolar relaxation modelled by a Havriliak-Negami
function (solid line with red-filled area in both panels) and ionic dc-conductivity (dashed line with
blue-filled area in panel b).
The dielectric measurements were analyzed quantitatively by fitting the complex dielectric
function by a model including a Havriliak and Negami functions (HN-model),49 and a conductivity
term according to eq. 1.
𝜀∗(𝜔) = 𝜀∞+
∆𝜀
(1+(𝑖𝜔𝜏𝐻𝑁)𝛼)𝛽− 𝑖
𝜎
𝜔𝜀0 (1)
where 𝜀∞ is the sample permittivity in the limit of high frequency, ∆𝜀 and are the dielectric
strength and the HN-relaxation time of the mode. According to the formalism of the HN-model, the exponent parameters and account for the symmetric and the asymmetric broadening of the complex dielectric function with respect to the Debye one. stands for the DC conductivity of the sample and 𝜀0 the permittivity of vacuum. The application of this model provided fits of good
quality in the temperature and frequency regions where electrode polarization was not significant,
as illustrated in Fig. 1. The average relaxation time corresponding to the maximum frequency of
the relaxation peak was computed according to
𝜏 = 𝜏𝐻𝑁 sin ( 𝜋𝑎 2+2𝛽) −1⁄𝛼 sin (2+2𝛽𝜋𝑎𝛽) 1⁄𝛼 (2)
10
The ionic conductivities measured by fitting the complex dielectric function were found in good
agreement with recent measurements reported in the complementary region above room
temperature by Lapena et al.34 These measurements were however limited to pure ethaline and one
ethaline-water mixture (8 wt%) as illustrated in Fig. 2a. On increasing the amount of water at a
constant temperature (T = 283 K), the conductivity gradually increased until it reached a maximum
value for W > 40% as illustrated in Fig. 2b. This non-monotonous behavior has been also observed
by molecular dynamics simulations of aqueous reline and ethaline solutions by Celebi et al.50 The
initial increase of conductivities with adding water was attributed to the destabilization of the
H-bonds associations between DESs species that resulted in a smaller viscosity and faster transport
properties. For W > 40%, DESs constituents were found fully dissolved into a DES-in-water
aqueous solution, which implied that the ionic conductivity eventually decreased due to dilution
effects.
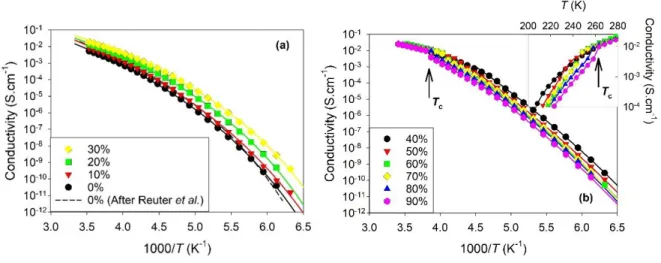
FIG. 2. (a) Comparison of the conductivity measured in the present study from the fit of the
complex dielectric function of ethaline and an ethaline water mixture (W = 10 wt%) with the
11
Effect of water on the conductivity measured in the present study at 283 K and by molecular
dynamics simulation at 303 K by Celebi et al. 50
3.3. Translational dynamics at variable temperature
The ionic conductivities measured on the temperature range from 158 to 283 K are illustrated
in Fig. 3 in Arrhenius representation. Two qualitatively different behaviors were observed
depending on the hydration level. For low hydration levels (0-30 %), a continuous temperature
variation of the conductivity was obtained, while a discontinuity was observed for larger dilution
(40-90%). The discontinuity occurred at a temperature that depended on W, as illustrated by an
arrow in Fig. 3b for W = 90%. These two ranges of compositions correspond to the usually denoted
DES-in-water and water-in-DES regimes.36
FIG. 3. Temperature dependence of the conductivity of aqueous mixtures of ethaline in
Arrhenius representation for different values of the water mass fraction W. Fits with a VTF law
40-12
90%. The crystallization temperature Tc is indicated by an arrow for W = 90%. Inset: magnified
view of the crystallization region with temperature in linear scale.
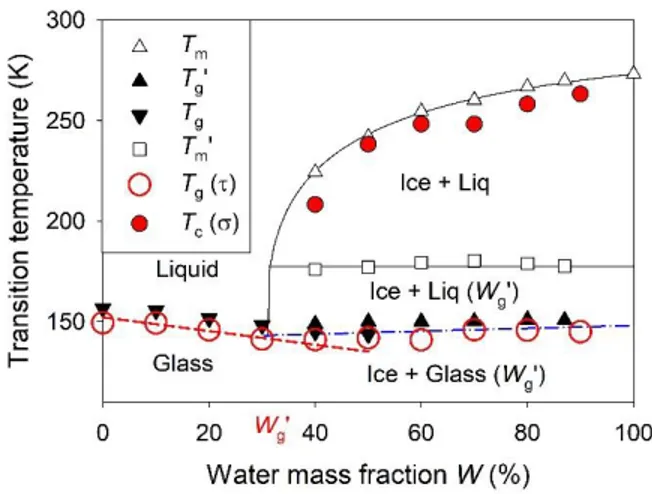
A clear explanation of this dependence on the water dilution can be found in the phase diagram
of the ethaline-water system, which was recently determined by calorimetry (cf. Fig. 4).26 It has
been shown that below a threshold value Wg’ ~ 30%, water hydration molecules are strongly
interacting with DES molecular units. In this range of composition, the hydrated DES forms a
single phase system, even at low temperature, where it presents a single glass transition. On the
contrary, for W > Wg’, the aqueous solution phase separates on cooling into a pure ice phase and a
maximally freeze-concentrated aqueous solution of DES having the composition Wg’.
FIG. 4. Phase diagram of the DES aqueous mixtures as a function of the water mass fraction.
Crystallization temperature determined from conductivity (filled circles), and isochronic glass
transition temperature determined from dielectric relaxation time (open circles). Calorimetric
determinations of the liquidus (Tm), onset of melting (Tm’) and glass transition temperatures (Tg
13
For W < Wg’, the conductivity monotonously increases with the fraction of water. This behavior
follows the observations made previously around room temperature, and confirms the plasticizing
effect of water. For W > Wg’, the opposite dependence of the conductivity with the fraction of
water is observed below Tc. This is due to the formation of a spatially heterogeneous phase
separated system, where the ionic diffusion process that persists in the freeze-concentrated
electrolyte is restricted by the coexisting ice matrix. Although the composition of the conducting
freeze-concentrated electrolyte (Wg’) does not depend on the initial composition W, the overall
conductivity of the heterogeneous system decreases as a function of the relative fraction of ice
formed.
3.4. Reorientational dynamics
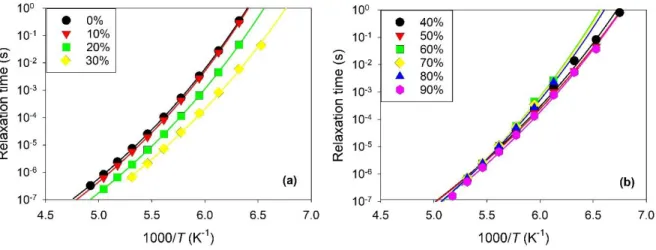
The dielectric relaxation times are illustrated in Arrhenius representation in Fig. 5. As for the
transport properties, two different behaviors were observed depending on the regime of hydration.
For low hydration levels (W < Wg’), the dipolar relaxation became faster with the addition of water
(cf. Fig. 5a). It was accelerated by up to a factor of 100 for the hydration level W = 30 %, with
respect to the neat DES. The acceleration of the reorientational dynamics at low hydration level
resembles the observation made for the conductivity. As general trends, these observations confirm
14
FIG. 5. Temperature dependence of the relaxation time of aqueous mixtures of ethaline in
Arrhenius representation for different values of the water mass fraction W. Fits with a VTF law
(solid line). (a) Water-in-DES regime, with W = 0-30% (b) DES-in-water regime, with W =
40-90%.
For high hydration levels (W > Wg’), the dipolar dynamics depended only marginally on the
amount of water. Indeed, the relaxation times measured for 6 different compositions essentially
felt on a single curve, which extended over 7 decades in time (cf. Fig. 5b). This behavior differs
from the ionic conductivity that decreases with W. This apparently contradictory observation finds
a clear explanation. The dipolar relaxation probes the reorientational dynamics of the DES solution
on a local scale. For W > Wg’, the co-existence of ice with the phase forming the maximally
freeze-concentrated solution of DES does not affect the rotational dynamics of the DES molecules. This
implies that the size of the DES domains is large enough to limit the influence of interfacial effects
and to prevent that the molecules can diffuse across a DES domain on the typical timescale of the
rotational dynamics. On the contrary, these conditions may not be fulfilled for ionic conduction,
15 3.5. Glassy dynamics
We now analyze in more details the functional temperature dependence of both dynamics. In
all cases, a strong deviation from an Arrhenius behavior was observed. This is demonstrated by
the curvature in the Arrhenius plots of the conductivity and the relaxation time shown in Fig. 3
and Fig. 5. This increase of the apparent activation energy during cooling is typical for
glassforming liquids and it has been already discussed for neat ethaline.24 For all the water-ethaline
mixture studied, the existence of a glass transition has been actually by demonstrated by DSC.26
A complementary estimation of the glass transition temperature has been also evaluated from the
present dielectric measurements by extrapolation of the relaxation time to 102 s as illustrated in
Fig. 5.
The deviations of the dipolar relaxation and conductivity from the Arrhenius behavior were
described by the empirical Vogel–Fulcher–Tammann (VFT) law. For the relaxation time, the
classical VFT equation is given by Eq. 3, while the modified version corresponding to Eq. 4 is
classically adopted for the ionic transport.24
𝜏 = 𝜏0𝑒𝑥𝑝 (𝐷𝜏𝑇0𝜏
𝑇−𝑇0𝜏) (3)
𝜎 = 𝜎0𝑒𝑥𝑝 (−𝐷𝜎𝑇0𝜎
𝑇−𝑇0𝜎) (4)
In these two equations, 0 and 0 are the pre-exponential factors, Dx and T0x (x = , ) are the
strength parameters and the Vogel-Fulcher temperatures associated to the dipolar relaxation and
conductivity, respectively. Large deviation from an Arrhenius behavior is characterized by small
values of Dx, while an Arrhenius behavior is recovered for large Dx and T0x 0. Satisfactory fits
16
temperature and water mass fraction as illustrated by solid lines in Fig. 3 and Fig. 5. The deviation
of the relaxation time from an Arrhenius behavior has been considered for many decades as a
salient feature of most of the glassforming systems in their liquid and supercooled states. It has
been recognized as an evidence for the cooperative nature of the structural relaxation.51 The
non-Arrhenian character has been used to define a parameter, named the fragility index m, that
categorizes series of glass-forming liquids according to the nature of their dynamics in terms of
fragile or strong systems.52 For ethaline, we found values of the fragility index around m = 48,
which corresponds to the type of intermediate system according to this classification. For pure
ethaline, Reuter et al. found a slightly larger value of the fragility index (m = 60), which might be
attributed to the larger frequency range adopted in that study (109-10-1 Hz). Interestingly, we
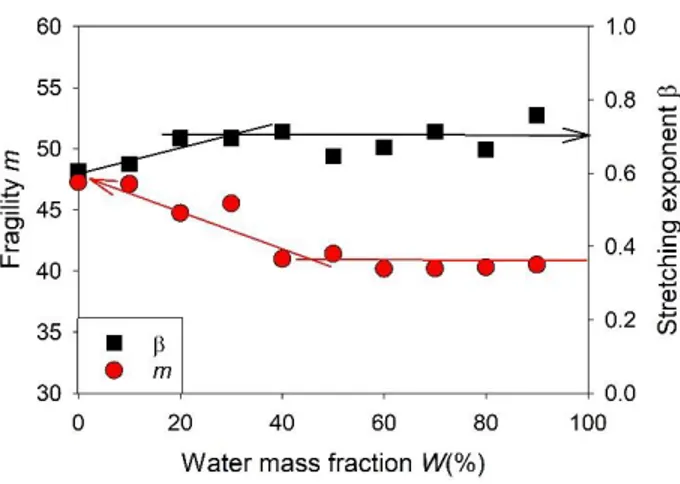
observed that the fragility of ethaline decreased with the addition of water, as illustrated in Fig. 6,
and then reached a plateau value (m = 40) for water mass fraction larger than W = 40%. The
invariance of m in the DES-in-water regime, i.e. for W > 40%, agrees well with the formation on
cooling of a maximally freeze-concentrated solution with fixed composition Wg’ and dipolar
dynamics. In the water-in-DES regime, the possible reduction of fragility of a DES with adding
water has never been reported so far, though it can be seen as moderate, if one considers that the
entire fragility scale extends from m = 16 for strong liquids to m = 170 for extremely fragile
17
FIG. 6. Dependence on the water amount of the fragility index (circle) and the stretching
exponent of the dipolar relaxation (square).
Another salient observation concerns the deviation of the relaxation function from a simple
Debye process. In the time domain, the non-exponential character of the relaxation function of
liquids is often expressed by a stretched exponential function, also denoted
Kohlrausch-William-Watts function. To conform with this representation, we applied the numerical ansatz that connects
the stretching exponent KWW with the HN parameters obtained in the frequency domain i.e.
𝛽𝐾𝑊𝑊= (𝛼𝛽)
1
1.23 .53 The found values of KWW increased from 0.6 to 0.7 with the addition of water,
and saturated for mass fraction larger than W = 40%, as illustrated in Fig. 6. In glass forming
liquids, the non-exponential character of the structural relaxation is classically attributed to the
presence of a distribution of relaxation times. There is a growing number of evidences that this
distribution actually reflects the presence of spatially heterogeneous dynamics. 53 Accordingly, it
seems counterintuitive, that the addtion of water to DES resulted in apparently more homogeneous
18
HBD and solvating agent with respect to the initial DES constituents rather point to the formation
of a broader distribution of local environments.10, 27, 35, 39, 46 Therefore, one would have expect a
decrease of KWW with increasing W. A possible rationalization is suggested by the concomitant
reduction of fragility of the DES with the addition of water. As shown in Fig. 6, the increase of KWW seems correlated to the decrease in the fragility index m. A relationship between fragility and
non-exponentiality has been established for numerous very different glass-forming systems.52 It
appears that ethaline and water-ethaline mixtures also obey with this relationship between KWW
and m. Their dynamics compare well with other H-bonded liquids, such as polyalcohols, that fall
in the category of intermediate and moderately non-Debye liquids (cf. Fig. 3 in ref. 52). Moreover, when adding water the increase of KWW with decreasing m is in qualitative agreement with the
linearly decreasing dependence, which was proposed for molecular glassfomers in that study.52
Supporting pioneering ideas about the concept of cooperativity dynamics,51 many studies indicate
that the glassy slowdown is accompanied by the growing length scale of transient domains.54, 55 In
this context, one may speculate that the nanosegregation of DES components with the addition of
water, while favoring structural heterogeneity with the formation of domains having distinct
composition, would restrict the growth of dynamic cooperativity to values bounded by the domains
typical size. 35, 39 A microscopic description of cooperative character of the molecular dynamics in
DESs would be desirable to test this idea, which shares similarity with the concept cut-off on
cooperativity length introduced for nanoconfined liquids.56-58
3.6. Rotation-Translation decoupling
In order to address the (de)coupling of the ionic transport and the reorientation dipolar motions
19
processes. Same values are obtained for neat ethaline, which is in agreement with the recent study
concluded that both dynamics obeyed the same temperature dependence.24 A difference between
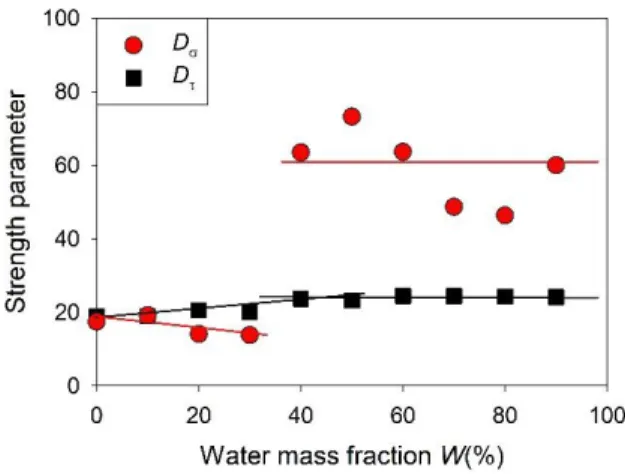
both strength parameters is observed on adding water. It remains very small up to W = 40,
indicating opposite effect of water on the fragility when refereeing to reorientation or translation.
FIG. 7. Dependence on the water mass fraction of the strength parameter of the dipolar
relaxation (circle) and the ionic conductivity (square) of ethaline aqueous mixtures.
It should pointed out that the frequency and temperature range covered by both processes are
different in DS experiments, which might influence the determination of the strength parameters.
To overcome the question, we have also represented the conductivity as a function of the relaxation
time for a limited selection of temperatures where both processes are measurable simultaneously
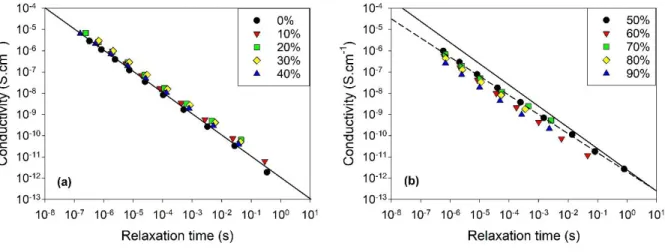
in the DS spectra, as illustrated in Fig. 8a. It confirms that for W < 40 %, and in this temperature
range, both quantities are essentially inversely proportional. This relationship is indicated by a
solid line in Fig. 8a. For neat ethaline, this inverse proportionality has been already demonstrated.24
In this study, the authors concluded that the question remained opened, however, whether the two
processes were actually coupled to viscosity, implying that the Einstein and
20
other. The latter case was illustrated by the revolving-door or paddle-wheel mechanism, which
was also considered for ionic liquids where paths for ions diffusion are opened by the rotation of
other dipolar ions.59 The addition of water to choline based DES is known to modify significantly
the hydration shell of chloride anions, which are preferentially solvated by water.27, 33, 43, 44 The
H-bond interactions within the original DESs supramolecular complexes are also affected by water
acting as an additional HBD.38, 40-42 For these reasons, it seems unlikely that a persistent
revolving-door mechanism can tolerate the effects of adding up to 40% of water to ethaline. It rather indicates
a more classical scenario in which both dynamics are coupled to viscosity, in accordance with the
predictions from hydrodynamics.
FIG. 8. Dependence of the ionic conductivities on their reorientational relaxation times of
aqueous mixtures of ethaline as a function of the water mass fraction. (a) Water-in-DES regime,
with W = 0-30% (b) DES-in-water regime, with W = 40-90%. The solid line with slope -1 in
panels (a) and (b) indicates inverse proportionality 𝜎 ∝ 𝜏−1, while the dashed line in panel (b) has
21
For large water mass fraction (W > 40%), a completely different situation is observed, with a
large decoupling between both dynamics. This is illustrated by a sudden jump of the strength
parameter of the ionic conductivity from about D = 15 to 60 at W = 40%, which is consistent by
the close to Arrhenian behavior of the conductivity shown in Fig. 4b. Likewise, a breakdown of
the inverse proportionality is observed, indicating a fractional translational-rotational coupling
with 𝜎 ∝ 𝜏−0.9, as illustrated in Fig. 8b. This phenomenon provides a clear illustration of the
possible effects of strong spatial heterogeneities, the latter being due to the coexistence of domains
formed by maximally freeze-concentrated DES aqueous solutions and by solid water.
4. Conclusion
The existence of dynamic heterogeneity in DESs has been indicated by clear deviations of the
rotational-translational dynamics of dye molecules from the Stokes-Einstein-Debye hydrodynamic
predictions. The dielectric spectroscopy is a unique method to determine simultaneously the
reorientational dynamics of dipolar molecules and the transport properties of ionic species on an
extended range of frequency. So far, this method has been barely used for DESs, although a recent
study has pointed to the existence of a coupling between both processes for ethaline.
In the present study, we have used the fraction of water in ethaline DES aqueous mixtures, as a
varying control parameter of the solvation and H-bond interactions. The reorientational dynamics
and the ionic conductivity of ten ethaline solutions were studied in the temperature range 128 –
283 K and the MHz-Hz frequency range. Two different regimes were observed depending on the
water mass fraction W, which agrees with the published phase diagram of ethaline aqueous
22
In the water-in-DES regime, (< 40 wt %), the DES aqueous mixtures did not formed classically
phase separated systems. The relaxation time and the conductivity presented characteristic features
of glassforming systems, including a deviation from Arrhenius temperature dependence and a
non-exponential decay of the relaxation function. The addition of water resulted in an acceleration of
both dynamics, by up to a factor of 100, indicating a plasticizing effect of water on the DES.
Moreover, according to the dipolar relaxation, the addition of water concomitantly reduced the
fragility index m and increased the stretching exponent KWW. According to the values of both
parameters, ethaline and ethaline-water mixtures fall in the category of intermediate glassforming
liquids. The values of KWW and m fulfills the relationship made for intermediate molecular
glassforming liquids such as polyalcohols.
Interestingly, it can be concluded that in this range of composition, temperature, and timescale,
the dipolar relaxation and ionic conductivity remained inversely proportional to each other. The
persistence of a direct coupling mechanism, where paths for ions diffusion are opened by the
rotation of other dipolar ions is improbable. Although such paddle-wheel mechanism was indicted
for ionic liquids, and also invoked as a possible process for neat ethaline, it seems unlikely that it
remains unaffected despite the important modifications in ion solvation and H-bond interaction
induced by the water addition to the DES components. The applicability of the
Stokes-Einstein-Debye relation rather indicates that both dynamics are equally coupled to viscosity. This
conclusion also implies that the dynamic heterogeneity plays a secondary role in the present
experiment situation.
In the DES-in-Water regime, (> 40 wt %), a clear rotation-translation decoupling is observed,
including a transition towards a nearly Arrhenius dependence of the ionic transport, and a
23
attributed to the spatially heterogeneous nature of the phase-separated sample, where domains
formed by maximally freeze-concentrated DES aqueous solutions coexist with frozen water.
Acknowledgments
Support from Rennes Metropole and Europe (FEDER Fund – CPER PRINT2TAN), and the
ANR (Project NanoLiquids N° ANR-18-CE92-0011-01) is expressly acknowledged. This work is
part of the PhD thesis of A.J. who benefits from a grant from the French Ministry of Higher
Education, Research, and Innovation. The authors are grateful to the CNRS – network SolVATE
(GDR 2035) for financial support and fruitful discussions.
Data Availability
Derived data supporting the findings of this study are available from the corresponding author
24
References
1 A. Abbott et al., Chemical Communications (2003) 70.
2 A. Abbott et al., Journal of the American Chemical Society 126 (2004) 9142.
3 Q. Zhang et al., Chemical Society Reviews 41 (2012) 7108.
4 E. Smith, A. Abbott, and K. Ryder, Chemical Reviews 114 (2014) 11060.
5 X. Ge et al., Journal of Materials Chemistry a 5 (2017) 8209.
6 B. B. Hansen et al., Chemical Reviews 121 (2021) 1232.
7 L. Kollau et al., Chemical Communications 54 (2018) 13351.
8 M. Martins, S. Pinho, and J. Coutinho, Journal of Solution Chemistry 48 (2019) 962.
9 S. Kaur, A. Malik, and H. K. Kashyap, Journal of Physical Chemistry B 123 (2019) 8291.
10 S. Kaur, A. Gupta, and H. K. Kashyap, Journal of Physical Chemistry B 124 (2020) 2230.
11 S. Fryars et al., Journal of Electroanalytical Chemistry 819 (2018) 214.
12 F. C. Zhen et al., Journal of Physical Chemistry B 124 (2020) 1025.
13 Q. Xu et al., Chemical Physics Letters 708 (2018) 48.
14 L. Millia et al., Solid State Ionics 323 (2018) 44.
15 C. L. Boldrini et al., Energy Technology 5 (2017) 345.
16 R. K. Gautam, A. Chatterjee, and D. Seth, Journal of Molecular Liquids 280 (2019) 399.
17 S. S. Hossain, and A. Samanta, Journal of Physical Chemistry B 121 (2017) 10556.
18 N. Subba et al., Journal of Physical Chemistry B 123 (2019) 9212.
19 K. Mukherjee et al., Journal of Chemical Physics 149, 124501 (2018)
20 E. Tarif et al., Journal of Chemical Sciences 131, 43 (2019)
25
22 S. N. Tripathy et al., Journal of Chemical Physics 142, 184504 (2015)
23 A. Faraone et al., Journal of Physical Chemistry B 122 (2018) 1261.
24 D. Reuter et al., Physical Chemistry Chemical Physics 21 (2019) 6801.
25 F. Kremer, and A. Schönhals, Broadband Dielectric Spectroscopy Springer, Berlin (2002),
26 A. Jani, T. Sohier, and D. Morineau, Journal of Molecular Liquids 304, 112701 (2020)
112701.
27 O. Hammond, D. Bowron, and K. Edler, Angewandte Chemie-International Edition 56 (2017)
9782.
28 H. Passos et al., Acs Sustainable Chemistry & Engineering 4 (2016) 2881.
29 Y. Dai et al., Food Chemistry 187 (2015) 14.
30 A. Yadav et al., Fluid Phase Equilibria 367 (2014) 135.
31 X. Meng et al., New Journal of Chemistry 40 (2016) 4492.
32 C. Ma et al., Chemical Society Reviews 47 (2018) 8685.
33 P. Kumari et al., Acs Omega 3 (2018) 15246.
34 D. Lapena et al., Fluid Phase Equilibria 492 (2019) 1.
35 E. Posada et al., Journal of Molecular Liquids 276 (2019) 196.
36 M. Roldan-Ruiz et al., Journal of Molecular Liquids 284 (2019) 175.
37 R. Ahmadi et al., Physical Chemistry Chemical Physics 20 (2018) 18463.
38 O. Hammond et al., Journal of Physical Chemistry B 121 (2017) 7473.
39 L. Percevault et al., Journal of Physical Chemistry B 124 (2020) 9126.
40 I. Delso et al., Journal of Molecular Liquids 290, Unsp 111236 (2019) 111236.
41 N. López-Salas et al., ACS Sustainable Chemistry & Engineering 8 (2020) 12120.
26
43 L. D. Weng, and M. Toner, Physical Chemistry Chemical Physics 20 (2018) 22455.
44 L. Gontrani et al., Physical Chemistry Chemical Physics 20 (2018) 30120.
45 V. Agieienko, and R. Buchner, Physical Chemistry Chemical Physics 22 (2020) 20466.
46 E. Posada et al., Physical Chemistry Chemical Physics 19 (2017) 17103.
47 K. Shahbaz et al., Journal of Applied Sciences 10 (2010) 3349.
48 P. Lopez-Porfiri, J. Brennecke, and M. Gonzalez-Miquel, Journal of Chemical and
Engineering Data 61 (2016) 4245.
49 S. Havriliak, and S. Negami, Journal of Polymer Science Part C-Polymer Symposium (1966)
99.
50 A. T. Celebi, T. J. H. Vlugt, and O. A. Moultos, Journal of Physical Chemistry B 123 (2019)
11014.
51 G. Adam, and J. H. Gibbs, Journal of Chemical Physics 43 (1965) 139.
52 R. Bohmer et al., Journal of Chemical Physics 99 (1993) 4201.
53 F. Alvarez, A. Alegria, and J. Colmenero, Physical Review B 44 (1991) 7306.
54 M. D. Ediger, Annual Review of Physical Chemistry 51 (2000) 99.
55 L. Berthier et al., Science 310 (2005) 1797.
56 M. Arndt et al., Physical Review Letters 79 (1997) 2077.
57 R. Richert, Annual Review of Physical Chemistry, Vol 62 62 (2011) 65.
58 D. Morineau, Y. D. Xia, and C. Alba-Simionesco, Journal of Chemical Physics 117 (2002)
8966.