HAL Id: tel-02614256
https://tel.archives-ouvertes.fr/tel-02614256
Submitted on 20 May 2020
HAL is a multi-disciplinary open access archive for the deposit and dissemination of sci-entific research documents, whether they are pub-lished or not. The documents may come from teaching and research institutions in France or abroad, or from public or private research centers.
L’archive ouverte pluridisciplinaire HAL, est destinée au dépôt et à la diffusion de documents scientifiques de niveau recherche, publiés ou non, émanant des établissements d’enseignement et de recherche français ou étrangers, des laboratoires publics ou privés.
Understanding and use of sustainable performance
measures in small and medium firms : the impact of
family involvement
Pedro Mamede
To cite this version:
Pedro Mamede. Understanding and use of sustainable performance measures in small and medium firms : the impact of family involvement. Business administration. Université PanthéonSorbonne -Paris I, 2019. English. �NNT : 2019PA01E043�. �tel-02614256�
UNIVERSITE PARIS I- PANTHEON SORBONNE
Institut d’Administration des Entreprises de Paris
École doctorale de Management Panthéon-Sorbonne - ED 559
Equipe de Recherche GREGOR - EA 2474
UNDERSTANDING AND USE OF
SUSTAINABLE PERFORMANCE
MEASURES IN SMALL & MEDIUM FIRMS:
THE IMPACT OF FAMILY INVOLVEMENT
THESE
présentée et soutenue publiquement le 04 Novembre 2019
en vue de l’obtention du
DOCTORAT EN SCIENCES DE GESTION
par
Pedro MAMEDE
JURY Directeur de recherche : José ALLOUCHE
Professeur Émérite, IAE de Paris, Université Paris 1 Panthéon -Sorbonne
Rapporteurs : Bruno AMANN
Professeur, Université de Toulouse 3
Jacques JAUSSAUD
Professeur, IAE des Pays de l´Ardour (Pau, Bayonne), Université de Pau et des Pays de l´Ardour
Suffragants : Gérard HIRIGOYEN
Professeur Émérite, Université Bordeaux 4
Geraldine SCHMIDT
Professeure, IAE de Paris, Université Paris 1 Panthéon -Sorbonne
L’université de PARIS I – Panthéon Sorbonne n’entend donner aucune approbation ni improbation aux opinions émises dans les thèses ; ces opinions doivent être considérées comme propres à leurs auteurs.
ACKNOWLEDGEMENTS
This dissertation was a long quest full of psychic and physical challenges, and which would not be possible without the unconditional support of several people to whom I am grateful. I would like to acknowledge and express my sincere gratitude to my supervisor Professor José Allouche. Firstly, for the acceptance of my thesis project and my condition as worker and student a few years ago. Secondly, for his constant guidance, support, motivation and knowledge sharing to my doctoral research. He encouraged me to work and increased my work whenever I needed. Finally, for his tenacity, flexibility and constant recall during these years. Without his constant support an suggestions, this dissertation would never have been completed.
I would like to thank Professor Bruno Amann, Professor Jacques Jaussaud, Profesor, Geraldine Schmidt and Professor Gérard Hirigoyen for accepting to be part of my dissertation committee and taking the time to read this dissertation. I am sure their feedback will be extremely valuable and contribute deeply to my future research. My special thanks for the valuable advices in pre-soutenance phase to Professor Bruno Amann and Professor Jacques Jaussaud. I am also very grateful to Professor Nuno Rosa Reis for his useful advice in Bibliometric methodology and Bibexcel® software use and Harris Jusufbegovic for his useful linguistic advices.
The completion of this dissertation will be not possible without the support of my company (Elevate Global Limited), namely the comprehensive attitude of my Europe coordinator Daniele Giomi. Also, the linguistic and critical analysis promote by my good friend Leonildo Munguambe so far but always available.
My doctoral research impacted my whole family lives, whithout them my work will be not complete. Firstly, I’m grateful to my wife Ana Paula who support me with her kindness and patience. Then, to my lovely daughters Ana & Sofia who surely are relieved to have more time with their father, but who have always been proud and support me with their unconditional love. I hope this work inspires them.
Finally, I would like to thank my parents, António & Alice and my loved sister, Dora, who always encourage and support my aims and goals.
This dissertation is dedicated to my wife Ana Paula, my beautiful daughters Ana & Sofia, and to my parents & sister.
TABLE OF CONTENTS
ACKNOWLEDGEMENTS... i
TABLE OF CONTENTS... iii
LIST OF TABLES ... vii
LIST OF FIGURES ... x
LIST OF ABBREVIATIONS ... xii
ABSTRACT ... xiii
1. CHAPTER 1 – INTRODUCTION ... 1
1. CORPORATE AND SUSTAINABLE DEVELOPMENT ... 2
1.1 Sustainable development a theoretical overview ... 2
1.2 From sustainable development to corporate sustainability ... 8
2. CORPORATE SUSTAINABILITY PERFORMANCE ... 14
2.1 Corporate performance ... 14
2.2 Sustainability and performance ... 19
3. SMALL AND MEDIUM ENTERPRISES IN PORTUGAL... 24
3.1 The role of Small and Medium Enterprises ... 24
3.2 Small and Medium Entreprises and sustainability performance ... 28
4. FAMILY FIRMS ... 31
4.1 Relevance of family firms ... 31
4.2 Definition of family fims ... 32
4.3 Family involvement and effect in firm performance ... 35
5. OVERVIEW OF THE DISSERTATION ... 38
5.1. Theoretical foundations and hypotheses ... 39
5.2. Addressed research gaps ... 47
5.2. Dissertation structure ... 49 5.3 Overview of essays ... 49 5.3.1 Essay 1 ... 49 5.3.2 Essay 2 ... 50 5.3.3 Essay 3 ... 51 5.3.4 Essay 4 ... 52
5.4.1 Key characteristics of essay 1 ... 53
5.4.2 Key characteristics of essay 2 ... 54
5.4.3 Key characteristics of essay 3 ... 55
5.4.4 Key characteristics of essay 4 ... 56
2. CHAPTER 2 – CORPORATE SUSTAINABILITY PERFORMANCE: A
BIBLIOMETRIC STUDY ... 72
ABSTRACT ... 74
1. INTRODUCTION ... 75
2. LITERATURE REVIEW... 77
2.1 An overview of corporate sustainability performance ... 77
2.2 Review of the literature on bibliometrics ... 80
3. METHODOLOGY ... 82
3.1 Sample ... 82
3.2 Method and Procedures ... 85
4. RESULTS ... 88
4.1 Distribution of articles ... 88
4.2 Citations analysis ... 93
4.3 Co-citations analysis ... 98
4.4 Keywords analysis ... 104
5. DISCUSSION AND CONCLUSION ... 112
5.1. Limitations and future research ... 113
REFERENCES ... 114
APPENDIX I: ... 123
APPENDIX II: ... 133
3. CHAPTER 3 – PERFORMANCE AND SUSTAINABILITY IN SME´S: TRENDS AND EVOLUTION... 135
ABSTRACT ... 137
1. INTRODUCTION ... 138
2. LITERATURE REVIEW... 140
2.1 An overview of corporate sustainability ... 140
2.2 Corporate sustainability in SMEs Context ... 141
2.3 SME´s and sustainability management ... 142
3. METHODOLOGY ... 144 3.1 Procedures ... 145 3.2 Sample ... 148 4. RESULTS ... 148 4.1 Distribution of Articles ... 148 4.2 Citations Analysis ... 149 4.3 Co-citations analysis ... 152
4.5 Lexical-thematic analysis ... 166
5. DISCUSSION AND CONCLUSIONS ... 169
5.1. Limitations and future research ... 170
REFERENCES ... 171
APPENDIX: ... 180
4. CHAPTER 4 – CORPORATE SUSTAINABILITY PERFORMANCE IN PORTUGAL: SMEs FAMILY AND NON-FAMILY BUSINESS DIFFERENCES AND DETERMINANTS ... 200
ABSTRACT ... 202
1. INTRODUCTION ... 203
2. LITERATURE REVIEW & HYPOTHESES ... 205
2.1 Family firms definition ... 205
2.2 SMEs and Corporate sustainability performance ... 207
2.3 Family involvement in firms theory and hypotesis ... 209
2.4 Link nature between CSP and CFP theory and hypotesis ... 213
3. METHODOLOGY ... 217
3.1 Sample and data sources ... 217
3.2 Data ... 221
3.3 Method ... 223
3.3.1 Matched paired method ... 223
3.3.2 Variables and Linear regression ... 225
4. RESULTS ... 228
4.1 Matched Paired results ... 228
4.2 Descriptive statistics ... 238
4.3 Multivariate analyses ... 240
5. DICUSSION & CONCLUSIONS ... 246
REFERENCES ... 250
APPENDIX: ... 260
5. CHAPTER 5 – SOCIOEMOTIONAL WEALTH IN PORTUGUESE FAMILY FIRM AND STAKEHOLDERS MANAGEMENT: INFLUENCES AND IMPACTS ON SUSTAINABILITY PERFORMANCE SYSTEMS - THE CASE STUDY OF MISTOLIN S.A. ... 265
ABSTRACT ... 267
1. INTRODUCTION ... 268
2.1 Family firms and stakeholders management ... 271
2.2 The Socioemotional wealth model in family firms ... 272
2.3 SEW influence in performance and hypothesis ... 275
3. METHODOLOGY ... 279
3.1 Case study selection ... 279
3.2 Data Collection ... 282
3.3 Data Analysis ... 283
4. RESULTS ... 286
4.1 Content Analysis ... 288
4.2 Linear Regression Analysis ... 297
5. DISCUSSION & CONCLUSIONS ... 305
REFERENCES ... 309
APPENDIX: ... 317
6. CHAPTER 6 – CONCLUSION ... 323
1. MAIN FINDINGS ... 324
2. CONTRIBUTION AND IMPLICATIONS ... 330
2.1 Contribution to corporate sustainability performance literature ... 330
2.3 Contribution to family business literature ... 332
2.4 Contribution to link nature between financial and sustainability performance literature ... 334
2.5 Contribution to stakeholder management theory literature ... 335
2.4 Methodological contribution ... 337
2.5 Managerial implications ... 338
3. LIMITATIONS AND AVENUES FOR FURTHER RESEARCH ... 339
3.1 Limitations of the research ... 339
3.3 Further research avenues ... 340
REFERENCES ... 342
LIST OF TABLES
TABLE 1.1 – MAIN STRUCTURAL COMPONENTS OF SUSTAINABLE DEVELOPMENT CONCEPT…..6
TABLE 1.2 – INSTITUTIONAL SUSTAINABLE DEVELOPMENT DEFINITIONS………...………….6
TABLE 1.3 – CORPORATE SUSTAINABILITY DEFINITIONS………...9
TABLE 1.4 – CORPORATE SUSTAINABILITY CONCEPTUAL EVOLUTION………10
TABLE 1.5 – SUSTAINABILITY ASPECTS………..11
TABLE 1.6 – PERFORMANCE DEFINITIONS………..14
TABLE 1.7 – PERFORMANCE MEASUREMENT SYSTEMS CONSTRUCTION……….15
TABLE 1.8 –EVOLUTION OF SME IN PORTUGAL (2011-2015)………...24
TABLE 1.9 –EMPLOYMENT IN SME AND LARGE COMPANIES IN PORTUGAL (2011-2015)………...25
TABLE 1.10 – SUSTAINABILITY INITIATIVES EVOLUTION IN PORTUGAL………..26
TABLE 1.11 - STRATEGIC MODELS IN SMES : PORTUGUESE CASE STUDIES……..……….29
TABLE 1.12 – DISSERTATION EPISTEMOLOGIC POSITION………..43
TABLE 1.13 – KEY CHARACTERISTICS OF ESSAY 1………...53
TABLE 1.14 – KEY CHARACTERISTICS OF ESSAY 2………...54
TABLE 1.15 – KEY CHARACTERISTICS OF ESSAY 3………...55
TABLE 1.16 – KEY CHARACTERISTICS OF ESSAY 4………...56
TABLE 2.1 – UNITED NATIONS SUSTAINABLE DEVELOPMENT INITIATIVES……….…82
TABLE 2.2 – DISTRIBUTION OF ARTICLES BY QUARTER OF TIME (1987-2015)………...84
TABLE 2.3 – DISTRIBUTION OF ARTICLES IN TERMS OF JOURNALS (1994-2015)………89
TABLE 2.4 – EVOLUTION OF ARTICLES IN JOURNALS AND ABS 2015………...91
TABLE 2.5 – ABS 2015 RANKING INTERPRETATION………...91
TABLE 2.6 – RESEARCH AREAS OF THE TEN AUTHORS WITH HIGHEST CITATION (1994-2015)………....92
TABLE 2.7 – CITATION FREQUENCY AUTHORS (1994-2015)……….94
TABLE 2.8 – CITATION FREQUENCY PER QUARTER (1994-2015)……….96
TABLE 2.9 – KEYWORDS ANALYSIS (1994-2015)………...105
TABLE 2.10 – MOST AUTHORS THEMES BY KEYWORDS (1994-2002)……..……….107
TABLE 2.11 – THEMES GENERATION………...123
TABLE 2.12 – ARTICLES SEARCH METHODOLOGY………..127
TABLE 2.13 – CITATION FREQUENCY COMPARISON 2013/2015 TO 2016/2018..………..133
TABLE 3.1 – LEXICAL REDUCTION STATISTICS (2011-2015)………..147
TABLE 3.2 – CITATION FREQUENCY 2004-2015………..151
TABLE 3.3 – WORD FREQUENCY (2004-2015)………..156
TABLE 3.4 – LEXICAL FORMS ASSOCIATED TO THE CLASS 1 BY DECREASED CHI2 (2004-2015)………..159
TABLE 3.5 – MAIN ABSTRACTS ASSOCIATED TO THE CLASS 1 BY DECREASED CHI2 (2004-2015)………..160
TABLE 3.6 – LEXICAL FORMS ASSOCIATED TO THE CLASS 2 BY DECREASED CHI2 (2004-2015)………..161
TABLE 3.7 – MAIN ABSTRACTS ASSOCIATED TO THE CLASS 2 BY DECREASED CHI2
(2004-2015)………..162
TABLE 3.8 – LEXICAL FORMS ASSOCIATED TO THE CLASS 3 BY DECREASED CHI2 (2004-2015)………..163
TABLE 3.9 – MAIN ABSTRACTS ASSOCIATED TO THE CLASS 3 BY DECREASED CHI2 (2004-2015)………..164
TABLE 3.10 – LEXICAL FORMS ASSOCIATED TO THE CLASS 4 BY DECREASED CHI2 (2004-2015)………..165
TABLE 3.11 – MAIN ABSTRACTS ASSOCIATED TO THE CLASS 4 BY DECREASED CHI2 (2004-2015)………..166
TABLE 3.12 – THEMES WEIGHT EVOLUTION……….168
TABLE 3.13 - LEXICAL FORMS ASSOCIATED TO THE CLASS 4 BY DECREASED CHI2 (2004-2015)………..180
TABLE 3.14 -LEXICAL FORMS ASSOCIATED TO THE CLASS 2 BY DECREASED CHI2 (2004-2015)………..181
TABLE 3.15 -LEXICAL FORMS ASSOCIATED TO THE CLASS 2 BY DECREASED CHI2 (2004-2015)………...……...182
TABLE 3.16- LEXICAL FORMS ASSOCIATED TO THE CLASS 3 BY DECREASED CHI2 (2004-2015)………..183
TABLE 3.17 - MAIN ABSTRACTS ASSOCIATED TO CLASSES BY DECREASED CHI2 (2004-2015)……….….184
TABLE 3.18 – THEMES AND LEXICAL FORMS (2004-2015)……...…….185
TABLE 3.19 - ARTICLES INCLUDED IN OUR STUDY……….190
TABLE 4.1 – SAMPLE OF FAMILY DEFINITIONS………206
TABLE 4.2 – RELATIONSHIP BETWEEN CSP/ CFP………..213
TABLE 4.3 – GDP GROWTH RATE OF PORTUGAL (IN REAL TERMS), BY CIVIL YEAR 2007 – 2016………...217
TABLE 4.4 – QUESTIONNAIRE DATA COLLECTED VERSIONS 1 AND 2………...220
TABLE 4.5 - FIRMS SECTOR SAMPLE………222
TABLE 4.6 - FIRMS SAMPLE………222
TABLE 4.7 – FINAL MEASURES AND DATA FOR THE YEARS 2012 & 2016………..224
TABLE 4.8 – DEFINITION OF VARIABLES………226
TABLE 4.9 – DEFINITION OF VARIABLES HYPOTHESIS 3 & 4………226
TABLE 4.10 – EXPECTED SIGN OF VARIABLES……….………227
TABLE 4.11 – COMPARATIVE FINANCIAL PERFORMANCE BETWEEN FB AND NFB………230
TABLE 4.12 – COMPARATIVE ENVIRONMENTAL PERFORMANCE BETWEEN FB AND NFB……..231
TABLE 4.13 – COMPARATIVE SOCIAL PERFORMANCE BETWEEN FB AND NFB………...233
TABLE 4.14 – FAMILY VERSUS NON-FAMILY FIRM PERFORMANCE COMPARISONS STUDIES...235
TABLE 4.16 – PEARSON CORRELATION MATRIX FOR DEPENDENT AND EXPLANATORY
VARIABLES (YEAR= 2012 & 2016)……….239
TABLE 4.17 – MULTICOLLINEARITY DIAGNOSTIC VIF VALUES (HYPOTHESIS 2)………...240
TABLE 4.18 – MULTICOLLINEARITY DIAGNOSTIC VIF VALUES (HYPOTHESIS 3 & 4)………240
TABLE 4.19 – LINEAR REGRESSION RESULTS (YEAR = 2012)……….241
TABLE 4.20 – LINEAR REGRESSION RESULTS (YEAR = 2016)……….242
TABLE 4.21 – LINEAR REGRESSION SIZE & INDUSTRY EFFECT (YEAR = 2012)……….243
TABLE 4.22 – LINEAR REGRESSION SIZE & INDUSTRY EFFECT (YEAR = 2016)……….244
TABLE 4.23 – SUMMARY OF LINKS BETWEEN VARIABLES………...245
TABLE 4.24 – SUMMARY OF RESULTS……….245
TABLE 4.25 – MATCHED PAIRED COMPANIES – FINANCE MEASURES………...260
TABLE 4.26 – MATCHED PAIRED COMPANIES – ENVIRONMENTAL MEASURES………..262
TABLE 4.27 – MATCHED PAIRED COMPANIES – SOCIAL MEASURES………..263
TABLE 4.28 – REGRESSION ANALYSIS COMPANIES SAMPLE…….………...264
TABLE 5.1 – SEW PERSPECTIVES………..274
TABLE 5.2 – PERFORMANCE OUTCOMES EFFECTS………..275
TABLE 5.3 – CASE STUDY QUALITY CHARACTERISTICS………...279
TABLE 5.4 – MAIN SHARES TRANSMISSION (1992-2012)………...……… 281
TABLE 5.5 – LEXICAL REDUCTION STATISTICS………283
TABLE 5.6 – DEFINITION OF VARIABLES………...……….284
TABLE 5.7 – EXPECTED SIGN OF VARIABLES………285
TABLE 5.8 – CONSUMPTION ANNUAL RATE OF CHANGE 2012-2016 (BASE YEAR=2012)…………287
TABLE 5.9 – SEW CONCEPT (WORD FREQUENCY > 9 OCCURRENCE)………...……..289
TABLE 5.10 –LEXICAL FORMS BY DECREASED CHI2 PER CLASS (N = 101)………293
TABLE 5.11 – FREQUENCY DISTRIBUTION OF THEMES (FREQUENCY > 78)………..……297
TABLE 5.12 – PEARSON CORRELATION MATRIX FOR DEPENDENT AND EXPLANATORY VARIABLES (YEARS= 2012 TO 2016)……….298
TABLE 5.13 – LINEAR REGRESSION RESULTS ROA ~ENV (2012 TO 2016)………299
TABLE 5.14 – LINEAR REGRESSION RESULTS ROA ~ SOC (2012 – 2016)………..300
TABLE 5.15 – LINEAR REGRESSION RESULTS ROE ~ ENV (2012 – 2016)…...……….301
TABLE 5.16 – LINEAR REGRESSION RESULTS ROE ~SOC (2012 – 2016)……….………...301
TABLE 5.17 – LINEAR REGRESSION RESULTS ROIC ~ENV (2012 – 2016)………..302
TABLE 5.18 – LINEAR REGRESSION RESULTS ROIC ~SOC (2012 – 2016)………..303
TABLE 5.19 – SIGN OF VARIABLES…...………304
TABLE 5.20 - LEXICAL FORMS ASSOCIATED TO THE CLASS 1 BY DECREASED CHI2………320
TABLE 5.21 - LEXICAL FORMS ASSOCIATED TO THE CLASS 2 BY DECREASED CHI2………321
TABLE 5.22 - LEXICAL FORMS ASSOCIATED TO THE CLASS 3 BY DECREASED CHI2………321
LIST OF FIGURES
FIGURE 1.1 – SUSTAINABLE DEVELOPMENT INITIATIVES………...……….4
FIGURE 1.2 – SMART PYRAMID………...16
FIGURE 1.3 – PERFORMANCE MEASUREMENT MATRIX………...17
FIGURE 1.4 – BALANCED SCORECARD MATRIX……….17
FIGURE 1.5 - PERFORMANCE PRISM………...18
FIGURE 1.6 - SUSTAINABILITY GLOBAL MODEL…………...……….20
FIGURE 1.7 - SUSTAINABLE STAKEHOLDERS MODEL………..21
FIGURE 1.8 - ICHEM FRAMEWORK..………...22
FIGURE 1.9 - SUSTAINABILITY BALANCED SCORECARD………...……….23
FIGURE 1.10 – FAMILY FIRMS STRUCTURES………...32
FIGURE 1.11 – KNOWLEDGE DESIGN AND ESPISTEMOLOGICAL PARADIGMS………...39
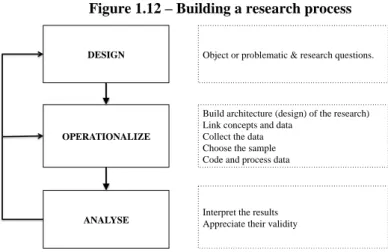
FIGURE 1.12 – BUILDING A RESEARCH PROCESSS……….………....40
FIGURE 1.13 – RESEARCH QUESTIONS………..42
FIGURE 1.14 – RESEARCH HYPOTHESES………...44
FIGURE 1.15 - THEORITICAL SUPPORT TO DISSERATION RESEARCH QUESTION……….….44
FIGURE 1.16 – LOGICAL RESEARCH QUESTIONS SEQUENCE………..48
FIGURE 1.17 – GRAPHICAL STRUCTURE………...49
FIGURE 2.1 – DISTRIBUTION OF ARTICLES PROCEDURE……….85
FIGURE 2.2 – CITATION PROCEDURE……….86
FIGURE 2.3 – CO-CITATION PROCEDURE………..87
FIGURE 2.4 – KEYWORDS PROCEDURE……….87
FIGURE 2.5 – DISTRIBUTION OF ARTICLES IN TERMS OF TIME PERIOD (1994-2015)……….93
FIGURE 2.6 – DISTRIBUTION OF ARTICLES BY INSTITUTION’S COUNTRIES (1994-2015)………….93
FIGURE 2.7 –CITATION/CO-CITATION ANALYSIS FOR MOST INFLUENTIAL WORKS (1994-2002)..98
FIGURE 2.8 –CITATION/CO-CITATION ANALYSIS FOR MOST INFLUENTIAL WORKS (2003-2012)..99
FIGURE2.9–CITATION/CO-CITATION ANALYSIS FOR MOST INFLUENTIAL WORKS (2013-2015)..103
FIGURE 2.10 –CO-OCCURRENCE AUTHORS THEMES IN KEYWORDS (1994-2002)………..108
FIGURE 2.11 – CO-OCCURRENCE AUTHORS THEMES IN KEYWORDS (2003-2012)………...109
FIGURE 2.12 – CO-OCCURRENCE AUTHORS THEMES IN KEYWORDS (2013-2015)………...…110
FIGURE 2.13- DISTRIBUTION OF ARTICLES BY INSTITUTION’S COUNTRIES COMPARISON 2013/2015 TO 2016/2018……….133
FIGURE 2.14 - CITATION/CO-CITATION ANALYSIS FOR MOST INFLUENTIAL WORKS (2016-2018)... ...134
FIGURE 3.1 – DISTRIBUTION OF ARTICLES (2004-2015)………..146
FIGURE 3.2 – DISTRIBUTION OF ARTICLES (2004-2015)………..147
FIGURE 3.3 – DISTRIBUTION OF ARTICLES (2004-2015)………..149
FIGURE 3.6- HIERARCHICAL CLASSIFICATION DESCENDING DENDOGRAM………...180
FIGURE 5.1 – CONCEPTUAL MODEL……….276
FIGURE 5.2 – SINGLE CASE SCHEME………280
FIGURE 5.3 – MISTOLIN S.A. - ORGANIZATIONAL CHART…………...………...282
FIGURE 5.4 – MISTOLIN S.A. MAIN OBJECTIVES………...………287
FIGURE 5.5 – WORD FACTORIAL ANALYSIS OF CORRESPONDENCE……….…….292
LIST OF ABBREVIATIONS
APA: Agência Portuguesa do Ambiente
BSC: Balanced Scorecard
CEO: Chief Executive Officer
CFP: Corporate Financial Performance
CS : Corporate Sustainability
CSP. Corporate Sustainability Performance CSR : Corporate Social Responsibility
EU: European Union
EMS: Environmental Management System
FB: Family Business
IES: Informação Empresarial Simplificada
INE: Instituto Nacional de Estatística
GDP: Gross Domestic Product
GEP: Gabinete de Estratégia e Planeamento GRI: Global reporting Initiative
KPI: Key Performance Indicators
NFB: Non-Family Business
NGO: Non-Governmental Organization
RBV: Resource-Based View
SEW: Socioemotional Wealth
SIC: Standard Industrial Classification
SME: Small and Medium Enterprise
SPMS: Sustainability Performance Management System
SD: Sustainable Development
TBL: Triple Bottom Line
UN: United Nations
UNEP: United Nations Environment Programme
WCED: World Commission Environment and Development
ABSTRACT
From a corporate sustainability performance lens, the purpose of this thesis is to investigate the implications of family involvement in the understanding and use of sustainable performance measures in SMEs with an emphasis in Portuguese family firms. First, a bibliometric study has been used to map the relevant knowledge network on sustainability performance measures and measurement field, retrieving 1271 articles from 1987 to 2015. Second, a bibliometric and abstract lexical analysis were used on 63 SMEs article. Corporate sustainability performance studies showed specificities of core theoretical knowledge and the greater operational SMEs focus. Third, using matched paired methodology and multivariate approach, we focus 65 Portuguese SMEs from 2012 and 2016. The main findings show a consistent pattern that corporate family involvement influence financial performance but have a mixed effect on environmental and social performance. It was also be provide evidence of positive link between social and financial performance. Fourth, a case study of a sustainable oriented family owned SME shows that a restricted socioemotional view is dominant in top managers discourses and in their managerial actions, privileging primary stakeholders’ engagement. Finally, it was provided evidence of positive link between environmental and financial performance in a dual managed context.
Keywords:
Sustainability, performance, corporate sustainability, family business, Portuguese SME, stakeholder theory, socio-emotional wealth (SEW), Dual Board effect, bibliometric analysis, lexical study, matched pair analysis, content analysis, case study.
1. CHAPTER 1 – INTRODUCTION
1. CORPORATE AND SUSTAINABLE DEVELOPMENT
1.1 Sustainable development a theoretical overview
Over the last decades, a great evolution of sustainable strategies and performance implementations has been perceived in the businesses research field (Bonacchi & Rinaldi 2007; Searcy 2012). Indeed, companies face new challenges resulting from various economic, social, environmental and technological phenomena. Different pressures from internal and external stakeholders pushed managers to reflect and adapt their management to a consistent implementation of sustainable actions (Sirgy, 2002; Harrison and Freeman, 1999). In this sense, businesses integrating pressures and expectations have found answers in the concept of sustainable development (Schaltegger et al., 2003; Hubbard, 2009).
The foundation of the sustainable development concept can be found on multiple theological reflections on the place of humankind in the world (Mebratu, 1998). However, the first structured roots of the problem of sustainable development are found in Robert Thomas Malthus's "Essay on the Principle of Population and its Effect on the Future Development of Societies" in 1798 (Barkemeyer et al., 2011). This theory of population enclosed the environmental limits with an impact on economic development (Mebratu, 1998).
The Club of Rome performed the first multi-stakeholder panel focusing on eco-development. This organization, which was established in 1968 to examine the complexity of humanity challenges stimulated the studies of environmental degradation (Araújo, 2006). Thus, the book "The Limits to Growth" (Meadows et al., 1972), on the initiative of this club, begins the debate on the impact of pollution and human productive activity on future generations.
This publication concluded that only concerted and united action could achieve the necessary state of equilibrium for human survival (Araújo, 2006). On the same sense, Schumacher (1973) published “Small is beautiful, Economics as if People Mattered” updating a new post-industrial governance highlighting the heavy degradation of natural resources based on an oversized and exaggerated consumption pattern. The economy is seen as over organized to destroy the planet (Mebratu, 1998).
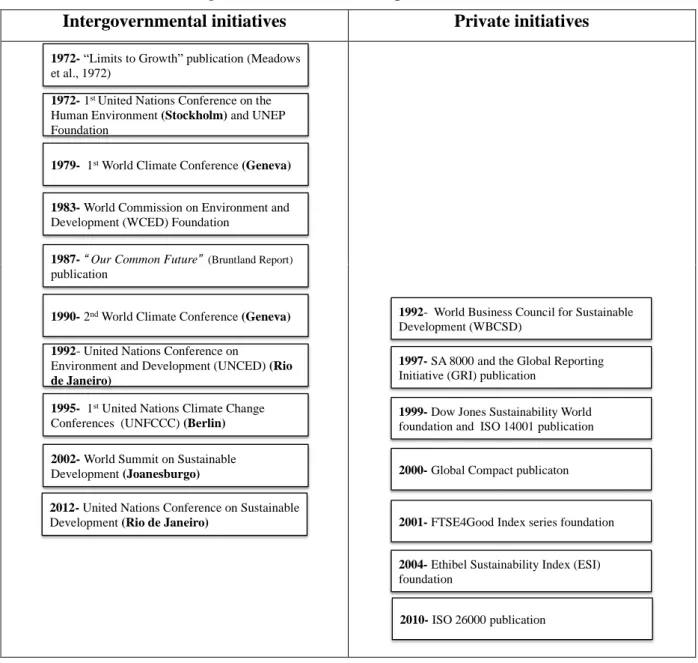
In 1972, the first United Nations Conference on the Human Environment was held in Stockholm. Then, a process of awareness and global mobilization in defence of environmental issues began. The debate focused on the establishment of a program to contain and prevent industrial pollution within a framework of balancing priorities between economic development and essential environmental protection. This conference resulted in the creation of the United Nations Environment Programme (UNEP), whose mission is to promote partnerships for environmental conservation, informing and empowering nations to improve quality of life without compromising future generations (insert reference).
In 1987, from the World Commission on Environment and Development chaired by Gro Harlem Brundtland, an effective determination emerges to address the challenges between development and the environment. Consolidating the commission's conclusions, the Brundtland Report (1987) became a key document as a guideline for future strategies for economic growth and human development. The environmental degradation is understood as a result of industrial development and it becomes an issue intrinsically associated with the economic and ecological decline (Daly, 1991; Barkemeyer et al., 2011). For the first time, the world assumes that it is no longer makes sense to disassociate environmental protection policies from the necessary integration with the development of populations, thus social inclusion (Blasco, 2006). The growth limitation recommendations advocated by ‘The Limits to Growth” (Meadows et al., 1972) have been replaced by the concept of "sustainable development".
With the Rio Summit, also known as the 1992 Earth Summit, global awareness of the need to establish a truly sustainable global development policy was consolidated, which should be based on three pillars (Blasco, 2006):
- Social Equity,
- Environmental Protection and, - Economic Prosperity.
In Johannesburg (Rio +10) and Rio 2012 (Rio +20), it was explicit the need for integration of companies as agents for sustainable development, namely through accountability and best sustainable operational practice. Even the private sector started in early 90´s to be aware and active on sustainability level (for example World Business Council for Sustainable Development Foundation), private business actions on this field still raise academic debates.
Figure 1.1 – Sustainable Development initiatives
Intergovernmental initiatives Private initiatives
Thus, the concept of sustainable development, far from being consensual, is marked by political and scientific opposition (Barkemeyer et al., 2011). The concept resulting from political consensus has matured over the years, but doubts remain about its applicability and the logic of the concept (Scheeffer, 2012).
Sustainable development enclosed a degree of contradiction and ideologic debate, which leads to a diversity of interpretation (Barbier, 1987). A great number of definitions have been raised in the last decades creating energetic discussions about definitions and interpretations, including different degrees of ecocentric and anthropocentric perspectives and change needed (Ciegis et al., 2009; Imran et al., 2014; Duran et al., 2015).
1972- “Limits to Growth” publication (Meadows et al., 1972)
1972- 1st United Nations Conference on the Human Environment (Stockholm) and UNEP Foundation
1979- 1st World Climate Conference (Geneva)
1983- World Commission on Environment and Development (WCED) Foundation
1987- “ Our Common Future” (Bruntland Report)
publication
1990- 2nd World Climate Conference (Geneva)
1992- United Nations Conference on
Environment and Development (UNCED) (Rio de Janeiro)
1995- 1st United Nations Climate Change Conferences (UNFCCC) (Berlin) 2002- World Summit on Sustainable Development (Joanesburgo)
2012- United Nations Conference on Sustainable Development (Rio de Janeiro)
1992- World Business Council for Sustainable Development (WBCSD)
1997- SA 8000 and the Global Reporting Initiative (GRI) publication
1999- Dow Jones Sustainability World foundation and ISO 14001 publication
2000- Global Compact publicaton
2001- FTSE4Good Index series foundation
2004- Ethibel Sustainability Index (ESI) foundation
For Barbier (1987), sustainable economic development underlines criteria that differ from conventional economic consensus, new analytical approach is needed. In this sense, four criteria to define sustainable development are highlighted by this author:
1. Sustainable economic development is intrinsically coupled with the development of society and cannot be separated from the social, cultural or ecological changes;
2. The concept has a quantitative dimension associated with increases of physical and social well-being;
3. Qualitative dimension is linked to the long-term ecological, social and cultural structure to supported economic activity;
4. Finally, performance measurement under the concept is not easy to design and fully capture, since the economic gain is no more unique criteria.
For Daly (1991), sustainable development face quantitative and qualitative challenges. From a quantitative angle, population and consumption growth pressed natural capital to limits of non-renew. In another angle, the communitarian concept of wealth in a full world scope (developed and undeveloped countries) is based on the neo-classical vision of economic growth. The economic capital must remain the same to guarantee a hypothetical equal standard to the future generations as proposed by the Brundtland Report (1987). Considering the population rate increase, Daly (1991) states that the qualitative concept needs e rethinkin in order to erase the psychologic link between the economic growth and sustainable development. In fact, the semantics tends to link development to conventional economic growth and consumptions, associated with social welfare (Lélé, 1991). Sustainable development appears controversial due to the broad scope of the term, but also because it put at the same level three apparently opposite dimensions.
Gladwin et al. (1995) observe that new paradigms tend to emerge from entirely new fundamentals without clear standards and definition. However, for these authors, the main components of sustainable development focus is a process of “achieving human development in an inclusive, connected, equitable, prudent, and secure manner” (Gladwin et al., 1995, p. 878).
Table 1.1 – Main structural components of Sustainable Development concept
Components Definitions
Inclusiveness Implies human development over time and space.
Connectivity Entails an embrace of ecological, social, and economic interdependence.
Equity Suggests inter- generational, intragenerational, and interspecies fairness.
Prudence Connotes duties of care and prevention: technologically, scientifically,
and politically.
Security Demands safety from chronic threats and protec- tion from harmful
disruption.
Source: Gladwin, T. N., Kennelly, J. J., & Krause, T. S. (1995)
Institutional involvement, as exposed in table 1.2, in the last decades had ensured an effective definition of the social, economic, and environmental objectives set by the society. In this sense, a great work to develop global assessment methods and metrics for sustainability is in implementation, extending challenges to the private sector (Ukko et al., 2018).
Table 1.2 –Institutional Sustainable Development definitions
Institutions Definitions
WECD (1987)
“Sustainable development is development that meets the needs of the present without compromiaing the ability of future generations to meet their own needs.” (WECD, 1987, p. 54)
UNESCO
https://en.unesco.org/themes/educ
ation-sustainable-development/what-is-esd/sd
“There are four dimensions to sustainable development – society, environment, culture and economy – which are intertwined, not separate. Sustainability is a paradigm for thinking about the future in which environmental, societal and economic considerations are balanced in the pursuit of an improved quality of life” (accessed in 2019.02.20)
World bank (1992) “Sustainable development is development that lasts” (World
Development Report, 1992, p 332)
The Food and Agriculture Organization of the United Nations (FAO)
http://www.fao.org/3/ai388e/AI38 8E05.htm
"The management and conservation of the natural resource base, and the orientation of technological and institutional change in such a manner as to ensure the attainment and continued satisfaction of human needs for present and future generations. Such sustainable development (in the agriculture, forestry, and fisheries sectors) conserves land, water, plant and animal genetic resources, is environmentally non-degrading,
technologically appropriate, economically viable and socially
acceptable". (Accessed in 2019.02.20) World Conservation Union
(IUCN), World Wildlife Fund for Nature (WWF) & United Nations Environment Programme (UNEP) (1992)
“Mean improving the quality of human life while living within the carrying capacity of supporting ecosystems.”
In our study, we start from the definition of the Brundtland Report (1987), as a genesis of conceptualization. This document emphasizes the following assumptions in sustainable development operationalization:
- The balance between humanity and nature, in which one seeks to satisfy the aspirations of the present without favouring some of the parties (Gladwin et al., 1995; Barkemeyer et al., 2011);
- Inter-generational justice establishing temporal equity (Sikdar, 2003);
- The world is an interconnected and inter-communicating system (Araújo, 2006), and the responses must be global and common (Blasco, 2006);
- The interconnection between economic, environmental and social dimensions (Hubbard, 2009);
- Fundamentalism of the economic dimension as a source of development and subordination of environmental and social dimensions (Epstein, 2001; Schaltegger, 2003; Bansal, 2005).
Thus, the definition of sustainable development was influenced by the political and sciences debates and is still in evolution with new contributions in present times (Barkemeyer et al., 2011). The evolution of sustainable development and its applicability to firms raises new research questions on the business case and it applicability to a more smaller scale (van Marrewijk, 2003) through the concept of corporate sustainability.
1.2 From sustainable development to corporate sustainability
At the firm level, sustainable development is associated with corporate sustainability (CS), but no widely accepted definitions exist (Searcy, 2012).
Two pillars influence CS framework. Firstly, a dominant vision that company is a system that transforms resources into products and services within an economic perspectives dominance (Baumgartne & Rauter; 2017; Hahn et al., 2018). Secondly, as a human system based, firms depend on relationships with several other entities (Gavare & Johansson, 2010). Thus, firms move in a complex set of forces that lead to more or less economically, socially or environmentally strategies focused (Alhaddi, 2015; Hahn et al., 2018).
Beyond the business case, authors find a paradox perspective marked by tensions in corporate sustainability concept (Montiel & Delgado- Ceballos, 2014; Hahn et al., 2018). Firstly, sustainability can be seen as a too high and complex objective to single firm-level (Lankoski, 2016). In another way, conflicting management dimensions appear as immobilizers and destructive of values creation (Linnenluecke & Griffiths, 2010; Hahn et al., 2018). Also, stakeholder’s contradictory needs and expectations may conduct to impediments in the pursuit and implementation of corporate sustainability (Linnenluecke & Griffiths, 2010). Facing these different perspectives, several definitions appear in the academic literature based on ecological concern (Shrivastava, 1995) or as social responsibility (Carroll, 1999), or integrating corporate economic activities with environmental and social concerns (Dyllick & Hockerts, 2002; Sikdar, 2003; van Marrewijk, 2003). The theoretical evolution from technocentric and ecocentric to sustaincentric paradigm creates a growing focus on the field delimitation search (Gladwin et al., 1995). However, for Montiel & Delgado-Ceballos (2014), no standardized definitions of corporate sustainability exist. Observing discussions about corporate sustainability in the practitioner and research literature, we also find the use of ‘‘corporate social responsibility’’ or “corporate environmental responsibility” as synonyms of corporate sustainability (Montiel & Delgado-Ceballos 2014). This diversity can be seen as the result of debate richness and importance of the field in management science (Rego et al., 2017).
Table 1.3 – Corporate Sustainability Definitions
Author´s Definitions
International Institute for Sustainable Development (1992)
Adopting business strategies and activities that meet the needs of the enterprise and its stakeholders today while protecting, sustaining, and enhancing the human and natural resources that will be needed in the future’’ (p. 1).
Dyllick and Hockerts (2002)
Meeting the needs of a firm’s direct and indirect stakeholders (such as shareholders, employees, clients, pressure groups, communities, etc.) without compromising its ability to meet the needs of future stakeholders as well (p. 131).
Szekely and Knirsch (2005)
Sustaining and expanding economic growth, shareholder value, prestige, corporate reputation, customer relationships, and the quality of products and services. It also means adopting and pursuing ethical business practices, creating sustainable jobs, building value for all of the company’s stakeholders, and attending to the needs of the underserved. (p. 628)
Neubaum and Zahra (2006) The ability of a firm to nurture and support growth over time by effectively meeting the expectations of diverse stakeholders. (p. 121)
Lo (2010)
Is defined as the integration of financial benefit, environmental protection, and social responsibility into business operations and management protection, and social responsibility into business operations and management (p. 311).
Strand (2014)
Corporate sustainability refers to the integration of economic,
environmental, and social considerations on the part of corporations (p. 688).
Schaltegger & Burritt (2015)
All activities which design, measure, analyse and improve environmental, social and economic activities in order to firstly create a sustainable development of the organisation itself, and secondly to enable the
company to contribute to the sustainable development of the economy and society as a whole. (p.2)
Schaltegger, Hansen, & Lüdeke-Freund (2016)
Integrative and competitive solutions by either radically reducing negative and/or creating positive external effects for the natural environment and society (p.3)
Source: Author
To clarify the origin of the concept of corporate sustainability, Wilson (2003) analysed the contribution of several frameworks applied to firms. The author concludes that the corporate sustainability definition must be understood as an evolving concept which derives from economics, ecology, social justice, moral philosophy, strategic management and business law disciplines.
Table 1.4 – Corporate sustainability conceptual evolution
Concept Contribution (s)
SUSTAINABLE DEVELOPMENT
Boundaries of the subject matter and description of a common societal goal:
- Define environmental, social, and economic dimensions performance.
- Provides a common societal goal for corporations, governments, and civil society.
CORPORATE SOCIAL RESPONSIBILITY
Ethical arguments as to why corporations should work towards sustainability goals:
- Society, in general, believes in sustainable development and corporations have an ethical obligation to help society move in that direction.
STAKEHOLDER THEORY
Business arguments as to why corporations should work towards sustainability goals
- In the own best economic interest, firms should work toward sustainable development strengthening the relationship with their stakeholders.
CORPORATE
ACCOUNTABILITY THEORY
Ethical arguments as to why companies should report on sustainability performance
- Define the nature of the relationship between corporate managers and society.
Source: Adapted from Wilson (2003)
Thus, corporate sustainability as construct has been shaped by the contributions of several disciplines and theoretical framework.
However, "Triple-Bottom-Line" approach conceptualized by Elkington (Dahlsrud, 2008; Alhaddi, 2015; Hussain et al., 2018) appears as the most consensual in the operationalization of sustainable development by companies. Thus, this triple vision supposes a balance between the three dimensions of sustainability (Labuschagne, Brent, & van Erck, 2004; Tregidga & Milne, 2006; Seuring, 2008; Nasiri et al., 2018):
- Economic, based on prosperity as a result of wealth generation, through the creation of tradable value in markets;
- Environmental, based on the preservation of biodiversity, as a result of the respect of the balance between human needs and the regenerative capacity of the environment;
- Social, based on equity, as a result of processes of inclusion of the poorest populations through access to universally accepted rights and freedoms.
This approach supports the integration of companies as fundamental agents of sustainability (Bakshi and Fiksel, 2003).
Distinct aspects concerning economic, ecological and social dimensions of sustainability may be incorporated in corporate strategic implementation (Baumgartner & Ebner, 2010).
Table 1.5 – Sustainability aspects
Dimensions Aspects
Economics
Innovation and technology Collaboration / Cooperation Knowledge management
Processes /Total Quality Management Product stewardship
Purchase/ Supply chain management Sustainability reporting
Environmental
Emissions into the air Emissions into the water Emissions into the ground
Waste and hazardous waste Biodiversity Environmental issues of the product
Social
Corporate governance Motivation and incentives Health and safety
Human capital development Basic human rights
Source: Adapted from Baumgartner & Ebner, (2010)
Although, the existence of normative, strategic and operational support of several frameworks, companies still face challenges to an effective sustainability implementation and integration (Engert et al., 2016). The diversity of sustainability aspects increases complexity and uncertainty in strategic processes. Also, the lack of experience and the different level of maturity influence a successful environmental and social integration (Baumgartner & Ebner, 2010). Finally, the lack of organizational culture that still maintains economic sustainability as the unique priority (i.e., the maximization of profits, production and sales) (Linnenluecke & Griffiths, 2010).
(Lloret, 2016). Several theories support corporate sustainability proactively namely institutionalism, resource-based view and stakeholders theories.
The resource-based view of the firm has emerged articulating the relationships among firm resources, capabilities, and competitive advantage (Barney, 1991; Hart, 1995). This position considers the company's resources and capacities when they are valuable, rare, inimitable, adaptable and decisive for positive performance. Corporate sustainability tends to provide internal benefits developing new resources and capabilities, which are related to know-how and corporate culture (Orlitzky et al., 2003; Baumgartner & Ebner, 2010) or external benefits through reputation and legitimacy (Porter & Vander Linde, 1995; Lourenço et al., 2012; Baumgartner & Rauter, 2017). Additionally, Hart (1995) argues that natural limits create new sources of competitive advantage. In this restricted access to resources, one way to obtain new competitive advantage is to develop a sustainable vision for the company (Lloret, 2016). Companies may acquire advantages by reducing consumption and waste, designing new products and technologies (Hart, 1995). Thus, a new conception of chain value associated to business process efficiency and effectiveness performance (Bastas & Liyanage, 2018).
The institutional theory indicates that the regulatory or cognitive context establishes the limits within which the companies move formally and informally. The company must have an institutional vision to be sustainable, because firms are subject to external and regulatory forces (Peng et al., 2009; Lloret, 2016).
As suggested by DiMaggio & Powell (1983), organizations are conditioned through external and internal pressures to meet strategic and operational legitimacy. The capacity to adapt to institutional conditions generates long-term strategies that generate value. These benefits are possible based on stakeholder appreciation, and valuation of resources and capabilities focused on sustainability dimensions. The centrality of stakeholders, as a source of legitimacy, is enhanced by the organizational isomorphism concept (DiMaggio & Powell, 1983). Stakeholder theory argues that various groups with interest in the company including direct and indirect or internal and external shareholders such as, employees, suppliers, government, and media create pressure on the firm to act according to their interests. Stakeholder management introduces deliberate actions to manage stakeholder concerns and simultaneously target company objectives (Freeman 2010). Stakeholder theory has a close link to corporate sustainability (Freeman, 1984; Clarkson, 1995; Donaldson & Preston, 1995; Waddock & Graves, 1997). First, works focus business in society taking a large scope of stakeholders (Freeman, 1984). Then, the managerial scope has greater embeddedness with the
ecological modernization (Mol 2002; Hörisch et al., 2014). These authors argue that a sustainability-based strategy must be based on stakeholders’ needs linked to firm’s products and services (e.g. green products). But also, to the intangible measures which stakeholders enjoy based on a just and fair treatment, and benefits of being affiliated to an organization. (Harrison & wicks, 2013). The value of sustainability appears as a source of mutual interest for all stakeholders with a sustainability management approach, including cooperation in more sustainable products and services (Hörisch et al., 2014).
Thus, new imperatives of sustainability between corporate environmental and social performance on the one hand and corporate competitive advantage and financial performance on the other, must be considered at the firm level research (Margolis & Walsh, 2003), in particular to SME´s.
2. CORPORATE SUSTAINABILITY PERFORMANCE
2.1 Corporate performance
The increase in number and quality of studies on performance and management systems justifies the prominent relevance in the discipline of management sciences (Neely, 2005). Design and implementation of performance systems have been proposed as a balance between internal and external measures and between financial and non-financial measures (Bourne, 2000), involving new measurement dimensions. Also, performance systems tend to be closely related to the satisfaction of individuals, groups of individuals or entities with the legitimacy and power to influence business decisions and outcomes (Harrison & Freeman, 1999). In this context, the analysis of the internal and external dynamics of the construction of performance measurement systems is an understudied subject (Searcy, 2012).
It is recognized that “performance” is itself an ambiguous term, as it does not specify to whom the organization is delivering its ‘performance’ (Otley, 1999). Lebas & Euske (2010) find several definitions as shown in table 1.6 and conclude that performance may be defined as the action, the result of the action, and the success of the result compared to some benchmark (Lebas & Euske, 2002; Rodrigues, 2010).
Table 1.6 – Performance definitions
Area Definition
Management
Measurable by either a number or an expression that allows communication (e.g., performance in management is a multi-person concept);
The result of an action (the value created, however, measured); The ability to accomplish or the potential for creating a result (e.g., customer satisfaction seen as a measure of the potential of the organization for future sales);
Psychology A surprising result compared to expectations;
Acting out
Arts A show that includes both the acting or actions and the result of the actions
as well as the observation of the performers by outsiders
Sociology
To accomplish something with a specific intention (e.g., create value); The comparison of a result with some benchmark or reference selected – or imposed – either internally or externally;
Justice A judgment by comparison (the difficulty here is to define who the “judge”
is, and to know on which criteria the judgment will be formed).
As a behavioural judgment, performance captures some of this complexity as it involves resources used and results obtained with the resources (Rodrigues, 2010). Thus, two relevant dimensions of performance merge “effectiveness” and “efficiency” (Neely et al. 1995). As defined by Neelly et al. (1995), effectiveness refers to the extent to which performance requirements are met, while efficiency is a measure of how the firm’s resources are utilized when providing a given level expected. In this sense, performance is the result of organizational and managerial decision that guide based on the information available in a determined time range (Eccles, 2001; Gomes, 2005). In fact, performance is not static and evolve with time, information and behaviours. However, all definitions assume that an organization that is performing well is one that is successfully attaining its objectives, in other terms, one that is effectively implementing an appropriate strategy.
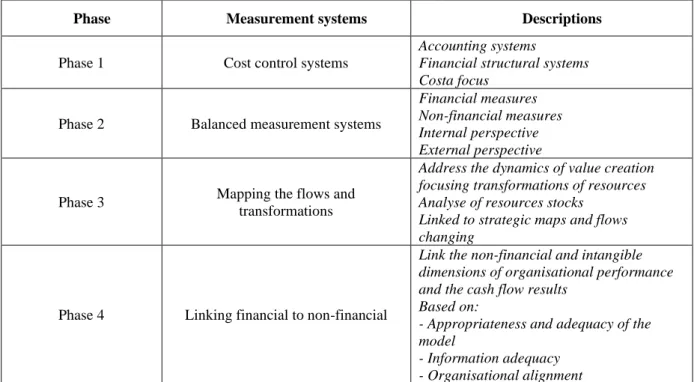
Performance measurement can be defined as the process of quantifying the efficiency and effectiveness of action (Neely et al., 1995). And a performance measurement system is the set of metrics used to quantify both the efficiency and effectiveness of actions (Neely et al., 1995; Chalmeta et al., 2012). Performance measurement systems have been structured taking into account criticism, for example, between financial and non-financial perspectives (Bourne et al., 2000). Thus, the development of performance measurement systems has evolved in the last decades. In fact, we can find four different phases of performance measurement systems in the research literature as described in table 1.7 (Ghalayini & Noble, 1996; Neely et al., 2003; Gomes, 2005).
Table 1.7 – Performance measurement systems construction
Phase Measurement systems Descriptions
Phase 1 Cost control systems
Accounting systems
Financial structural systems Costa focus
Phase 2 Balanced measurement systems
Financial measures Non-financial measures Internal perspective External perspective
Phase 3 Mapping the flows and
transformations
Address the dynamics of value creation focusing transformations of resources Analyse of resources stocks
Linked to strategic maps and flows changing
Phase 4 Linking financial to non-financial
Link the non-financial and intangible dimensions of organisational performance and the cash flow results
Based on:
- Appropriateness and adequacy of the model
The evolution of performance measurement systems results in several frameworks development in the last decades toward integrative visions of performance at the firm level (Chalmeta et al., 2012). Organizational perspectives have been dominant with the following objectives (Gomes, 2005):
- Performance measurement systems must cover all organization areas;
- Performance measurement systems must be intrinsically adapted and shaped to companies’ characteristics;
- Performance measurement systems must have the capacity to promote benchmark.
Thus, several frameworks were designed to comply a global performance measurement perspectives including:
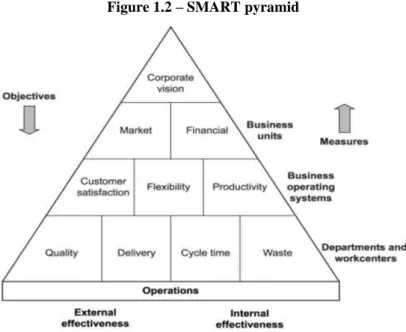
- SMART Pyramid (Cross & Lynch, 1989), this model establishes different levels of balanced objectives and measures. In the first level the corporate strategic vision is the starting point to objectives definition and the last level emphasis measures design. The second level focuses on financial and markets results. The third level is applied to operational areas taking measures at productivity, flexibility and customer satisfaction. Finally, the fourth level focus measures on quality, delivery, process time and cost. With these measures, the model focus on external effectiveness and internal efficiency.
Figure 1.2 – SMART pyramid
- Performance Measurement Matrix (Keegan et al. 1989), based on a two-by-two matrix by considering costs and internal and external perspectives. This model uses hierarchical and integrated approaches make it possible to define strategic objectives and to link with performance measures to them.
Figure 1.3 – Performance Measurement Matrix
Source: keegan et al. (1989)
- Balanced Scorecard (BSC) (Kaplan & Norton 1992), this framework aims to provide management with balanced measures based on four perspectives: financial, customers, internal processes, and learning and growth. It translates an organisation’s mission and strategy into a set of performance measures. The term ‘balanced scorecard’ reflects the balance between short and long-term objectives, financial and non-financial measures, lagging and leading indicators, and external and internal performance perspectives. This model has evolved to provide a framework for strategic measurement and management (design, formulation and implementation).
Figure 1.4 – Balanced scorecard Matrix
Source: Kaplan & Norton (1996)
Number repeat buyers Number customers complaints Market shares
Competitive cost post Relative R&D expenditure
Design cycle time Per cent on-time delivery Number new products
Design cost Material cost Manufacturing cots Non-Cost Cost E x te rn a l In te rn a l
- Performance Prism (Neely et al. 2002) is a three-dimensional model represented by a prism, in which the aim is to measure the total performance of the organisation. Each of the sides of the prism represents a specific area of analysis: stakeholder satisfaction, strategies, processes, capabilities and stakeholders’ contribution. This model introduces stakeholders needs and satisfaction as main focus for performance measurement systems design and implementation.
Figure 1.5 - Performance prism
Source: Neely et al. (2002)
Bourne et al. (2000) identified three different steps to complete an implementation namely: (1) the design of the performance measures; (2) the implementation of the performance measures and (3) the use of the performance measures. Several principles for designing performance measures are listed including (Neely et al., 1995):
- The measures should be directly related to the firm’s g strategy; - Non-financial measures should be adopted;
- The measures need to be adapted to different locations, departments or sites; - The measures change as circumstances;
- The measures should be simple, easy to be retrieved and used; - The measures need to provide fast feedback; and
- The measures need to focus on continuous improvement, not only monitoring activities.
Performance measurement system needs to be flexible and dynamic that includes mechanisms for reviewing targets and standards (Ghalayini & Noble, 1996). Sustainability introduces new dynamics to performance frameworks presenting global challenges and stakeholder’s responsiveness.
2.2 Sustainability and performance
The introduction of sustainability drivers in the performance measurement systems challenges companies to ensure adaptation that reflects their organisational and competitive context (Searcy, 2016).
Kennerley & Neely (2003) states the existence of three phases of effective evolution, namely:
- Reflection, on the existing performance measurement system to identify where it is no longer appropriate and where enhancements need to be made;
- Modification, of the performance measurement system to ensure alignment to the organisation's new circumstances;
- Deployment, of the modified performance measurement system so that it can be used to manage the performance of the organisation.
Evenly change in measurement systems, may create a danger of failure and consequently measurement systems lose their relevance to strategic and operational management. Measurement systems must reflect the context and objectives of the organisation in question (Neely et al., 1995). In this sense, we find the interest in sustainable frameworks at corporate level (i.e., the measurement systems or the sustainable business indices). Firms sustainability measurement systems can be categorized into four distinct groups (Mamede & Gomes, 2014):
- Global systems - Based on global/world sustainable indicators translated into strategic and processes indicators at the enterprise level (Richards & Gladwin, 1999; Robèrt, 2000);
- Stakeholders systems – where the formulation of measures are associated with the results of the stakeholder's engagement process (Bonacchi & Rinaldi, 2007; von Geibler et al.; 2006);
- Triple Bottom Line (TBL) systems where the structure design is based on three dimensions of sustainability (Bakshi & Fiksel, 2003; Sikdar, 2003);
- Adapted systems - Based on traditional methodologies used in strategic and operational contexts originally not sustainable based (e.g., Sustainable Balanced Scorecard), integrating one or several dimensions of corporate sustainability dimensions (Bonacchi & Rinaldi, 2007; Schaltegger & Wagner, 2006; Staniškis & Arbačiauskas, 2009).
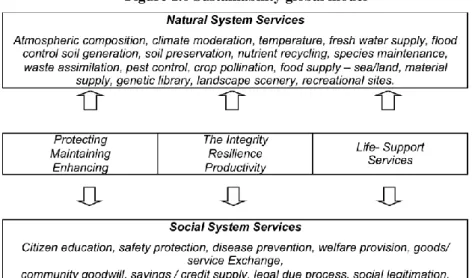
In global systems frameworks, we find the proposal from Richards & Gladwin (1999), taking global sustainability principles, as exposed in figure 1.6.
Figure 1.6 Sustainability global model
Source: Richards & Gladwin (1999)
Based on the analysis of the most used indicators in automotive, chemical, electronic and pulp and paper industries, authors verified that there is an environmental pro-active monitoring focusing direct impact on the ecosystems. On the other hand, the indicators reflect concerns in terms of eco-efficiency, integrating new concerns such as climate change and other global issues. These models tend to promote performance measurement systems on an exclusive basis of compliance, with existing sustainability performance standards. Due to the multidimensional nature of the concept itself, environmental and social concerns tend to change depending on new inputs, such as scientific discoveries or new social trends. This creates instability in the measurement systems, which are more dynamic at the firm level. On the other hand, these models may be distant from the expectations of local stakeholders and their needs.
Stakeholder models are characterized by the centrality of the engagement process. These models integrate the economic, environmental and social expectations of stakeholders in performance measurement (Tregidga & Milne, 2006; Lo, 2010).
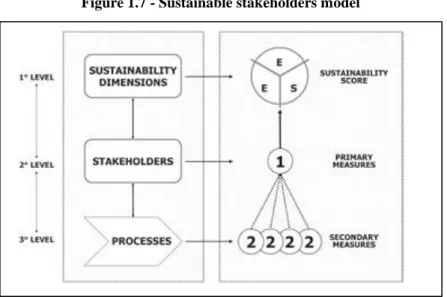
Figure 1.7 - Sustainable stakeholders model
Source: Bonacchi e Rinaldi, 2007
Bonacchi and Rinaldi (2007) have emphasized the relationship between three sustainability dimensions and stakeholder’s engagement. In this case authors focus three levels of metrics in their model:
- The sustainability dimension, through the combination of results that allow the view of measurements and results for the three dimensions (Economic, Environmental and Social);
- Stakeholder satisfaction, by measuring the effectiveness and efficiency of the strategies against the needs and satisfaction of the stakeholders;
- The development of processes, centred on the procedural dimension that expresses the particularity of each company, giving the justificatory results for the fulfilment or not of the strategies.
The Triple Bottom Line models, based exclusively on the definition of sustainability dimension metrics, are not numerous in the analyzed literature. Often the three dimensions are complemented by other analysis and unfolding methodologies.
Sikdar (2003) promoted an analysis of measurement models in the British chemical industry and concluded that the measurement indicators can be divided into three groups as represented in figure 1.7:
Group 1 (1-D): economic, ecological and sociological aspects;
Group 2 (2-D): socioeconomic, eco-efficient and socio-ecological metrics; Group 3 (3-D): sustainability metrics.
Figure 1.8 - Ichem framework
Source: Sikdar, 2003
Also, Global Reporting Initiative (GRI) is included in triple bottom line models as the scope include three categories of sustainability indicators (Brown et al., 2009):
- Social performance indicators, which centre on how an organization contributes to the well-being through its labor, human rights, governance and product responsibility and safety practices;
- Economic performance indicators address the economic impacts through sales, profits, capital expenditures, debt and interest, wages, community donations, taxes, local purchasing, and brand strength;
- Environmental indicators focus environmental performance and impacts to both now and for the future generations covering resource conservation, waste prevention and management, environmental risk control and restoration, supply chain impacts, waste disposal, recycling, energy conservation, greenhouse gases, biodiversity, water and materials use; renewable energy; and wildlife conservation. TBL models include large global issues that may affect the firm´s perception of a possible full sustainable strategy (Lankoski, 2016). Thus, adapted systems may be more accessible and comprehensive as it allows transition phases between the traditional and sustainable measures to be incorporated in the medium and long term. The adapted models are based on already experienced methodologies. Thus, it may give more confidence to firms and their managers.