HAL Id: hal-00688524
https://hal.archives-ouvertes.fr/hal-00688524
Submitted on 17 Apr 2012HAL is a multi-disciplinary open access archive for the deposit and dissemination of sci-entific research documents, whether they are pub-lished or not. The documents may come from teaching and research institutions in France or abroad, or from public or private research centers.
L’archive ouverte pluridisciplinaire HAL, est destinée au dépôt et à la diffusion de documents scientifiques de niveau recherche, publiés ou non, émanant des établissements d’enseignement et de recherche français ou étrangers, des laboratoires publics ou privés.
Odour intensity assessment from solid flooring materials
- comparison of continuous and discrete scales
Olivier Ramalho, Marjorie Jacquelin, François Maupetit
To cite this version:
Olivier Ramalho, Marjorie Jacquelin, François Maupetit. Odour intensity assessment from solid floor-ing materials - comparison of continuous and discrete scales. 7th International Conference, Healthy Buildings 2003, Dec 2003, Singapore, Singapore. pp.201-206. �hal-00688524�
continuous and discrete scales
O. Ramalho∗, M. Jacquelin, F. Maupetit
Centre Scientifique et Technique du Bâtiment (CSTB), F-77421 Marne-la-Vallée, France
ABSTRACT
The aim of this study was to compare the use of two different scales in the measurement of odour intensity from 12 solid flooring materials. Material samples were introduced in Tedlar® bags and assessed by a panel trained in the use of these scales with butanol references. No large significant differences have been observed between repetitions and scales. Linoleums and carpets with tar backing bestowed high odour intensity ratings while carpets and vinyl flooring with foam backing yield the lowest scores. The continuous scale method has proved to be repeatable, less time-consuming than the discrete method. Furthermore, the references provided to the subject allowed both individual and session calibration as intensity ratings can be transformed in equivalent concentration levels.
INDEX TERMS
Odour; Material emission; Sensory; Perceived air quality; Panel
INTRODUCTION
Improvement of indoor air quality requires control of emissions from sources, particularly building materials. Emission control is performed in test chambers with often a list of identified and quantified volatile organic compounds (VOC) as unique result. Sensory (mainly olfactory) measurements provide information about human response to the emission as a whole, a needed complement to chemical analysis. Consequently, evaluation procedure of solid flooring material has integrated sensory measurement in the protocol (ECA-IAQ, 1997, 1999).
Olfaction as all the other senses yields different outputs: acceptability, quality and intensity. Acceptability assessment is relatively close to annoyance evaluation. It generally requires at least several dozens (>60) of untrained subjects (‘customers’) to provide exploitable results due to large inter-individual differences (AFNOR, 2000). In a routine evaluation procedure with small-sized panel, acceptability could not be used. This is unfortunate because annoyance represents a strong aspect of perceived indoor air quality. Odour quality is expressed by expert subjects with semantic terms (ISO, 1994). Odour character profiling provides useful multi-dimensional information, but too much data for an evaluation procedure that tends to be simple, that is whether or not this building material can affect indoor air quality. Odour intensity is assessed by qualified subjects (ISO, 1993). Despite inter-individual differences in detection threshold (Punter, 1983) and power function (Berglund et al., 1971), intensity information is consensual among people if proper calibration is used, and thus the most objective. Calibration is generally achieved by means of odourous standards (Moskowitz
et al., 1974) or use of master scales (Lidén et al., 1997).
To date, the methods used in building material evaluation are currently the olf and decipol method based on the acceptability assessment of perceived air quality (Fang et al., 1999). The small number of subjects (<60) usually used with this method prevents extrapolation of data beyond the panel (no population estimation). Another method in the Danish Climate Labeling is based on linear intensity scales (Knudsen et al., 1999). This method appears simple but
202 Proceedings: Healthy Buildings 2003
lacks calibration. Olfactometry is also used in emission testing to determine the dilution factor (Massold et al., 2002). Despite being useful to determine the amount of clean air necessary to achieve odourlessness, this method does not give any response regarding perception. Moreover, it is based on detection thresholds that can vary from one human to another (Punter, 1983).
Based on equal-attribute matching covered by several standards (ASTM, 1993; AFNOR, 1996), we used a simple method combining scales with odourous references to calibrate it. In this study, a continuous scale with two references and a discrete scale with six references were experimented. The first was already used to assess odour intensity in indoor environments (Ramalho, 2002). The second method was also tried with paint samples (Ramalho, 2000). Each scale was applied for the assessment of the odour intensity of 12 solid flooring materials.
METHODS
Building materials, i.e. six carpets, four vinyl floorings and two linoleums, were selected
(Table 1). Samples (20 × 15 cm) were prepared with the backing covered by an adhesive
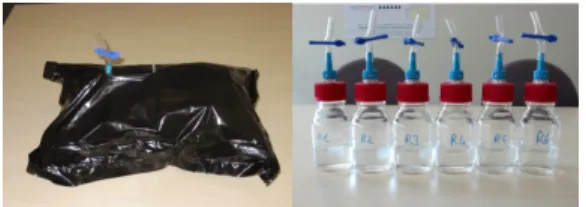
aluminium foil. The samples were then introduced in commercial Tedlar® bags, modified with addition of a large opening valve system and then thermally sealed. A black polyethylene film covered the bag to ensure a blind presentation to subjects (Figure 1). Each bag was coded with numbers, filled with 10 l of clean air, and then left to equilibrate for 24 h at 20°C. Presentation to the subjects was one at a time in balanced order.
Table 1 The 12 solid flooring materials used in this experiment. (SB: styrene–butadiene)
Type Code Backing Type Code Backing
M1 Foam SP1 Foam M2 SB Resin SP2 Homogeneous M3 Tar SP3 Foam M4 Tar Vinyl floorings SP4 Foam
M5 SB Resin SP5 Linen fibres
Carpets
M6 PVC Linoleums SP6 Linen fibres
The panel consisted of six to seven assessors per session from a pool of 15 trained subjects 24–41 years old, with a relative balance between men and women, smokers and non-smokers. Assessment sessions were realized before lunch time or at the end of the working day in a temperature-controlled sensory laboratory (20°C). There, subjects were placed in individual cabins. Each was provided with the required number of reference bottles. The bottle screw caps were modified with an opening valve that allows subject to place directly the glass cone on it (Figure 1). Two small holes in the screw cap hindered any depressurization problems during sniffing.
Figure 1 A modified Tedlar® bag and the modified butanol reference bottles.
Both scales used in this experiment were derived from the same method based on equal-attribute matching, i.e. direct comparison of the odour intensity of unknowns with odourous references (butanol in this case). Subjects were first provided with the reference solutions, which they kept during the session. Butanol was measured in the gas phase at the output of the
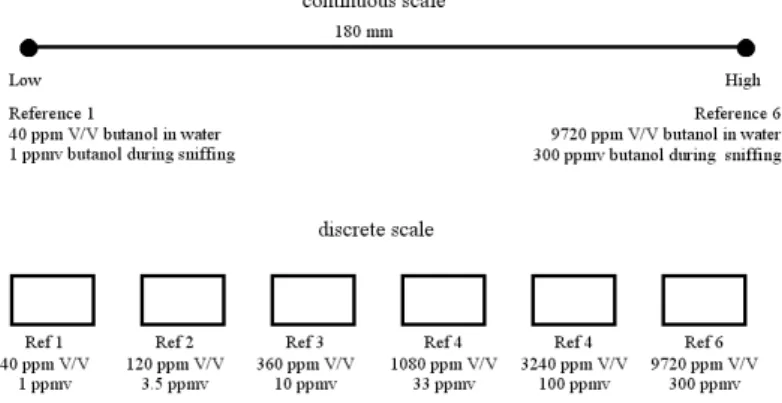
sniffing valve of the bottles. With the continuous scale, the two references represented both end of the line, where subjects had to mark the position of the sample (Figure 2). Panelists were allowed to mark samples beyond the scale range. Results were expressed in distances ranging typically from 0 to 180 mm that were thereafter converted into decimal logarithm of the gaseous concentration of equivalent butanol reference. Thus, the final scale range was 0– 2.5 logarithm units. This scale transformation is based on Steven’s power function (log I = n log C + k) with I as perception intensity, C as stimulus concentration, n known as Steven’s slope and k a constant.
With the discrete scale, the six reference solutions of butanol provided represented a geometric series with an increasing ratio of 3 (Figure 2). Subjects have to check whether the sample was equivalent or in between references. Panelists were allowed to go beyond the range but had to estimate how much lower or higher than the minimum or maximum reference they would place the unknown sample.
Figure 2 Continuous and discrete odour intensity scales.
Sampling of the gas phase (3 l) inside the bags was carried out through Tenax TA tubes. VOC analysis was performed using thermal desorption (ATD 400, Perkin Elmer), gas chromatography, flame ionization detector coupled with a mass spectrometer (GC/FID/MS, Varian 3800/Saturn 2000).
RESULTS
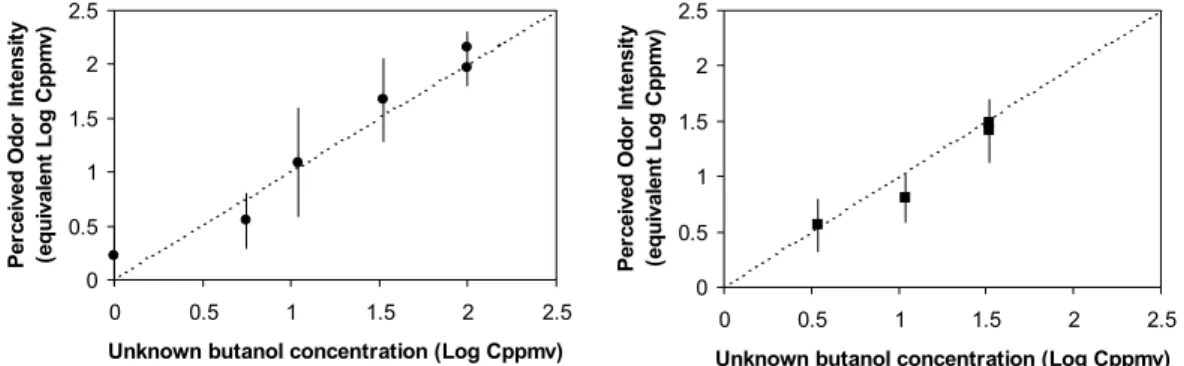
Unknown butanol solutions were presented to the subjects with each scale in order to determine individual and panel performance. Panel performance results are presented in Figure 3. The discrete scale achieves better interval confidence of the mean. The continuous scale shows higher dispersion in the middle range.
Assessments of the odour intensity of the solid flooring materials were conducted with both scales twice. Session repeatability results are presented for both scales in Figure 4. No significant difference in the mean is found for each sample (p > 0.05). Mean profiles are significantly correlated (r = 0.95 for continuous scale and 0.87 for discrete scale). Larger inter-individual dispersion is observed than with unknown solutions of butanol. The panel was quite consensual with the assessment of the most odourous materials, i.e. the two linoleums SP5 and SP6, the two tar-backed carpets M3 and M4 and the vinyl flooring SP2.
204 Proceedings: Healthy Buildings 2003 0 0.5 1 1.5 2 2.5 0 0.5 1 1.5 2 2.5
Unknown butanol concentration (Log Cppmv)
Pe rc ei ve d O d or In te nsi ty (e qu iv al en t Log Cppm v) 0 0.5 1 1.5 2 2.5 0 0.5 1 1.5 2 2.5
Unknown butanol concentration (Log Cppmv)
Pe rc ei ve d O d or In te nsi ty (e qu iv al en t Log Cppm v)
Figure 3 Panel performance expressed as mean result (with standard error bars) of unknown
butanol solutions (left: continuous, right: discrete scale). Dotted line is the identity function.
0.0 0.5 1.0 1.5 2.0 2.5 3.0 M1 M2 M3 M4 M5 M6 SP1 SP2 SP3 SP4 SP5 SP6 M ean Per ce ive d O d or In te n si ty (L og C p pm v B u ta nol ) 06/18/02 06/20/02 0.0 0.5 1.0 1.5 2.0 2.5 3.0 M1 M2 M3 M4 M5 M6 SP1 2SP SP3 SP4 SP5 SP6 M ean P er cei ved O dor In te n si ty (L og C ppm v B u ta no l) 06/25/02 06/27/02
Figure 4 Session repeatability results with continuous (left) and discrete scale (right).
Comparison of results from both scales is presented in Figure 5. A good correlation is observed between data (r = 0.95). Nevertheless, significant differences (p < 0.05) are noted for materials M3, M5, SP1 and SP3. This indicates that odour intensity for these samples was perceived higher with the discrete scale. Four different groups of materials can be differentiated according to the perceived odour intensity: [SP5–SP6], [M3–M4–SP2], [M2– M5–M6–SP1–SP3–SP4] and [M1]. 0.0 0.5 1.0 1.5 2.0 2.5 3.0 M1 M2 M3 M4 M5 M6 SP1 SP2 SP3 SP4 SP5 SP6 M ean P er cei ved O dou r I n te nsi ty (Log C p pm v B u ta no l) continuous scale discrete scale
Figure 5 Comparison of results with continuous and discrete scale.
VOC measurements were realized on the sample bags after the assessment took place. Several dozens to hundreds of VOC per sample are found. Major VOC differences according
to the four intensity groups found earlier are presented hereafter with major compound per chemical family:
• Group 1 [SP5–SP6]: Saturated aldehydes (hexanal), unsaturated aldehydes pentenal), carboxylic acids (propanoic acid), ketones butanone), furans (2-ethylfuran), alkanes (octane), alcohols (1-penten-3-ol).
• Group 2 [M3–M4–SP2]:
o M3–M4: C11–C12 alkenes, methylnaphtalenes, caprolactam, methyl acrylate, 3-methylbutanal, 3-methylpentanal.
o SP2: phenol, 2,6-di-tert-butyl-p-cresol (BHT), dimethyl fumarate, 3,5,5-trimethylhexanol, 3,5,5-trimethylhexene, cumenol isomers.
• Group 3 [M2–M5–M6–SP1–SP3–SP4]:
o M2–M5–M6: C11–C12 alkenes (M5), alkylbenzenes (M2), 3-chlorobutene (M5), 4-bromobutene (M5), 1,2-propanediol (M5–M6), 2-ethoxyethanol (M6), 2-methyl-2-propen-1-ol (M5).
o SP1–SP3–SP4: alkylbenzenes, 2,2,4,6,6-pentamethylheptane (SP1–SP3), 2-ethylhexyl acrylate (SP1–SP3), 2-2-ethylhexyl butanoate (SP1–SP3), isopropyl benzoate (SP1–SP3), triethylamine (SP4), di-tert-butylbenzene (SP4).
• Group 4 [M1]: alkylbenzenes, hexylene glycol, 2-(2-butoxyethoxy)-ethanol.
DISCUSSION
The method method provides calibrated results that could, therefore, be compared with data obtained from other panel, material or laboratory. Both scales yield consistent results despite slight differences in four materials. However, these differences do not change consistently the ranking order (Spearman correlation coefficient = 0.83). The level of inter-individual differences seems better with the discrete scale in the assessment of unknown butanol solutions. Nevertheless, both scales bestow the same dispersion level with real samples, which could be improved by increasing the number of subjects. As the continuous scale is less time-consuming to prepare and provides an equivalent data quality than the discrete scale, it appears to be a better choice for routine assessment of odour intensity in the building material evaluation procedure.
This experiment was realized on already aged materials, stored in standard conditions for more than one year. These results could, therefore, not be extrapolated to new manufactured materials. The assessment was conducted with real samples introduced in bags, i.e. static headspace. Results could not be compared to data obtained from emission chamber tests as the study was mainly focused on scales comparison. However, bags could be used to sample the odourous emission from the chamber to later be assessed by the panel. In this study, bag contaminants (phenol and N,N-dimethyl acetamide) were found to be at a trace level (1– 2 µg/m3).
No relation was found between total VOC concentrations (TVOC) and perceived odour intensity. Oxidized VOCs are associated with high odour intensity scores in this study. The reciprocal may, however, not be true. Low odour detection thresholds are also associated with oxidized compounds (Devos et al., 1990). Identification of odorous compounds by direct sniffing coupled with gas chromatography could provide more information that cannot be guessed by standard chemical analysis or sensory evaluation. This information could be used to help change odorous formulation of building products, as a tool to eradicate or else modify material odour.
CONCLUSION AND IMPLICATIONS
Odour intensity measurement remains the most objective tool to determine perceived emission quality. The method based on equal-attribute matching with butanol has provided
206 Proceedings: Healthy Buildings 2003
calibrated results with both tested scales. The continuous scale is an excellent compromise combining simplicity and power, qualities that are needed in the frame of building material evaluation. Such method could feed emission testing protocol that remains solely based on chemical analysis too often because of no simple and calibrated odour assessment method.
REFERENCES
AFNOR (1996). French Standard AFNOR NF X 43-103, Air quality. Olfactometric measurements. Measurement of the odour of a gaseous effluent. Supra-threshold methods. AFNOR (2000). French Standard AFNOR XP V 09-500, Sensory analysis. Methodology.
General guidance for conducting hedonic tests in sensory analysis laboratory or in controlled conditions room involving consumers.
ASTM (1993). American Standard ASTM E 544-75 (reapproved 1993), Standard practices for referencing suprathreshold odor intensity.
Berglund, B., Berglund, U., Ekman, G. and Engen, T. (1971). Individual psychophysical functions for 28 odorants. Perception & Psychophysics 9, 379–384.
Devos, M., Patte, F., Rouault, J., Laffort, P. and Van Gemert, L.J. (1990). Standardized
Human Olfactory Thresholds. New York: IRL Press at Oxford University Press.
ECA-IAQ (1997). Evaluation of VOC Emissions from Building Products. European Collaborative Action Report 18 / EUR 17334. Luxembourg.
ECA-IAQ (1999). Sensory Evaluation of Indoor Air Quality. European Collaborative Action Report 20 / EUR 18676. Luxembourg.
Fang, L., Clausen, G. and Fanger, P.O. (1999). Impact of temperature and humidity on chemical and sensory emissions from building materials. Indoor Air 9, 193–201.
ISO (1993). International Standard ISO 8586-1, Sensory analysis. General guidance for the selection, training and monitoring of assessors. Part 1: Selected assessors.
ISO (1994). International Standard ISO 8586-2, Sensory analysis. General guidance for the selection, training and monitoring of assessors. Part 2: Experts.
Knudsen, H.N., Kjaer, U.D., Nielsen, P.A. and Wolkoff, P. (1999). Sensory and chemical characterization of VOC emissions from building products: impact of concentration and air velocity. Atmospheric Environment 33, 1217–1230.
Lidén, E., Ulander, A., Deniz, F., Gunnarsson, A.G., Nordin, S. and Högman, L. (1997). Odor-annoyance estimates from road-traffic combustion exhausts: calibration with master scaling using pyridine as a reference, Environment International 23 (6), 829–837.
Massold, E., Kühn, V. and Salthammer, T. (2002). Evaluation of indoor products by sensory and chemical testing. Part II. Comparison of olfactometric and VOC analysis. Proceedings
of the 9th International Conference on Indoor air Quality and Climate—Indoor Air 2002,
Monterey, Vol. 2, pp. 261–266.
Moskowitz, H.R., Dravnieks, A., Cain, W.S. and Turk, A. (1974). Standardized procedure for expressing odor intensity. Chemical Senses and Flavor 1, 235–237.
Punter, P.H. (1983). Measurement of human olfactory thresholds for several groups of structurally related compounds, Chemical Senses 7 (3/4), 215–235.
Ramalho, O. (2000). Correspondences between olfactometry, analytical and electronic nose data for 10 indoor paints. Analusis 28 (3), 207–215.
Ramalho, O. (2002). Odor intensity of a real room—field evaluation and laboratory investigations, Proceedings of the 9th International Conference on Indoor Air Quality and