HAL Id: hal-01296745
https://hal.archives-ouvertes.fr/hal-01296745
Submitted on 1 Apr 2016
HAL is a multi-disciplinary open access
archive for the deposit and dissemination of sci-entific research documents, whether they are pub-lished or not. The documents may come from teaching and research institutions in France or abroad, or from public or private research centers.
L’archive ouverte pluridisciplinaire HAL, est destinée au dépôt et à la diffusion de documents scientifiques de niveau recherche, publiés ou non, émanant des établissements d’enseignement et de recherche français ou étrangers, des laboratoires publics ou privés.
Assimilation in multilingual cities
Javier Ortega, Gregory Verdugo
To cite this version:
Javier Ortega, Gregory Verdugo. Assimilation in multilingual cities. Journal of Population Economics, Springer Verlag, 2015, �10.1007/s00148-015-0549-9�. �hal-01296745�
Assimilation in multilingual cities
Javier Ortega
City University London, CEP (LSE), CReAM, and IZA
Gregory Verdugo
Banque de France and IZA
January 2015
Abstract
We characterise how the assimilation patterns of minorities into the strong and the weak language differ in a situation of asymmetric bilingualism. Using large variations in language composition in Canadian cities from the 2001 and 2006 Censuses, we show that the differences in the knowledge of English by immigrant allophones (i.e. the immigrants with a mother tongue other than English and French) in English-majority cities are mainly due to sorting across cities. Instead, in French-majority cities, learning plays an important role in explaining differences in knowledge of French. In addition, the presence of large anglophone minorities deters much more the assimilation into French than the presence of francophone minorities deters the assimilation into English. Finally, we find that language distance plays a much more important role in explaining assimilation into French, and that assimilation into French is much more sensitive to individual characteristics than assimi-lation into English. Some of these asymmetric assimiassimi-lation patterns extend to anglophone and francophone immigrants, but no evidence of learning is found in this case.
JEL classification: F22, J15
1
Introduction
Multilingual countries are often characterized by heated debates on the role of existing lan-guages. This may be, as stressed by sociolinguists, because bilingualism is seldom purely symmetric (see e.g. Fishman, 1967) or because it is generally unstable in the sense that, over generations, populations often shift from the weak to the dominant language (Paulston, 2003).1 In addition, in countries such as Canada, Belgium, and Spain, the populations speaking the minority language are geographically concentrated, and the defense of the minority language is then a key ingredient in the push towards greater regional autonomy or even secession. As these countries are also experiencing high immigration rates, an important element of the de-bate is whether immigrants end up speaking or not the minority language.
While the individual determinants of immigrant assimilation in multilingual countries are already well documented (see in particular Chiswick and Miller, 1994, 2001 for Canada and van Tubergen and Wierenga, 2011 for Belgium), the existing empirical literature is still far from fully understanding whether and how the patterns of assimilation into the weak and the dominant language actually differ.2
The two key missing elements relate to the impact of the language composition of locations on immigrant assimilation. Specifically, a first issue is whether the presence of dominant-language speakers in a location where the weak dominant-language is the majority-dominant-language deters im-migrant assimilation into the weak language. Second, while a negative correlation between language assimilation and the presence of co-mother tongue speakers in the location is a com-mon result in the literature, the mechanism behind this correlation remains unclear and might vary depending on whether it refers to the dominant or to the weak language. Indeed, a nega-tive coefficient may reflect that the incennega-tives to learning the location’s majority language may be milder in the presence of many co-mother tongue speakers or simply that those immigrants with a lower level of knowledge of the location’s majority language choose to settle in locations
1“The major point about bilingualism (...) is that maintained group bilingualism is unusual. The norm for
groups in prolonged contact with a nation-state is for subordinate group to shift to the language of the dominant group.”(Paulston, 2003, p. 401)
2There is also a theoretical literature explaining why the incentives for learning the weak and the dominant
language differ, see John and Yi (2001) and Church and King (1993). Other empirical papers studying multilingual set-ups include Cattaneo and Winkelmann (2005), Rendon (2007) or Kraus (2011).
with many co-mother tongue speakers, but there is no a priori reason for which the mechanism should be the same for both languages.
Understanding whether learning or sorting dominates is important from a public policy perspective. If learning dominates, language acquisition depends mostly on local costs and benefits which can be influenced by public policies promoting language acquisition. If, on the other hand, sorting dominates, the location choice of immigrants across cities should vary strongly with language abilities. As a result, language assimilation will be a strong factor in-fluencing the geographical mobility of immigrants across local labour markets.
In order to disentangle the importance of learning and sorting, we exploit the empirical liter-ature for unilingual countries, and specifically the strategy initially proposed by Lazear (1999) for the U.S. and recently used by Dustmann and Van Soest (2004) for the U.K. and Lazear (2007) and Beckhusen, Florax, Graaff, Poot, and Waldorf (2013) again for the U.S. The basic idea is simple: if learning is important, we should find a strong and significant effect of the in-teraction between the number of years spent in the country and the size of the language groups in the city. In contrast, if only sorting matters, the most important determinant of language acquisition will be the size of the language groups in the city.3
To study immigrant assimilation under asymmetric biligualism, we choose to focus on Canada for several reasons. First, immigration is a central phenomenon as “allophone” im-migrants (i.e. non English- or French mothertongue imim-migrants) accounted for nearly 20% of the population in 2001. Second, English-French bilingualism is asymmetric, as anglophones account for a much larger share (59%) of the population than francophones (22.5%)4 and
En-glish is currently the international lingua franca. At the same time, the extent of this asym-metry is unclear: French remains an international language, both languages have been given co-official status and the province of Quebec has implemented a very active policy of promo-tion of French.5 Also, the majority language and the size of the language majority greatly vary
3For other ways of accounting for selection in unilingual countries see in particular Danzer and Yaman (2011)
for Germany, and Bauer, Epstein, and Gang (2005) and Cutler, Glaeser, and Vigdor (2008) for the U.S.
4These data are from the 2006 Census 100% tabulations, www12.statcan.ca.
5The legal history of Canada contains examples of legislation aimed at favoring assimilation of immigrants
or minorities in a particular language. For instance, after the British North America Act (1867) established the provincial responsibility over education, the corresponding provincial educational acts (except in the cases of Quebec and Ontario) “banned the use of French as a medium of instruction in the system of public schools and/or abolished the provision of financial support to Catholic [French-speaking] schools” (Mougeon, 1998, p. 227).
across Canadian provinces and cities. Finally, in contrast with other multilingual countries as Belgium and Spain, the Canadian Census includes rich information on the mother tongue of individuals and their knowledge of the two official languages (English and French).
Using the Public Use Microdata Files (PUMF) of the 2001 and 2006 Canadian Censuses, we regress the knowledge of the city-majority language by minority members in the city against the characteristics of individuals and the language composition of the city. An individual is defined as being a city language-minority member if he/she does not have the city majority language as his/her mother tongue. Our sample of individuals thus includes the “official (language) minori-ties” i.e. the francophones in English-majority cities and the anglophones in French-majority cities, and the allophones.
Our results provide a characterisation of immigrant assimilation patterns in the presence of asymetric bilingualism. First, while the individual characteristics of allophone immigrants matter in both groups of cities with the expected signs, assimilation into French in francophone cities is much more sensitive to individual characteristics such as the educational level or the employment status than assimilation into English in anglophone cities.
Second, while the knowledge of the city-majority languages by allophones is in both cases negatively related to the size of the own mothertongue group just as in Chiswick and Miller (2001) or van Tubergen and Wierenga (2011), the mechanism behind this is very different for French and English-majority cities. Specifically, the evidence for learning is limited in the case of the dominant language (English) but very strong in the case of the weak language (French). Indeed, at the mean value, living in a city with 10% co-mother tongue speakers lowers –over a period of ten years- the assimilation rate by only 0.3 p.p in English-majority cities, while the effect is much bigger (by 7 p.p.) in a French-majority city. This result may stem from the incentives for the knowledge of English being high anyway at the country level and instead for the incentives to know French to be more strongly related to the city-level language
distribu-More recently, Bill 101 of Quebec (1977) stated that “only children whose father or mother received most of their primary education in English, in Quebec, have access to English schools” (Barbaud, 1998, p. 185). While the children of immigrants in Quebec can still only attend schools in French, the Canada Constitution Act (1982) partly overturned Bill 101 by establishing the right for Canadian citizens whose mother tongue is English or French to get education in that same language everywhere in Canada (when the number of children so warrants). The defense of French has been used as a central argument in favor of the secession of Quebec in the 1980 and 1995 referenda.
tion. This also suggests that public policies promoting assimilation into French in francophone cities might be more effective that policies to promote English in English-Canada.
We also show that an additional important characteristic of asymmetric bilingualism is that the presence of English monthertongue speakers in French-majority cities deters to a much larger extent the knowledge of French by allophones than the presence of francophones in an English-majority environment deters the knowledge of English. Similarly, having studied in a francophone province has no negative impact on the knowledge of English, while allophones living in francophone cities have a lower knowledge of French if they have previously taken education in an anglophone province.
Another relevant asymmetry for allophones is that language distance matters much more in explaining differences in the assimilation into the weak language (French) than in the as-similation into the dominant language (English), which may simply stem from the fact that the investment in the weak language (French) is not profitable if a big language distance needs to be overcome, and instead the investment in the dominant language is very profitable and not very sensitive to language distances.
Finally, we show that some of these asymmetric assimilation patterns extend also to anglo-phone and francoanglo-phone immigrants. However, sorting is shown now to be the main mechanism in both English- and French-majority cities. A simple interpretation for this would be as fol-lows: as francophone and anglophone immigrants can always choose to settle in a location where their language is the majority language –which constitutes a priori a very good out-come, those who still choose to settle in a city where their language is a minority-language are likely to have a good pre-existing knowledge of the city-majority language.
The paper is organised as follows. Section 2 presents the data and some descriptive statis-tics. Section 3 discusses the empirical model of language knowledge. Section 4 studies the assimilation of allophone immigrants, section 5 follows with the assimilation of francophone and anglophone immigrants, and finally section 6 presents some extensions and robustness checks.
2
Data and Descriptive Statistics
We use the Public Use Microdata Files (PUMF) of the 2001 and 2006 Canadian Censuses6
to study the determinants of the assimilation of language minorities into the city-majority language. The city-majority language is defined as the language with the largest number of mother-tongue speakers according to the 100% Census tabulations for the question: “What is the language that this person first learned at home in childhood and still understands? If the person no longer understands the language learned, indicate the second language learned”.7 Then, an individual is considered to be a city language minority member if he/she does not have the city-majority language as (one of) his/her mother tongue(s).
Our sample of individuals (see Table 1) includes the 230,000 individuals with a mother tongue other than French or English living in a CMA, referred to as “allophones”. In addi-tion, we also consider the assimilation of “official minority” members i.e. the francophones in English-majority cities and the anglophones in French-majority cities.8 This group includes the nearly 30,000 mother tongue francophones living in one of the 20 English-majority Census Metropolitan Areas (CMAs)9and the 19,000 mother tongue anglophones living in one of the 3
French-majority CMAs.
[Table 1 about here.]
Interestingly, mother tongue and immigrant status are not perfectly correlated: Table 1 shows that 7.2% of the mother tongue francophones and 18.6% of the mother tongue anglo-phones in our sample are actually immigrants. Similarly, 15.6% of the alloanglo-phones and 15.3% of the allophones with a non native American mother tongue are not immigrants.
Canadian cities substantially differ in terms of their mother tongue composition. This cross-city language heterogeneity in Canada is already apparent when considering the seven most populated cities in the country (see Table 2). Quebec City is overwhelmingly native
French-6Corresponding to 2.7% samples of the Census populations.
7See http://www12.statcan.ca/english/census01 and http://census2006.ca.
8From our definition of minority, individuals having several mother tongues are not included in the city
minor-ity if one of their mother tongues is the cminor-ity majorminor-ity language.
9We restrict our attention to individuals living in CMAs because the city of residence for individuals living in
smaller cities is not available in the PUMFs. In 2006, according to the 100% Census tabulations, CMAs accounted for 66.98% of the Canadian population.
speaking, while Toronto, Vancouver, Calgary or Edmonton have less than 2% native franco-phones and a large proportion of allofranco-phones (ranging between 16% and 36%), and finally cities as Montreal or Ottawa have significant shares of both official languages.
[Table 2 about here.]
Cities also differ in terms of the size and the identity of the largest allophone group. Indeed, Table 3 shows that in 2006 the size of the largest allophone group as a share of the total pop-ulation ranges from 0.45% in Moncton-Saint John to 15% in Vancouver. As a fraction of the allophone population, the share of the largest group is always quite big, but ranges from 10.7% in London to 40.2% in Vancouver. In addition, the identity itself of the largest group varies across the CMAs in the sample, with 7 different languages for 23 CMAs.10
[Table 3 about here.]
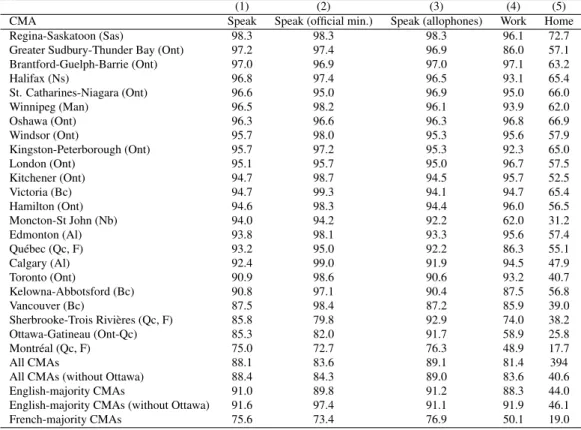
Our main measure of assimilation into the city majority language is based on Question 13 in the Census: “Can this person speak English or French well enough to conduct a conversation?”. Column 1 in Table 4 reports the city-level proportion of minority members declaring to speak well enough the city majority language in 2006. This proportion varies widely across cities, as the assimilation rates range from 98% in Regina-Saskatoon to 75% in Montreal. In addition, assimilation in French-majority cities is clearly lower than in English-majority cities, reflecting the lower assimilation rates of both allophones and official minorities (anglophones), as shown in columns 2 and 3. Also, when one excludes Ottawa, it appears that the relative assimilation pattern of official minorities versus allophones is different in French- and English-majority cities. Indeed, in French-majority cities, the anglophones assimilate less than the allophones (73% versus 77% in 2006) while in English-majority cities, the francophones assimilate more than the allophones (97% versus 91%).11
We also use as alternative measures of assimilation the language most frequently used by
10The largest allophone group was the same in 2001 in 18 out of the 23 CMAs under consideration. The five
exceptions are Winnipeg (from German in 2001 to Filipino in 2006), London (from Polish to Spanish), Oshawa (from Polish to Italian), Toronto (from Italian to Chinese), and Victoria (from German to Chinese).
11The proportions are not reported for 2001. Overall, assimilation was lower in 2001 than in 2006 for both types
of cities, particularly for English-majority cities. Within English-majority cities, assimilation generally went up between the two dates in Ontario and instead fell in Alberta and British Columbia.
the respondent at work and at home. At the individual level, 85.3% (resp. 42.5%) of the individuals declaring to speak the city-majority language declare that they use that language at work (resp. at home), so these two alternative assimilation measures are more stringent than being able to speak the language. Across cities, the variation for these two alternative measures is more important, and the gap between assimilation levels in English-majority and French-majority cities is bigger (see columns 4 and 5 in Table 4).12
[Table 4 about here.]
3
Empirical Model: Disentangling Learning from Sorting
Economic analysis posits that language acquisition depends on its relative costs and benefits.13
In particular, if the benefits associated to learning a specific language stem from the gains of direct trade with the individuals belonging to that language network, then one should expect the learning of that language to be increasing in the size of the network, i.e. the number of speakers. At the same time, the individuals belonging to a larger language group should be in principle less pressed to investing in another language, given their ability to access a larger set of traders even in the absence of any investment.
Language acquisition also takes time and for immigrants most existing models assume that language acquisition is progressive. This leads to a simple regression model where the assim-ilation of minority members is regressed against a series of individual characteristics of the respondents and the aggregate language-composition characteristics of the CMAs:
pik = Xiβ + Zkγ + Tiη + uik (1)
where pikis a measure of language assimilation for individual i in city k, Xi is a set of
individ-ual characteristics which captures differences in learning costs, Zkis the language composition
of city k, and Ti is time spent in the host country. Finally, uik is an error term assumed to be
12For some cities, the proportion of individuals declaring to use the language at work is larger than the
propor-tion declaring to speak the language, but this is simply due to the fact that the latter proporpropor-tion is computed only for the individuals who have a job.
orthogonal to other factors.
The vector Xi includes the age and sex of the respondent, its employment and immigration
status,14 the age at migration, and dummies establishing whether the individual has ever been
married,15 and whether he/she has children aged 0-5 or 6-14. We also include dummies
indi-cating the highest degree attained (high-school, some college, college, and bachelor or above) and whether the highest degree of education has been taken in a Canadian province having the same majority language as the city of residence (see Data Appendix for details). To capture group specific learning costs, we include a dummy for the mother tongue of the individual.
In turn, city-specific variables Zk account for the language composition of the CMAs by
including as regressors the size of the official minority and the proportion of individuals having the same mother tongue as the respondent.16
The effect of city language composition measured by γ in equation (1) can reflect two dif-ferent mechanisms: learning and sorting. If learning is the main mechanism, this parameter captures the effect of the pool of own mother-tongue and/or minority speakers in the city on the incentive to learn the majority language. On the other hand, it may be that individuals who previously know French (resp. English) choose to settle in a French- (resp. English-) majority city and in that case the correlation mostly reflects sorting.17 If individuals sort across cities depending on their pre-existing knowledge of English and/or French, this parameter will reflect the correlation between the location choice and the preexisting knowledge of the language.
To get a rough idea of how strong sorting of individuals across cities is likely to be, the last two columns of Table 3 report for each city the proportion of individuals coming from a country
14Clearly, it might be the case that employment status –or, more generally, labour market status- is partly
determined by language knowledge. In order to reduce this potential reverse causality problem, section 6 presents regressions where the sample is restricted to those individuals employed in occupations where the use of the language is below the median.
15As employment status, marital status could also be –at least partly- determined by language knowledge. 16Individuals who declare to have several mother tongues belong to more than one network, and for this
reason the measure of the total population of the city used to construct these proportions counts bilingual in-dividuals twice. These variables were obtained from the 100% Census tabulations in order to avoid sam-pling errors. This information is available at http://www12.statcan.ca/english/census01 and http://census2006.ca.
17The 2006 Census allows to identify the immigrants that have been in Canada for four months or less. However,
the number of observations for allophones available in the PUMF is very small, with only three cities –Toronto, Vancouver, and Montreal- having more than 35 observations. Table 13 in the appendix shows that while for Montreal the proportion of newly arrived allophones speaking English is actually a little bit higher than the pro-portion of allophones speaking French, over 70% of the newly arrived allophones into Vancouver or Toronto speak English, while less than 4% of them speak French.
where English (or French) is used as a lingua franca, according to data from the Encyclopædia Britannica (2003).18 According to this measure, self-selection to francophone vs. anglophone cities is very important, as 21.4% (resp. 6.7%) of the allophones living in English-majority cities come from a country where English (resp. French) is a familiar language, while 26% (resp. 2.2%) of the allophones living in French-majority cities come from a country where French (resp. English) is a familiar language.
In order to disentangle the empirical importance of learning and sorting, we follow a sim-ple empirical test initially proposed by Lazear (1999) and recently used by Dustmann and Van Soest (2004), Lazear (2007) and Beckhusen et al (2013). The basic idea is the following: assuming language acquisition takes time, an interaction term between the language composi-tion of the city and the length of stay in the city will be significant if there is learning but not if there is sorting. Thus, a simple test of the sorting hypothesis is to estimate the following variation of the previous model:
pik = Xiβ + Zkγ + Tiη1+ (Ti × Zk) η2+ uik (2)
where η2 captures the effect of the interaction between length in country and language
compo-sition. Under learning, we expect this parameter to be statistically significant. If sorting is the correct model, we should not find a strong effect of this interaction.
The validity of this approach depends on several strong assumptions. First, as in Lazear (1999), this argument rests on the immigrants not being very mobile across cities once in the country and on return migration not being too important. Overall, in 2006, 91.0% (resp. 97.6%) of the language-minority immigrants that had been in the country for more than five (resp. one) year(s) were living in the same city as five (resp. one) year(s) before. Second, both sorting and learning are likely to exist in practice. The test is only indicative of the mechanism which is empirically the most important.
More importantly, the model cannot distinguish more complex but theoretically plausible forms of sorting. For example, individuals might sort on other unobserved attributes such as differences in expected gains or unobserved willingness to learn the language. In practice, it is
difficult to assess the empirical importance of this form of sorting and we are not aware of any study investigating these issues.
4
Assimilation of allophone immigrants
We start by investigating the assimilation of allophone immigrants, that is immigrants with a mother tongue different from the two official languages, English and French.19 In order to
capture potential variations in assimilation patterns between languages and cities, we study sep-arately the assimilation in English- and French- majority cities. For all regressions in the paper, we use the sampling weights available in the PUMF files. All models include specific language group dummies which account for the fixed differences in assimilation across language groups. Table 5 investigates the determinants of knowledge of English by allophones in English-majority cities. Column 1 presents a simple model using only individual characteristics as regressors. As in previous work, we find assimilation to be higher for individuals that are employed and more educated. Also, as in Chiswick and Miller (1994, 2001), assimilation is increasing in the number of years in Canada. Quantitatively, the model predicts that spending ten additional years in Canada raises the assimilation rate by 4 p.p. Consistent with the human capital theory which sees language as an investment, assimilation is also strongly decreasing with age, as older immigrants have less time to recoup the benefits of a language investment.
Columns 2 adds to the model the share of speakers with the same mother tongue in the city population. As expected, the coefficient is negative and strongly statistically significant which confirms that a larger share of the minority speakers in the population is associated with lower assimilation rates. The effect is nonetheless much smaller than in Lazear (1999, 2007) for the US in 1990, as in our case a 10 p.p. increase in the share of co-mother tongue individuals lowers the probability to speak English by only 1.3 p.p.
In order to test whether this correlation reflects the presence of learning or sorting, Column 3 adds an interaction term between the share of the group in the population and the number of years in Canada. The interaction term is negative and statistically significant but its magnitude
19Because of data constraints, the sample includes only the allophones for which the variable “Proportion of
own mother tongue” can be computed, namely the individuals whose mother tongue is Arabic, Chinese, Dutch, German, Greek, Italian, Polish, Portuguese, Punjabi, Spanish, Russian, or Ukrainian.
is very small. Specifically, at the mean value, the coefficient of the interaction term indicates that living in a city with 10% co-mother tongue individuals lowers assimilation by an additional 0.3 p.p. over a period of 10 years. Thus, the evidence in favor of learning seems rather limited. Finally, Column 4 studies whether assimilation is affected by the overall language composi-tion of the city, namely the presence of a large francophone minority. In principle, assimilacomposi-tion could be lower in more diverse cities as a result of the presence of a larger minority. The es-timated effects are consistent with this hypothesis but smaller than the effects of the size of the own mother tongue group, as a 10 p.p. increase in the share of francophones decreases the assimilation rate by 0.5 p.p.
[Table 5 about here.]
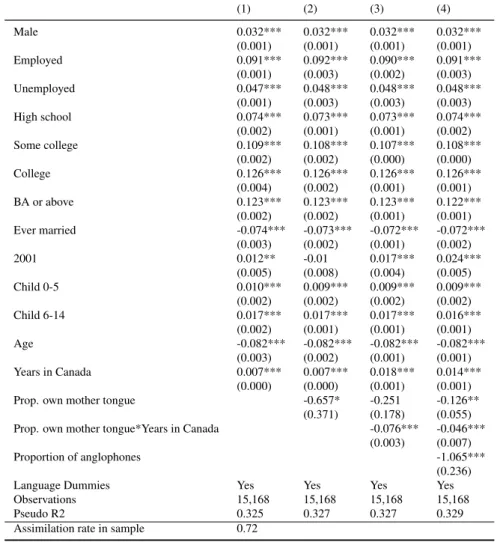
We perform a similar analysis for French-majority CMAs in Table 6. Across specifications, the signs associated to the individual characteristics remain unchanged with the exception of the positive effect on knowledge of French of having a child aged 0 to 5. However, the effect of individual characteristics is substantially larger. For example, being a college graduate instead of a high-school drop out increases by 13 p.p. the probability to speak French in francophone cities while it increased only by 5 p.p. the probability to speak English in anglophone cities. Similarly, age at immigration and years in Canada have a much stronger effect on the probabil-ity to speak French.
Column 2 indicates that the knowledge of French is also negatively correlated with the pro-portion of own mother tongue speakers but the estimated effects are more than five times larger than in English-majority cities, as a 10% share of own mother tongue in the population decrease the assimilation rate by 7 p.p.
Next, column 3 shows there is strong evidence for learning in francophone cities. Indeed, in constrast with English-majority cities, when introducing the interaction term, the direct effect through the size of the own mother tongue group becomes insignificant, indicating that sorting is unlikely to be the main mechanism. In addition, the size of the interaction term is very large as it predicts that living in a city with 10% co-mother tongue individuals lowers assimilation by 7 p.p. over a period of 10 years.
deters the learning of French. Specifically, column 4 shows that a 10 p.p. increase in the share of anglophones lowers the assimilation rate by about 10 p.p.
Overall, a comparison of the language assimilation of allophones in anglophone versus francophone cities reveals the existence of substantial differences. Specifically, the assimila-tion rate of allophones in francophone cities is much more sensitive to individual characteristics such as the educational level and is much more correlated with the size of the individual’s lan-guage group in the population. The results based on Lazear (1999)’s approach also suggest that the evidence for learning is much stronger in French-majority cities. In addition, as expected in a situation of asymmetric bilingualism, assimilation into the countrywide-minority language (French) is much more sensitive to the local size of the countrywide (anglophone) majority than assimilation into English is to the size of the francophone minority.
[Table 6 about here.]
5
Assimilation of anglophone and francophone immigrants
While most immigrants are allophones,20 the immigration of official-language mother-tongue
speakers could still be an important factor influencing the relative strength of the two official languages if the patterns of assimilation of francophone and anglophone immigrants into the other official language were very different.
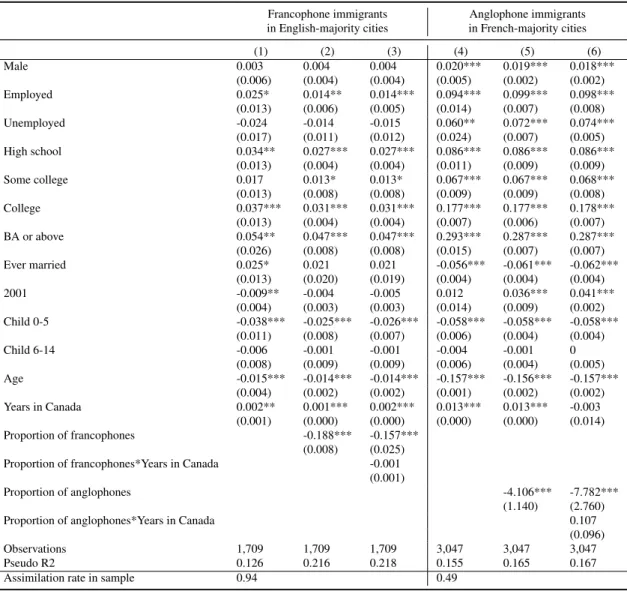
To this purpose, Table 7 studies the assimilation of francophone immigrants into English in anglophone cities (columns 1 to 3) and the assimilation of anglophone immigrants into French in francophone cities (columns 4 to 6). For anglophone cities, the effects of individual char-acteristics are the expected ones, as knowledge of English is positively correlated to education and years in Canada. Compared to the assimilation of allophone immigrants, the only no-ticeable difference is that knowledge of English is here negatively correlated to the presence of children aged 0 to 5, which might be related to Kuziemko (2014) and Kuziemko and Fer-rie (2014)’s argument for the U.S. that adults could lean on their children’s knowledge of the language instead of learning the language themselves. In addition, the estimation results in
20French tongue immigrants account for 1% of the immigrants in anglophone cities and English
Column 2 suggest that the presence of a larger French-speaking group lowers the assimilation rate of French mother-tongue speakers. Specifically, the estimates indicate that an increase by 10 p.p. of the share of French speakers in the population lowers the probability to speak English by about 2 p.p. Column 3, which includes the interaction term in order to disentangle sorting from learning, shows no evidence of learning in anglophone cities.
In francophone cities (columns 4-6), the same qualitative results are found: the assimilation rate positively depends on education and years in Canada, negatively depends on the presence of children aged 0-5 and on the size of the own mother tongue, and no evidence of learning can be found in column 6 –although in contrast with column 3, the coefficient is now positive but very imprecisely measured. However, the same type of asymmetries between French- and English-assimilation found for allophones still hold here. Specifically, on the one hand, the likelihood to speak French is much more sensitive to education, employment status, and years in Canada than the likelihood to speak English in anglophone cities. On the other, the impact of the share of anglophones on the likelihood to speak French is four times larger than in English-majority cities and actually quite important, as a 10 p.p. increase the share of anglophones in the population decreases the probability to know French by about 40 p.p.
[Table 7 about here.]
6
Some Extensions
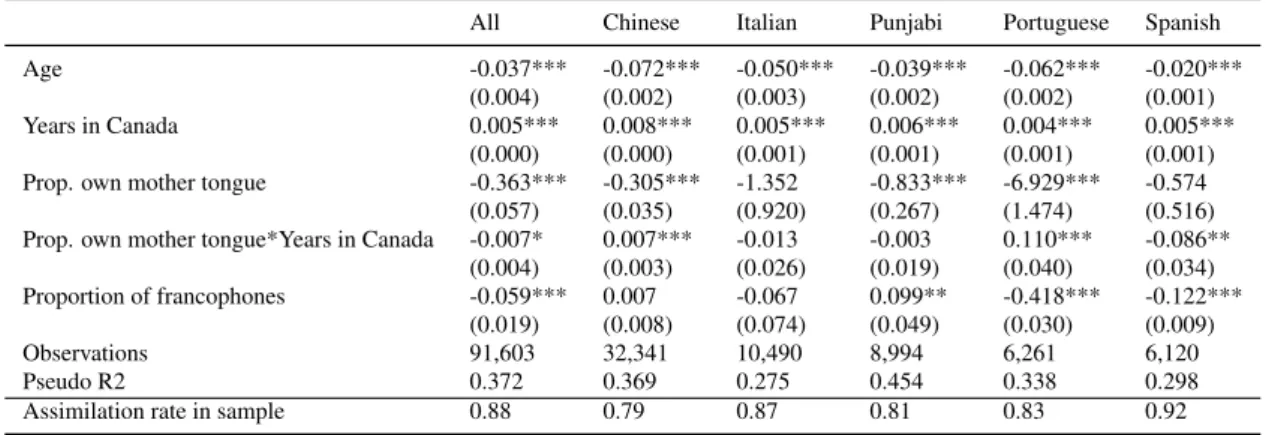
In this section, we evaluate the robustness of the previous results to alternative specifications. We first investigate whether different allophone groups exhibit different assimilation patterns. To this purpose, Table 8 reports estimates from separate regressions for the largest allophone groups in English-majority cities.21 As in Table 5, we find for each specific language group
a strong and generally significant negative correlation between assimilation and the share of co-mother tongue speakers in the city. Another common element with the general analysis of Table 5 is that the interaction term reveals the absence of learning for all groups but for the Spanish mother-tongue immigrants.
21We do not estimate these regressions for French cities as the number of observations is insufficient for all
The results also indicate that, while the effects of the number of years in Canada seem to be broadly comparable across groups, the negative effect of the entry age is much stronger for Chinese immigrants than for other immigrants. Also, interestingly, a larger share of franco-phones in the city negatively affects assimilation into English for those groups of individuals with a mother tongue close to French (as e.g Spanish or Portuguese) but does not affect it for Chinese or Punjabi mother tongue speakers.
[Table 8 about here.]
This last result suggests that distance between languages, which captures differences in average learning costs across groups, may have an influence on assimilation rates.
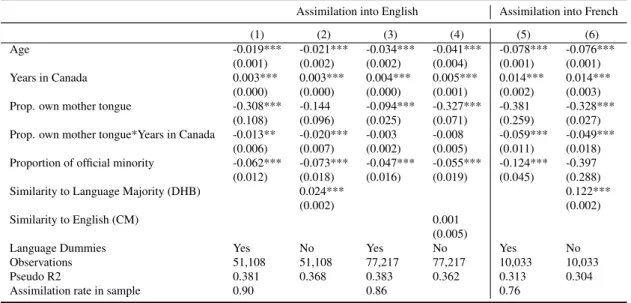
For this reason, Table 9 directly assesses the effect of cross-language similarity on the assimilation rate by introducing two alternative measures of language distance in the regres-sions.22 The first measure has been constructed by Dyen et al (1992) for Indoeuropean lan-guages and is based on the similarity of words across lanlan-guages. In our case, we can thus use the information on the distance of English and French with respect to the other Indoeuropean languages available in the sample.23 The second measure, constructed by Chiswick and Miller
(2005), is based on the difficulties a sample of Americans have in learning other languages and provides us with a measure of distance of English with a different set of languages in the sample.24 We normalize both measures to have a standard deviation of one in the sample.
Regressions (1), (3) and (5) in Table 9 first show that the baseline results in section 4 re-main unchanged when restricting the analysis to the mother tongues in Dyen, Kruskal, and Black (1992) or Chiswick and Miller (2005). Next, regressions (2) and (6) include as regres-sors for respectively English- and French-majority cities the measure of similarity of Dyen et al (1992) instead of the group fixed-effects used in (1) and (5). In both cases, we find a positive effect of language similarity on knowledge of the city-majority language. At the same time, the estimated effect is much bigger for the assimilation into French than for the assimilation into English. Indeed, while in regression (2) an increase by one standard deviation in linguistic proximity increases by 2 p.p. the assimilation rate into English, the same reduction in distance
22See also Isphording and Otten (2014) for an alternative definition of language distance. 23Dutch, German, Greek, Italian, Portuguese, Punjabi, Russian, Spanish, and Ukrainian 24Arabic, Dutch, Chinese, German, Greek, Italian, Polish, Portuguese, Russian, and Spanish.
raises assimilation into French by 12 p.p. in regression (6). Thus, language distance seems to matter more for the ’weak’ language, which may simply stem from the fact that the investment in the weak language (French) is not profitable if a big language distance needs to be overcome, and instead the investment in the dominant language is very profitable and thus not very sen-sitive to language distances. Quantitatively, the effect of language distance seems to be quite large for French: for instance, as there is a 3 standard deviation difference between the dis-tance Punjabi-French and the disdis-tance Spanish-French, the estimates imply that this factor can account for a 36 p.p. of the difference in the assimilation rate into French. Finally, regression (4) in Table 9 includes instead the Chiswick-Miller language distance measure with respect to English, but no effect on the assimilation rate is found in this case.
[Table 9 about here.]
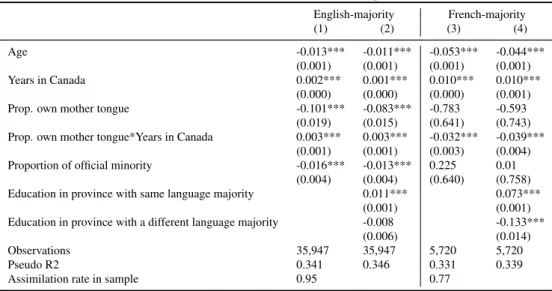
Although no direct information on language of instruction is available, the 2006 Census pro-vides information on the province where the individual received its highest degree –for those who studied in Canada- and also on whether the individual studied in the U.S.or not (see the Data Appendix for more details). Given that allophone immigrants in Quebec must attend by law a school in French and that they generally attend in the rest of Canada (and in the U.S.) schools in English, this information can be understood as a reasonable approximation to language of instruction. When including this information as an explanatory variable for the assimilation rate of allophone immigrants, columns 2 and 4 in Table 10 show that having been educated in a province with the same language majority raises the probability of knowledge of the city-majority language with respect to being educated abroad (excluding the U.S.), with a stronger effect for French than for English. In addition, column 4 shows that having studied in an English-majority province (or in the U.S) has an negative and significant effect on the prob-ability of knowing French, and that this effect is actually quantitatively bigger than the positive effect of having studied in Quebec. Instead, in column 2, education in Quebec does not have a significant negative impact on assimilation into English in anglophone cities, which constitutes an additional asymmetry between the two official languages.
Table 11 presents several additional extensions and compares them with the baseline estimates (column 1). As employment status –included as an explanatory variable in our analysis- could actually be partly determined by language knowledge, we estimate models using a group of workers in occupations with relatively low language requirements. Specifically, columns 2 and 3 report estimates of regressions excluding the individuals working in occupations where the "importance" (column 2) or "level" (column 3) of the basic skill "speaking: talking to others to convey information effectively" as defined by O*NET is above the median.25 The signs of the correlations are found to be virtually identical to the benchmark case for assimilation into English. Instead, for assimilation into French, the evidence on the presence of learning vanishes which suggests that most evidence of learning is driven through the assimilation into the labor market in occupations with higher language requirements.
Next, the last two columns of Table 11 report estimates when the dependent variable is respectively the use of the majority language at work and at home. For English-majority cities, the only difference between these estimates for language use and the benchmark case of column 1 is that there is no evidence that use of English would be driven by learning. In turn, for French-majority cities, there is some evidence of learning and, most importantly, the proportion of anglophones has a very large negative impact on the use of French at work or at home.
[Table 11 about here.]
Finally, while our methodology based on years since migration clearly cannot distinguish between learning and sorting for official-minority natives, it is still interesting to establish whether their broad determinants of knowledge of the city-majority language are similar to those of the immigrants. To this purpose, Table 12 reports the estimates for official-minority natives of the same regressions previously conducted in Table 7 for official-minority immi-grants. We find very similar patterns: education and labor force status have a much larger effect on the assimilation into French than into English. As previously, the negative effect of a larger anglophone minority on the assimilation rate into French is much larger than the effect
25To this purpose, the level (resp. the importance) of the skill "speaking" for each of the 25 occupations
available in the PUMF data is obtained by averaging the level (resp. the importance) of the occupations in the detailed –more than 900- O*NET classification who have the same general title. So for instance, the value for "manager" is an average of the value for "training managers", "public relations manager", "sales manager", etc. The detailed matching can be obtained from the authors upon request.
of the size of the francophone community on the assimilation rate into English.
[Table 12 about here.]
7
Conclusion
This paper analyses the language assimilation of immigrants and official minorities in one im-portant bilingual country, Canada. One strong and consistent result from this paper is that lan-guage assimilation displays important asymmetries between the strong and the weak lanlan-guage. First, learning French depends more on individuals characteristics than learning English. In particular, employment status and education have a much stronger effect on assimilation when the majority language is French.
Second, while the assimilation of allophones depends on the local (city) language distri-bution in both English- and French-majority cities, the effect is much stronger for the latter. In addition, the observed negative correlation between language knowledge and the number of co-mothertongue reflects mostly sorting in English-majority cities while there is substantial evidence of learning in French-majority cities.
Finally, a larger English-speaking minority deters strongly the learning of French in fran-cophone cities. This suggests that the benefits of learning French are more strongly connected with its usefulness on a particular labour market, which is likely to reflect the dominant position of English at the Canadian level.
Overall, our interpretation of these results is that English-learning incentives are so high across English-majority cities that the specific language composition of cities does not actually matter much. Instead, French-learning incentives in francophone cities are strongly related to the local language distribution, and particularly to the share of dominant-language (English) speakers in the city.
While our paper focuses on Canada, we would expect intuitively our results to extend to a series of countries characterised by asymmetric bilingualism, and particularly to those coun-tries in which one of the official languages is –at least to some extent- an international language and the other language is a relatively small one. This might be the case for instance of Belgium
or Spain. Other countries such as Finland or Switzerland may also share some common charac-teristics, but are likely to differ because the international lingua franca (English) -although not an official language- plays an increasingly important role. A related –but still different- issue that we leave for future research is the role of English in unilingual small-language countries (such as Sweden or the Netherlands, in the spirit of Lang and Siniver, 2009, for Israel) or more generally the future role of English in Europe if European integration goes ahead.
Appendix
[Table 13 about here.]
Data Appendix
Level of education: The 2006 Census provides more categories than the 2001 Census for the highest degree attained by those individuals with education levels above high-school and be-low a bachelor’s degree. However, using two broad intermediate categories –“some college” and “college”- renders the information in the two censuses comparable. Specifically, “some college” corresponds to “Trade certificate or diploma” in 2001 and to both “Other trade cer-tificate or diploma” and “Registered apprenticeship cercer-tificate” in 2006. Similarly, “college” corresponds to both “college certificate or diploma” and “university certificate or diploma be-low bachelor level” in 2001, and to “university certificate or diploma bebe-low bachelor level” and three college sub-categories depending on the length of college in the 2006 Census.
Location of education: The variable (“locstud”) in the 2006 Census reports (i) for those indi-viduals who took education in Canada, the Canadian province where the highest degree was obtained, and (ii) for those individuals who took education abroad, whether the highest degree was taken in the U.S. or in one of four very broad regions including many countries which are not homogeneous in terms of language of instruction. With this information, three locations of education can be distinguished for an individual: education abroad excluding the U.S., educa-tion in a province with the same language majority as the province of residence (including the U.S. for English-majority cities) and education in a province with a language majority different from that of the province of residence (including the U.S. for French-majority cities).
List of countries where English (or French) is used as a lingua franca: We include countries where English (or French) are spoken by at least 20% of the population as a lingua franca or where a creole version of the language is spoken by at least 70% of the population. We do not include countries where a majority of the population speaks the language as a mother tongue, as the individuals coming from these countries are likely to declare that English (or French) is their mother tongue and therefore will not be appear in the sample as allophones.
With these criteria, the countries where French is consider to be a familiar language are: Alge-ria, Belgium, Burkina Faso, Cameroon, Central African Republic, Chad, Republic of Congo, Democratic Republic of Congo, Comoros, Côte d’Ivoire, Gabon, Haiti, Lebanon, Mauritius, Morocco, Saint Lucia, Senegal, Switzerland, Togo, and Tunisia. For English, the countries are: Antigua and Barbuda, Bahamas, Barbados, Belize, Botswana, Brunei, Cameroon, Cook Islands, Dominica, Fiji, Grenada, Guyana, Hong Kong, Jamaica, Kiribati, Malaysia, Malta, Marshall Islands, Lesotho, Liberia, Nauru, Nigeria, Palau, Papua New Guinea, Philippines, Puerto Rico, Saint Kitts and Nevis, Saint Vincent and the Grenadines, Samoa, Sierra Leone, Singapore, Solomon Islands, South Africa, Suriname, Tonga, Trinidad and Tobago, Vanuatu, and Zimbabwe.
Acknowledgements
We would like to thank two anonymous referees, the editor (Klaus Zimmermann), Jan Fidrmuc, Alex Lembcke, Barbara Petrongolo, and seminar participants at the CREAM-TARGET Confer-ence on Immigration (UCL), Universidad de Oviedo, EEA, CEP (LSE), Brunel, City University London, and WPEG for interesting comments. Funding from CEPREMAP’s Programme Tra-vailis gratefully aknowledged. Addresses for correspondance: [email protected] and [email protected]
References
Barbaud P (1998) French in quebec. In: Edwards J (ed) Language in Canada, Cambridge Uni-versity Press
Bauer T, Epstein GS, Gang IN (2005) Enclaves, language, and the location choice of migrants. J Popul Econ 18(4):649–662
Beckhusen J, Florax RJ, Graaff T, Poot J, Waldorf B (2013) Living and working in ethnic enclaves: English language proficiency of immigrants in us metropolitan areas. Pap Reg Sci 92(2):305–328
Britannica (2003) Britannica Book of the Year 2002. Encyclopaedia Britannica
Cattaneo A, Winkelmann R (2005) Earnings differentials between german and french speakers in switzerland. Swiss J Econ Stat 141(2):191–212
Chiswick BR, Miller PW (1994) Language choice among immigrants in a multi-lingual desti-nation. J Popul Econ 7(2):119 – 131
Chiswick BR, Miller PW (2001) A model of destination-language acquisition: application to male immigrants in canada. Demogr 38(3):391 – 409
Chiswick BR, Miller PW (2005) Linguistic distance: A quantitative measure of the distance between english and other languages. J Multiling Multicul 26(1):1–11
Church J, King I (1993) Bilingualism and network externalities. Can J Econ 26(2):337 – 345
Cutler D, Glaeser E, Vigdor J (2008) When are ghettos bad? lessons from immigrant segrega-tion in the united states. J Urban Econ 63:759–774
Danzer A, Yaman F (2011) Ethnic Concentration and Language Fluency of Immigrants in Germany. Discussion Paper 11/09, City University London.
Dustmann C, Van Soest A (2004) An analysis of speaking fluency of immigrants using ordered response models with classification errors. J Bus Econ Stat 22(3):312–321
Dyen I, Kruskal J, Black P (1992) An indoeuropean classification: A lexicostatistical experi-ment. T Am Philos Soc 82(5):iii–132
Fishman J (1967) Bilingualism with and without diglossia; diglossia with and without bilin-gualism. In: Paulston CB, Tucker R (eds) Sociolinguistics, 2003, Blackwell Publishing, reprinted from J Soc Issues 32,1967
Isphording IE, Otten S (2014) Linguistic barriers in the destination language acquisition of immigrants. J Econ Behav Organ 105(0):30 – 50
Kraus P (2011) The multilingual city. Nord J Migra Res 1(1):25–36
Kuziemko I (2014) Human capital spillovers in families: Do parents learn from or lean on their children? J Labor Econ 32(4)
Kuziemko I, Ferrie J (2014) The role of immigrant children in their parents’ assimilation in the u.s., 1850-2010. In: Boustan L, Frydman C, Margo RA (eds) Human Capital in History: The American Record, University of Chicago Press
Lang K, Siniver E (2009) The return to english in a non-english speaking country: Russian immigrants and native israelis in israel. BE J Econ Anal Poli, Top 9(1):Article 50
Lazear EP (1999) Culture and language. J Polit Econ 107(6):S95 – 126
Lazear EP (2007) Mexican assimilation in the united states. In: Mexican immigration to the United States, University of Chicago Press, pp 107–121
Mougeon R (1998) French outside new brunswick and quebec. In: Edwards J (ed) Language in Canada, Cambridge University Press
Paulston CB (2003) Linguistic minorities and language policies. In: Paulston CB, Tucker R (eds) Sociolinguistics, Blackwell Publishing
Rendon S (2007) The catalan premium: language and employment in catalonia. J Popul Econ 20(3):669–686
van Tubergen F, Wierenga M (2011) The language acquisition of male immigrants in a multi-lingual destination: Turks and moroccans in belgium. J Ethn Migr Stud 37(7):1039–1057
Table A.1: Minority members by mother tongue and immigration status Mother tongue Total Natives Immigrants
English 19,023 15,482 3,541 French 30,549 28,360 2,189 Allophones 228,671 35,793 192,878
Notes: This table reports by mother tongue and immigration status the number of individuals aged 15 or more living in a CMA and having a mother tongue other than the city-majority language. Source: PUMF 2001 and 2006.
Table A.2: Mother tongue composition (2006)
Mother tongue(s) Canada Toronto Montreal Vancouver Ottawa Calgary Edmonton Quebec city English 58.79 57.91 11.97 59.69 50.40 76.60 78.66 1.29 French 21.65 1.07 65.13 1.01 31.29 1.36 1.95 95.32 Allophone 16.47 35.75 17.77 35.00 14.04 19.13 16.45 2.08 English & French .76 .32 1.70 .29 2.08 .38 .44 .86 English & Allophone 1.87 4.71 .89 3.84 1.41 2.40 2.37 .02 French & Allophone .26 .08 1.53 .05 .39 .01 .05 .32 English, French & Allophone .20 .16 1.00 .12 .39 .09 .08 .10
Notes: This table reports the percentage of individuals in Canada and in a series of Canadian cities having English, French and/or an Allophone language as their mother tongue(s). Source:100% Census tabulations, http://census2006.ca.
Table A.3: Characteristics of allophones in the city, 2006, 100% Census Tabulations
(1) (2) (3) (4) (5)
Largest allophone group Familiarity to official language CMA Language Population (%) Allophones (%) English (%) French (%) Vancouver (Bc) Chinese 15.01 40.18 24.99 .81
Toronto (Ont) Chinese 7.78 20.17 23.81 1.46
Kelowna-Abbotsford (Bc) Punjabi 7.73 37.86 6.14 1.61
Calgary (Al) Chinese 5.00 23.76 19.86 2.66
Edmonton (Al) Chinese 3.67 19.92 21.68 3.23
Windsor (Ont) Italian 3.62 16.02 9.11 6.85
St. Catharines-Niagara (Ont) Italian 3.57 23.29 8.25 1.72 Winnipeg (Man) Filipino 3.57 17.78 31.08 1.30 Montréal (Qc, F) Italian 3.5 17.23 6.91 25.90
Kitchener (Ont) German 3.37 14.98 9.82 1.24
Hamilton (Ont) Italian 3.20 14.72 10.85 1.83
Victoria (Bc) Chinese 2.82 23.58 15.35 2.35
Greater Sudbury/Thunder Bay (Ont) Italian 2.77 29.98 5.97 2.70 Ottawa-Gatineau (Ont/Qc) Arabic 2.77 17.68 11.18 14.48
Regina-Saskatoon (Sas) German 2.63 24.18 17.27 1.84
London (Ont) Spanish 1.85 10.74 9.03 3.86
Brantford-Guelph-Barrie (Ont) Italian 1.63 13.76 14.13 1.65
Oshawa (Ont) Italian 1.32 12.51 28.44 2.08
Halifax (Ns) Arabic 1.10 21.82 9.79 7.54
Kingston-Peterborough (Ont) German .98 13.18 10.15 3.00 Sherbrooke-Trois Rivières (Qc, F) Spanish .94 31.36 1.91 27.93
Québec (Qc, F) Spanish .67 27.49 1.92 28.44
Moncton-Saint John (Nb) Chinese .45 19.78 10.62 10.62
All CMAs Chinese 4.58 19.44 19.33 5.65
English-majority CMAs Chinese 5.53 21.58 21.47 2.20 French-majority CMAs Italian 2.57 15.84 6.70 26
Notes: Column 1 presents the identity of the largest allophone language group in each CMA, while columns 2 and 3 report its size relative to the CMA’s total population and the number of allophones in the CMA, respectively. Columns 3 and 4 report the proportion of immigrants coming from a country whose population is familiarised with respectively English and French. Notes: F denotes a CMA with a French mother tongue majority. Provinces: Al: Alberta, Bc: British Columbia, Man: Manitoba, Nb: New Brunswick, Ns: Nova Scotia, Ont: Ontario, Qc: Quebec, Sas: Saskatchewan. Source: 100% Census tabulations, http://census2006.ca and Encyclopaedia Britannica.
Table A.4: Proportion of city-minority members 15 or over declaring to speak, to use at work, or to use at home the city-majority language (2006 Census)
(1) (2) (3) (4) (5)
CMA Speak Speak (official min.) Speak (allophones) Work Home Regina-Saskatoon (Sas) 98.3 98.3 98.3 96.1 72.7 Greater Sudbury-Thunder Bay (Ont) 97.2 97.4 96.9 86.0 57.1 Brantford-Guelph-Barrie (Ont) 97.0 96.9 97.0 97.1 63.2 Halifax (Ns) 96.8 97.4 96.5 93.1 65.4 St. Catharines-Niagara (Ont) 96.6 95.0 96.9 95.0 66.0 Winnipeg (Man) 96.5 98.2 96.1 93.9 62.0 Oshawa (Ont) 96.3 96.6 96.3 96.8 66.9 Windsor (Ont) 95.7 98.0 95.3 95.6 57.9 Kingston-Peterborough (Ont) 95.7 97.2 95.3 92.3 65.0 London (Ont) 95.1 95.7 95.0 96.7 57.5 Kitchener (Ont) 94.7 98.7 94.5 95.7 52.5 Victoria (Bc) 94.7 99.3 94.1 94.7 65.4 Hamilton (Ont) 94.6 98.3 94.4 96.0 56.5 Moncton-St John (Nb) 94.0 94.2 92.2 62.0 31.2 Edmonton (Al) 93.8 98.1 93.3 95.6 57.4 Québec (Qc, F) 93.2 95.0 92.2 86.3 55.1 Calgary (Al) 92.4 99.0 91.9 94.5 47.9 Toronto (Ont) 90.9 98.6 90.6 93.2 40.7 Kelowna-Abbotsford (Bc) 90.8 97.1 90.4 87.5 56.8 Vancouver (Bc) 87.5 98.4 87.2 85.9 39.0 Sherbrooke-Trois Rivières (Qc, F) 85.8 79.8 92.9 74.0 38.2 Ottawa-Gatineau (Ont-Qc) 85.3 82.0 91.7 58.9 25.8 Montréal (Qc, F) 75.0 72.7 76.3 48.9 17.7 All CMAs 88.1 83.6 89.1 81.4 394
All CMAs (without Ottawa) 88.4 84.3 89.0 83.6 40.6 English-majority CMAs 91.0 89.8 91.2 88.3 44.0 English-majority CMAs (without Ottawa) 91.6 97.4 91.1 91.9 46.1 French-majority CMAs 75.6 73.4 76.9 50.1 19.0
Notes: Column 1 reports the proportion of minority members declaring to speak the city-majority language. Columns 2 and 3 report the proportion of respectively official minority members and allophones declaring to speak the city-majority language. Columns 4 and 5 report the proportion of minority members declaring that the city-majority language is the language they use most often respectively at work and at home. F denotes a CMA with a French mother tongue majority. Provinces: Al: Alberta, Bc: British Columbia, Ma: Manitoba, Nb: New Brunswick, Nf: Newfoundland, Ns: Nova Scotia, Ont: Ontario, Qc: Quebec, Sas: Saskatchewan. Sources: PUMF 2006.
Table A.5: Assimilation of allophone immigrants in English-majority cities (1) (2) (3) (4) Male 0.012*** 0.013*** 0.013*** 0.012*** (0.001) (0.001) (0.001) (0.001) Employed 0.022*** 0.021*** 0.021*** 0.021*** (0.001) (0.001) (0.001) (0.002) Unemployed 0.007*** 0.007*** 0.007*** 0.007*** (0.001) (0.002) (0.002) (0.001) High school 0.037*** 0.037*** 0.037*** 0.037*** (0.002) (0.001) (0.001) (0.001) Some college 0.033*** 0.033*** 0.033*** 0.033*** (0.002) (0.001) (0.001) (0.001) College 0.047*** 0.047*** 0.047*** 0.047*** (0.002) (0.001) (0.001) (0.002) BA or above 0.065*** 0.065*** 0.065*** 0.065*** (0.003) (0.002) (0.002) (0.002) Ever married -0.020*** -0.020*** -0.020*** -0.020*** (0.003) (0.002) (0.002) (0.002) 2001 0.013*** 0.012*** 0.012*** 0.012*** (0.002) (0.001) (0.001) (0.001) Child 0-5 -0.004 -0.005 -0.005 -0.005 (0.004) (0.004) (0.004) (0.004) Child 6-14 0.002 0.002 0.002 0.002 (0.002) (0.002) (0.002) (0.002) Age -0.031*** -0.030*** -0.030*** -0.030*** (0.001) (0.001) (0.001) (0.001) Years in Canada 0.004*** 0.004*** 0.004*** 0.004*** (0.000) (0.000) (0.000) (0.000) Prop. own mother tongue -0.121*** -0.073*** -0.084***
(0.013) (0.016) (0.022) Prop. own mother tongue*Years in Canada -0.003* -0.004* (0.002) (0.002)
Proportion of francophones -0.043***
(0.014)
Language Dummies Yes Yes Yes Yes
Observations 91,603 91,603 91,603 91,603
Pseudo R2 0.394 0.395 0.395 0.395
Assimilation rate in sample 0.88
Notes: The table displays the marginal effects estimates from a Probit model for the probability of knowledge of English by allophone immigrants in English-majority cities. Standard errors are clustered at the CMA level. Sources: PUMF 2001 and 2006.
Table A.6: Assimilation of allophone immigrants in French-majority cities (1) (2) (3) (4) Male 0.032*** 0.032*** 0.032*** 0.032*** (0.001) (0.001) (0.001) (0.001) Employed 0.091*** 0.092*** 0.090*** 0.091*** (0.001) (0.003) (0.002) (0.003) Unemployed 0.047*** 0.048*** 0.048*** 0.048*** (0.001) (0.003) (0.003) (0.003) High school 0.074*** 0.073*** 0.073*** 0.074*** (0.002) (0.001) (0.001) (0.002) Some college 0.109*** 0.108*** 0.107*** 0.108*** (0.002) (0.002) (0.000) (0.000) College 0.126*** 0.126*** 0.126*** 0.126*** (0.004) (0.002) (0.001) (0.001) BA or above 0.123*** 0.123*** 0.123*** 0.122*** (0.002) (0.002) (0.001) (0.001) Ever married -0.074*** -0.073*** -0.072*** -0.072*** (0.003) (0.002) (0.001) (0.002) 2001 0.012** -0.01 0.017*** 0.024*** (0.005) (0.008) (0.004) (0.005) Child 0-5 0.010*** 0.009*** 0.009*** 0.009*** (0.002) (0.002) (0.002) (0.002) Child 6-14 0.017*** 0.017*** 0.017*** 0.016*** (0.002) (0.001) (0.001) (0.001) Age -0.082*** -0.082*** -0.082*** -0.082*** (0.003) (0.002) (0.001) (0.001) Years in Canada 0.007*** 0.007*** 0.018*** 0.014*** (0.000) (0.000) (0.001) (0.001) Prop. own mother tongue -0.657* -0.251 -0.126**
(0.371) (0.178) (0.055) Prop. own mother tongue*Years in Canada -0.076*** -0.046***
(0.003) (0.007)
Proportion of anglophones -1.065***
(0.236)
Language Dummies Yes Yes Yes Yes
Observations 15,168 15,168 15,168 15,168
Pseudo R2 0.325 0.327 0.327 0.329
Assimilation rate in sample 0.72
Notes: The table displays the marginal effects estimates from a Probit model for the probability of knowledge of French by allophone immi-grants in French-majority cities. Standard errors are clustered at the CMA level. Sources: PUMF 2001 and 2006.
Table A.7: Assimilation of official-minority immigrants
Francophone immigrants Anglophone immigrants in English-majority cities in French-majority cities
(1) (2) (3) (4) (5) (6) Male 0.003 0.004 0.004 0.020*** 0.019*** 0.018*** (0.006) (0.004) (0.004) (0.005) (0.002) (0.002) Employed 0.025* 0.014** 0.014*** 0.094*** 0.099*** 0.098*** (0.013) (0.006) (0.005) (0.014) (0.007) (0.008) Unemployed -0.024 -0.014 -0.015 0.060** 0.072*** 0.074*** (0.017) (0.011) (0.012) (0.024) (0.007) (0.005) High school 0.034** 0.027*** 0.027*** 0.086*** 0.086*** 0.086*** (0.013) (0.004) (0.004) (0.011) (0.009) (0.009) Some college 0.017 0.013* 0.013* 0.067*** 0.067*** 0.068*** (0.013) (0.008) (0.008) (0.009) (0.009) (0.008) College 0.037*** 0.031*** 0.031*** 0.177*** 0.177*** 0.178*** (0.013) (0.004) (0.004) (0.007) (0.006) (0.007) BA or above 0.054** 0.047*** 0.047*** 0.293*** 0.287*** 0.287*** (0.026) (0.008) (0.008) (0.015) (0.007) (0.007) Ever married 0.025* 0.021 0.021 -0.056*** -0.061*** -0.062*** (0.013) (0.020) (0.019) (0.004) (0.004) (0.004) 2001 -0.009** -0.004 -0.005 0.012 0.036*** 0.041*** (0.004) (0.003) (0.003) (0.014) (0.009) (0.002) Child 0-5 -0.038*** -0.025*** -0.026*** -0.058*** -0.058*** -0.058*** (0.011) (0.008) (0.007) (0.006) (0.004) (0.004) Child 6-14 -0.006 -0.001 -0.001 -0.004 -0.001 0 (0.008) (0.009) (0.009) (0.006) (0.004) (0.005) Age -0.015*** -0.014*** -0.014*** -0.157*** -0.156*** -0.157*** (0.004) (0.002) (0.002) (0.001) (0.002) (0.002) Years in Canada 0.002** 0.001*** 0.002*** 0.013*** 0.013*** -0.003 (0.001) (0.000) (0.000) (0.000) (0.000) (0.014) Proportion of francophones -0.188*** -0.157*** (0.008) (0.025) Proportion of francophones*Years in Canada -0.001
(0.001)
Proportion of anglophones -4.106*** -7.782***
(1.140) (2.760) Proportion of anglophones*Years in Canada 0.107
(0.096) Observations 1,709 1,709 1,709 3,047 3,047 3,047
Pseudo R2 0.126 0.216 0.218 0.155 0.165 0.167
Assimilation rate in sample 0.94 0.49
Notes: The table displays the marginal effects estimates from a Probit model for the probability of knowledge of the city-majority language by French mother-tongue immigrants in English-majority cities (left panel) and English-mother tongue immigrants in French-majority cities (right panel). Standard errors clustered at the CMA level. Sources: PUMF 2001 and 2006.
Table A.8: Assimilation of immigrants from specific allophone groups in English-majority cities
All Chinese Italian Punjabi Portuguese Spanish Age -0.037*** -0.072*** -0.050*** -0.039*** -0.062*** -0.020***
(0.004) (0.002) (0.003) (0.002) (0.002) (0.001) Years in Canada 0.005*** 0.008*** 0.005*** 0.006*** 0.004*** 0.005***
(0.000) (0.000) (0.001) (0.001) (0.001) (0.001) Prop. own mother tongue -0.363*** -0.305*** -1.352 -0.833*** -6.929*** -0.574
(0.057) (0.035) (0.920) (0.267) (1.474) (0.516) Prop. own mother tongue*Years in Canada -0.007* 0.007*** -0.013 -0.003 0.110*** -0.086**
(0.004) (0.003) (0.026) (0.019) (0.040) (0.034) Proportion of francophones -0.059*** 0.007 -0.067 0.099** -0.418*** -0.122***
(0.019) (0.008) (0.074) (0.049) (0.030) (0.009) Observations 91,603 32,341 10,490 8,994 6,261 6,120
Pseudo R2 0.372 0.369 0.275 0.454 0.338 0.298
Assimilation rate in sample 0.88 0.79 0.87 0.81 0.83 0.92
Notes: The table displays the marginal effects from a Probit model for the probability of knowledge of English by allophone immigrants in general (Column 1) and for specific allophone language groups (Columns to 2 to 6). The first column reproduces the estimates for city-language-composition variables of regression (3) in Table 5. The remaining columns report the estimates when the same specification as in regression (3) in Table 5 is used for each of the five largest allophone groups in English-majority cities. For each language, we exclude the cities for which we have less than 20 observations. The estimates when all English-majority CMAs are included are very similar. Standard errors are clustered at the CMA level. Sources: PUMF 2001 and 2006.
Table A.9: Effect of linguistic proximity on immigrant assimilation
Assimilation into English Assimilation into French
(1) (2) (3) (4) (5) (6)
Age -0.019*** -0.021*** -0.034*** -0.041*** -0.078*** -0.076*** (0.001) (0.002) (0.002) (0.004) (0.001) (0.001) Years in Canada 0.003*** 0.003*** 0.004*** 0.005*** 0.014*** 0.014***
(0.000) (0.000) (0.000) (0.001) (0.002) (0.003) Prop. own mother tongue -0.308*** -0.144 -0.094*** -0.327*** -0.381 -0.328***
(0.108) (0.096) (0.025) (0.071) (0.259) (0.027) Prop. own mother tongue*Years in Canada -0.013** -0.020*** -0.003 -0.008 -0.059*** -0.049***
(0.006) (0.007) (0.002) (0.005) (0.011) (0.018) Proportion of official minority -0.062*** -0.073*** -0.047*** -0.055*** -0.124*** -0.397
(0.012) (0.018) (0.016) (0.019) (0.045) (0.288) Similarity to Language Majority (DHB) 0.024*** 0.122***
(0.002) (0.002)
Similarity to English (CM) 0.001
(0.005)
Language Dummies Yes No Yes No Yes No
Observations 51,108 51,108 77,217 77,217 10,033 10,033 Pseudo R2 0.381 0.368 0.383 0.362 0.313 0.304 Assimilation rate in sample 0.90 0.86 0.76
Notes: The table displays the marginal effects estimate from a Probit model for the probability of knowledge of the city-majority language by allophone immigrants in English-majority cities (left panel) and in French-majority cities (right panel). Column (1) (resp. column (6)) presents the results of specification (4) in Table 5 (resp. Table 6) when the sample includes only the allophones with an Indoeuropean mother tongue. Column (3) presents the results of specification (4) in Table 5 when considering only the allophones having a mother tongue included in the Chiswick and Miller (2005)’s measures of distance to English. Standard errors are clustered at the CMA level. Sources: PUMF 2001 and 2006.
Table A.10: Location of education and immigrant assimilation English-majority French-majority (1) (2) (3) (4) Age -0.013*** -0.011*** -0.053*** -0.044*** (0.001) (0.001) (0.001) (0.001) Years in Canada 0.002*** 0.001*** 0.010*** 0.010*** (0.000) (0.000) (0.000) (0.001) Prop. own mother tongue -0.101*** -0.083*** -0.783 -0.593
(0.019) (0.015) (0.641) (0.743) Prop. own mother tongue*Years in Canada 0.003*** 0.003*** -0.032*** -0.039***
(0.001) (0.001) (0.003) (0.004) Proportion of official minority -0.016*** -0.013*** 0.225 0.01
(0.004) (0.004) (0.640) (0.758) Education in province with same language majority 0.011*** 0.073***
(0.001) (0.001) Education in province with a different language majority -0.008 -0.133***
(0.006) (0.014)
Observations 35,947 35,947 5,720 5,720
Pseudo R2 0.341 0.346 0.331 0.339
Assimilation rate in sample 0.95 0.77
Notes: The table displays the marginal effects estimate from a Probit model for the probability of knowledge of the city-majority language by allophone immigrants in English-majority cities (left panel) and in French-majority cities (right panel). Three locations of education can be distinguished in the data: education abroad excluding the U.S. (ommitted), education in a province with the same language majority as the province of residence (including the U.S. for English-majority cities) and education in a province with a language majority different from that of the province of residence (including the U.S. for French-majority cities). Columns (1) and (3) reproduce regression (4) in respectively Tables 5 and 6 for 2006, which is the only year for which this information is available. Standard errors are clustered at the CMA level. Sources: PUMF 2006.
Table A.11: Alternative measures of city-majority language proficiency/use for immigrant as-similation
(1) (2) (3) (4) (5)
Specification Knowledge Knowledge Knowledge Knowledge Knowledge of Language: of Language: of Language: used used Baseline Level Importance at Work at Home
A. Allophones in English-majority cities
Age -0.030*** -0.029*** -0.022*** -0.036*** -0.104*** (0.001) (0.002) (0.001) (0.001) (0.004) Years in Canada 0.004*** 0.004*** 0.004*** 0.005*** 0.017***
(0.000) (0.000) (0.000) (0.000) (0.001) Prop. own mother tongue -0.084*** -0.138*** -0.141*** -1.055*** -0.470***
(0.022) (0.048) (0.039) (0.075) (0.176) Prop. own mother tongue*Years in Canada -0.004* -0.003** -0.001 0.015*** 0.004
(0.002) (0.001) (0.001) (0.002) (0.009) Proportion of francophones -0.043*** -0.070*** -0.061*** -0.130*** -0.142**
(0.014) (0.016) (0.012) (0.018) (0.062) Observations 91,603 31,529 28,197 58,212 91,603
Pseudo R2 0.395 0.312 0.320 0.231 0.273
Assimilation rate in sample 0.88 0.92 0.93 0.89 0.35 B. Allophones in French-majority cities
Age -0.082*** -0.065*** -0.061*** -0.011*** -0.003*** (0.001) (0.000) (0.000) (0.001) (0.000) Years in Canada 0.014*** -0.001 0.000 0.008 0.006***
(0.001) (0.005) (0.006) (0.009) (0.000) Prop. own Mother Tongue -0.126** -0.421*** -0.505*** -0.045 -0.352
(0.055) (0.118) (0.137) (0.309) (0.240) Prop. own Mother tongue*Years in Canada -0.046*** 0.038 0.035 -0.056 -0.032***
(0.007) (0.030) (0.039) (0.061) (0.003) Proportion of anglophones -1.065*** -3.129*** -2.878*** -1.785* -1.523***
(0.236) (0.908) (1.108) (0.963) (0.300)
Observations 15,168 4,828 4,222 8,780 15,168
Pseudo R2 0.328 0.368 0.361 0.328 0.328
Assimilation rate in sample 0.72 0.76 0.76 0.60 0.22
Notes: The table displays the marginal effects estimates from a Probit model for a series of endogenous variables measuring city-majority language proficiency/use by allophone immigrants. The first column reports the benchmark regression for the knowledge of the official language (regression (4) in Table 5 for Panel A and regression (4) in Table 6 for Panel B. Column 2 (resp. column 3) includes only the individuals working in an occupation for which the level (resp. the importance) of the basic skill "speaking: talking to others to convey information effectively" is below the median. Column 4 and 5 use respectively as an assimilation measure the use of language at work and at home. Standard errors are clustered at the CMA level. Sources: PUMF 2001 and 2006.