Numerical Methods in Geotechnical Engineering – Hicks, Brinkgreve & Rohe (Eds) © 2014 Taylor & Francis Group, London, 978-1-138-00146-6
Axisymmetric transient modelling of a suction caisson in dense sand
B. Cerfontaine
Geomechanics and Geological Engineering, Department ArGEnCo, University of Liege, Belgium FRIA, FRS-FNRS, National Fund for Scientific Research
S. Levasseur, F. Collin & R. Charlier
Geomechanics and Geological Engineering, Department ArGEnCo, University of Liege, Belgium
ABSTRACT: Suction caisson are hollow cylinders open towards the bottom that are currently used as anchors for deep water offshore facilities. They recently turned out to be advantageously exploited as foundation for offshore wind turbines in shallow water (Senders 2009). The Prevost model for cohesionless soils (Prevost 1985) is currently used for the modelling of their cyclic behaviour. It’s able to reproduce plastic deformation in both loading and unloading, contractancy of the soil and pore pressure build up as well. In this paper, a fully-coupled transient axisymmetric analysis of a suction caisson is carried out. A vertical pseudo-random loading is transformed into equivalent ones. Comparison of the permanent displacement accumulated shows a good agreement between them. The influence of the interface conditions is also addressed. For low tension amplitude applied to the caisson, it can be modelled as “stuck” to the inner soil. However higher amplitude might lead to a total unplugging.
1 INTRODUCTION
Nowadays offshore power plants are gathering momentum. The design of their foundations is a crucial issue since their cost is non negligible (Byrne 2000). Classically used as anchors for deep water structures, the suction caissons are promising for shallow foun-dation (Houlsby et al. 2005, Stuyts et al. 2011) either in sand or clays. These hollow cylinders open towards the bottom are installed into the soil by pumping water inside, which creates a differential pressure that plugs it. They are quickly and cheaply installed (Senders 2009), easily removed and provide a limited resistance in tension by suction (Byrne 2000).
The Prevost’s model for cohesionless soils, (Prevost 1985), is adapted to the modelling of their cyclic behaviour and is used in earthquake community (Yang and Elgamal 2008). It’s able to capture plasticity effects in both loading and unloading, pore water pressure (PWP) generation and cyclic mobility as well. In this paper a fully coupled transient axisym-metric analysis is carried out on a suction caisson. A comparison of displacement and PWP accumula-tion is made between pseudo-random and equivalent signals. The influence of interface conditions, contrac-tancy of the soil and Young modulus of the first layer are carried out as well. The effect of permeability is obviously of greater importance and was investigated in (Cerfontaine et al. 2013). A weaker permeability involves less dissipation of the PWP. Consequences are twofold: a greater fraction of the cyclic load is sustained by the PWP (which entails smaller displace-ments) and a increased risk of initial liquefaction.
However, due to the limited size of the paper, this point is not addressed.
2 EQUATIONS OF THE PREVOST MODEL 2.1 Definitions
The sign convention of soil mechanics is adopted: compressive stresses and strains are positive. The Macauley brackets hi are defined according to
The symbol “:” indicates a dot product between two tensors (in bold characters). For example, if σ is the effective (Cauchy) stress tensor, the product σ : σ = σij· σij in index notation. The identity tensor is written δ, then the mean effective stress is defined as p = 1/3 · σ : δ. The deviatoric stress tensor and the invariant of deviatoric stresses are defined through
2.2 Constitutive equations
The Prevost model lies within the framework of elasto-plasticity. Constitutive equations are written in incre-mental form. The equation (3) links the effective stress rate ˙σ to the elastic deformation rate ˙² − ˙²p
where E is the fourth-order tensor of elastic coeffi-cients, ˙² is the total deformation rate and ˙²p is the plastic deformation rate defined through
P is a symmetric second-order tensor defining a non-associated plastic potential. The plastic loading function, 1γ, is a scalar that depicts the variation of plastic deformation and is defined in (5)
where Q is a second-order tensor defining the unit outer normal to the yield surface and H0 the plastic
modulus associated to this surface. 2.3 Yield functions
The model is made of conical nested yield surfaces in principal stress space (Prevost 1985). Their apex is fixed at the origin of axes but could be translated on the hydrostatic axis to take cohesion into account if necessary. The i-th surface is the locus of the stress states that verify
where αiis a kinematic deviatoric tensor defining the coordinates of the yield surface centre in deviatoric space and Mi is a material parameter denoting the aperture of the cone. A normal to the yield surface is computed through
A unit-norm normal tensor is then computed and can be decomposed into deviatoric and volumetric parts as
2.4 Plastic flow rule
The plastic potential P = P0+ P00· δ is decomposed into its deviatoric part which is associative
and its volumetric part which is non-associative
The material parameter ¯η takes into account the phase transformation line (PTL) defined by Ishihara (Ishihara et al. 1975). This parameter rules the volu-metric behaviour and separates the p-q plane into two zones. Stress ratios (η) lower than ¯η indicate a plastic
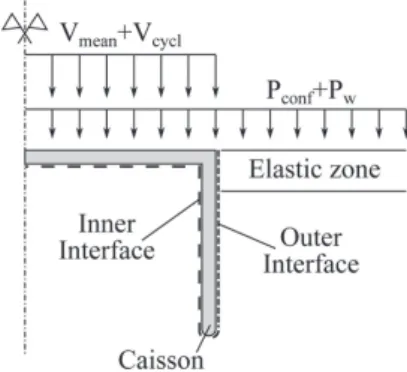
Figure 1. Geometry of the caisson: D = 8 m.
contractive behaviour whilst the other zone depicts a dilative plastic behaviour.
2.5 Hardening rule
The hardening rule of the surfaces is purely kine-matic. During loading, the active surface moves up to come into contact with the next one. The relationship between plastic function and kinematic hardening is determined through the consistency condition (Prevost 1985) and leads to
where µ is a tensor defining the direction of transla-tion of the active surface in the deviatoric space. At this step, any direction of translation could be used depending on the strategy used to integrate the consti-tutive law (explicit or implicit). The only requirement is that any surface has to be at most tangential to the next one, at the end of a given step. Overlapping of the surfaces is then avoided. In this paper, an implicit integration is adopted.
3 CASE STUDY DEFINITION 3.1 Geometry
The caisson modelled in the finite element code LAGAMINE is a 8 m diameter caisson, part of a tripod foundation in shallow water. Neither the superstructure nor the upper part of the foundation are modelled. To a first approximation, the horizontal load is neglected and the foundation can be idealized as an axisymmetric case. The total domain is a rectangle of 24 m × 26 m. A sketch of the geometry is given in Figure Figure 1. The modelled thickness of the caisson is overesti-mated for numerical purpose (0.3 m). In order to avoid very local failure and superficial liquefaction, the first 0.8 m layer of soil is assumed elastic while the Prevost model is applied to the remaining part. The outer inter-face is sliding-free, i.e. the available friction is bounded by a Mohr-Coulomb criterion. The inner interface is considered as “stuck” in the reference case, the soil and the caisson move together.
Loads applied are: a constant load (including static PWP and a small confinement) and a cyclic load due to wind and waves.
Table 1. Material parameters: initial position of the surfaces (α = α11− α33), aperture of the surfaces (M), plastic moduli associated (H0), shear modulus (G), bulk modulus (K), slope of the phase transformation line ( ¯η), effective soil weight (γ0), permeability (k), porosity (n). Surf. Nb. 1 2 3 4 5 α[−] 0 0 0 0 0 M [−] 0.015 0.025 0.045 0.080 0.150 H0[MPa] 450 350 250 150 100 Surf. Nb. 6 7 8 9 10 α[−] 0 0 0 0 0 M [−] 0.300 0.425 0640 0.775 0.92 H0[MPa] 30 10 2 1 0 ¯η 0.4 G [MPa] 40 K [MPa] 66.7 γ0[kN/m3] 10.56 k[m/s] 10−5 n [−] 0.36 3.2 Material
Parameters of a synthetic dense sand are given in table Table 1. In order to facilitate the analysis of results, the soil is deemed to have the same behaviour in compression and extension as well (α = 0) and to be initially isotropic (K0= 1). A small cohesion of 5 kPa
is added for numerical purpose. Parameters of the elastic layer are identical. The Young modulus of the caisson is 2 · 105MPa. When the soil is sliding-free,
the maximum shear resistance τmax is ruled by
where σnis the the stress normal to the sliding plane. 3.3 From pseudo-random to equivalent loading Two types of signal of vertical loading are consid-ered: pseudo-random and sinusoidal-equivalent (see in Figure 2). The pseudo-random signal is adapted from a real case in order to well-capture the frequency content. The mean load is around 20 kPa and the maximum cyclic amplitude is bounded to 40.5 kPa for the extreme event.
A half-cycle analysis was carried out in order to transform the pseudo-random signal into sinusoidal-equivalent ones ((Byrne and Houlsby 2002), see in Figure 2). A half-cycle is a piece of signal bounded by two crossing of the mean effective value (see in Figure 3). Each half-cycle from the pseudo-random signal can be transformed into an equivalent one of equal half-period and amplitude.
In order to reconstruct a full equivalent signal, all the half-cycles are classified into four batches of cycles (see in Table 2). Each one is associated to an aver-age amplitude and an averaver-age half-period. The first equivalent signal is classical ((Rahman et al. 1977), increasing amplitude up to the extreme event, then decreasing). The others ones are rearrangements of the batches with respectively the extreme event at the beginning or at the end. Each signal is followed by a consolidation phase of 250 s.
Figure 2. Pseudo-random and equivalent vertical load signals: Vmean= 20 kPa, Vcycl,max= 40.
Figure 3. Half-cycle analysis.
Table 2. Number of equivalent cycles, associated amplitude and periods.
Number of cycles [–] 50 28 4 1
Amplitude [kPa] 4.5 13.5 22.5 40.5
Period [s] 4.6 11 11.6 11.1
4 RESULTS
4.1 Comparison between signal types
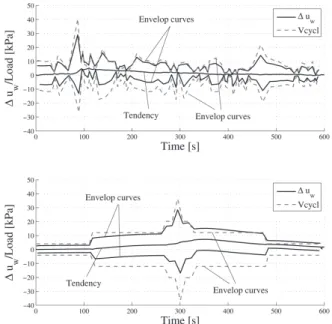
The PWP inside the caisson is measured at the top. It’s is non uniform inside the caisson but the signal measured highlights a global behaviour. The Figure 4 compares the evolution of the PWP and the cyclic component of the load applied to the caisson, for both the pseudo-random and the first equivalent signal. It’s worth noting the partially drained response mode of the caisson. A great part of the cyclic load is sustained by the PWP, which cannot dissipate before the end of the cycle. The suction effect is clear as well.
The tendency of PWP evolution is given in the Figure 5. Envelop curves and cycles as well are
Figure 4. Comparison of envelop curves for PWP and cyclic loading applied to the caisson. The PWP is measured at the top of the caisson for pseudo-random or equivalent loading (V (t) = 20 ± 40.5 kPa).
Figure 5. PWP at the top of the caisson for pseudo-random or equivalent loading (V (t) = 20 ± 40.5 kPa).
omitted for clarity. The general trend is PWP build-up. This accumulation has its origin in the contractive behaviour of the soil (for η < ¯η). The stress path lies most of the time within the contractive zone of the soil either in compression or tension loading of the caisson. Then the tension phase of a cycle doesn’t dis-sipate all the positive excess PWP generated during the compressive part.
The distribution of the cycles in the random sig-nal involves that pore pressure generated during a high-amplitude cycle can be dissipated during fol-lowing low-amplitude cycles. On the other hand, all the high-amplitude cycles are grouped together in the equivalent signals. This could explain why the max-imum PWP accumulation is weaker in the random loading than in equivalent ones.
For the global design, displacement of the rotor of the wind turbine has to be limited, (Senders 2009). Hence displacement of the whole foundation and then of each suction caisson is of great importance. Results
Figure 6. Total vertical displacement of the caisson for pseudo-random or equivalent loading (V (t) = 20 ± 40.5 kPa).
Figure 7. Average stress path (top of the caisson) for pseudo-random or equivalent loading (V (t) = 20 ± 40.5 kPa).
for the four loading signals are given in Figure 6, a positive displacement indicates a settlement. The four signals converge to a quite similar final permanent dis-placement after dissipation of excess PWP. Moreover final displacement for equivalent signals converge to the same value. However peak displacements are more scattered. Therefore, if considering the whole struc-ture, each signal might lead to different peak rotation of the rotor. This difference is easily understandable since the permanent displacement accumulated when the extreme event occurs is greater at the end that at the beginning. Then the sum of recoverable and permanent displacement differs.
Figure 7 depicts the stress path followed by a soil sample at the top of the caisson. The most critical signal could be the third equivalent (Eq. 3 in this Figure) since it depicts a long contractancy phase and pore pressure accumulation. A longer storm event could have lead to initial liquefaction. However, the final state are not so scattered. The global decreasing mean effective stress indicates a tendency to contraction of the soil inside.
Figure 8. Total vertical displacement of the caisson for two interface conditions (stuck-inside or sliding-free), two dif-ferent cyclic amplitudes (40.5 kPa or 76.5 kPa) and the first equivalent load signal.
Figure 9. PWP at the top of the caisson for two interface conditions (stuck-inside or sliding-free), two different cyclic amplitudes (40.5 kPa or 76.5 kPa) and the first equivalent load signal).
4.2 Influence of interface conditions
Interface conditions are a crucial issue when dealing with the modelling of suction caissons. The friction resistance represents only a small part of the resis-tance in compression but is much more important in extension, especially for slow loadings (Senders 2009, Houlsby et al. 2005). Moreover, the interface zone may evolve, due to densification of the surrounded soil or crushing of grains (Senders 2009).
A comparison between interface conditions is car-ried out in the Figures 8 and 9. A cyclic amplitude of 40.5 kPa doesn’t involve any difference between stuck or sliding interfaces. On the other hand, if this cyclic amplitude is increased to 76.5 kPa, curves diverge. In the former figure, it’s clear that a fully sliding-free interface allows the caisson to be unplugged. The displacement curve exhibits a sudden drop and the cal-culus stops. The latter figure indicates a divergence of curves of PWP before failure. This divergence is due
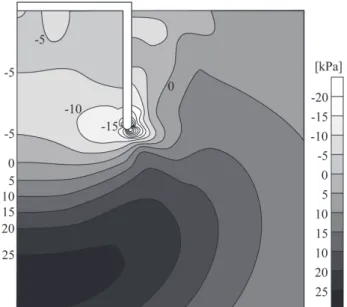
Figure 10. Distribution of excess PWP under the caisson in case of sliding free interface inside, for the most uplifting load (failure).
Figure 11. Distribution of excess PWP under the caisson in case of stuck soil interface inside, for the most uplifting load (−205 kPa).
to a different diffusion of the stresses in the soil, then to a weaker loading.
Figures 10 and 11 depict excess PWP distribution around the caisson. Negative pore pressures are gen-erated in the stuck case because the soil is “pulled” by the caisson. Figure 10 is corroborated with the sud-den drop of PWP previously observed. When the uplift starts, another mechanism of resistance should be acti-vated. Indeed, the gap between the soil and the caisson creates a suction effect and the differential pressure at the top is much greater than the friction resistance, (Senders 2009). Up to now, the element interface used doesn’t take this mechanism into account.
Figure 12 describes the distribution of shear stress outside and inside (if allowed) the caisson at the peak loading (compression or tension). Outside shear resis-tance profiles are quite similar, whatever the inside
Figure 12. Comparison of shear resistance mobilised at the interfaces of the caisson (stuck or sliding-free) for compression and tension peak loadings.
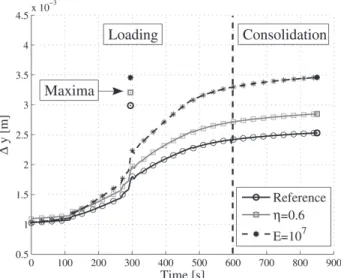
Figure 13. Total vertical displacement of the caisson for ¯η = 0.6 and E = 107kPa.
interface behaviour. Effect of the loading on the inner behaviour is not evident. Compression and tension cre-ates opposite effects. They respectively increase and decrease the confinement and the PWP. However the shear resistance available inside is clearly weak. 4.3 Influence of E and ¯η
Increasing the PTL ( ¯η) enlarges the contractive zone, then the PWP. Thus the stiffness decreases and settle-ment rises up (Figure 13).
The Young modulus of the elastic layer affects strongly the post-peak part of the loading. Indeed, the displacements just after the peak event are quite similar. Contribution of the softer layer to the global resistance is weaker. The surrounding soil is over-loaded and greater PWP are generated. Therefore the stiffness decreases and greater displacements are accumulated up to the end of the loading.
5 CONCLUSIONS
A fully-coupled transient axisymmetric analysis of a suction caisson in the finite element code
LAGAMINE was presented. After consolidation, final displacement converges for both types of vertical load-ings but maximal displacements differ. The partially drained behaviour of the caisson is clear in compres-sion and tencompres-sion as well. The major part of the cyclic component is sustained by an increasing or decreasing PWP. The peak of PWP is weaker for the random load-ing, probably due to the random sequence of cycles that accumulates PWP more slowly.
The inner soil was either stuck to the caisson or sliding-free. For a low cyclic component, responses are identical. However, a greater cyclic load leads to an uplift of the sliding-free caisson and to failure. The distribution of PWP inside the caisson was also totally distinct. This affects the distribution of shear resistance mobilised at the interface and particularly inner friction. Ongoing work is in progress regard-ing the improvement of interface element with suction dependency as a post-contact loss between soil and caisson.
REFERENCES
Byrne, B. W. (2000). Investigations of suction caissons in dense sand. Ph. D. thesis, University of Oxford.
Byrne, B. W. & G. T. Houlsby (2002). Experimental investi-gations of response of suction caissons to transient vertical loading. Journal of Geotechnical and Geoenvironmental Engineering 128(11), 926–939.
Cerfontaine, B., S. Levasseur, & R. Charlier (2013). Axisym-metric transient modelling of a wind turbine foundation in cohesionless soil using the prevost model. Computational Methods in Marine Engineering.
Houlsby, G. T., L. B. Ibsen, & B. W. Byrne (2005). Suction caissons for wind turbines. In Proceedings of the inter-national symposium on frontiers in offshore geotechnics, pp. 75–94.
Houlsby, G. T., R. B. Kelly, & B. W. Byrne (2005). The tensile capacity of suction caissons in sand under rapid loading. In Proceedings of the international symposium on frontiers in offshore geomechanics, Perth, pp. 405– 410.
Ishihara, K., F. Tatsuoka, & S. Yasuda (1975). Undrained deformation and liquefaction of sand under cyclic stress. Soils and Foundations 15, 29–44.
Prevost, J. (1985). A simple plasticity theory for fric-tional cohesionless soils. Soil Dynamics and Earthquake Engineering 4, 9–17.
Rahman, M., J. R. Booker, & H. B. Seed (1977). Pore pressure development under offshore gravity struc-tures. Journal of the Geotechnical Engineering Division 103(12), 1419–1436.
Senders, M. (2009). Suction caissons in sand as tripod foundations for offshore wind turbines. University of Western Australia.
Stuyts, B., J. Irvine, & D. Cathie (2011). Assessing the sta-bility of tripod foundations for offshore wind turbines under cyclic loading. In Proc. of he the 8th Int. Conf. on Structural Dynamics, EURODYN 2011, pp. 3482–3489. Yang, Z. & A. Elgamal (2008). Multi-surface cyclic
plastic-ity sand model with lode angle effect. Geotechnical and Geological Engineering 26, 335–348.