HAL Id: hal-01938706
https://hal.archives-ouvertes.fr/hal-01938706
Submitted on 28 Nov 2018HAL is a multi-disciplinary open access
archive for the deposit and dissemination of sci-entific research documents, whether they are pub-lished or not. The documents may come from teaching and research institutions in France or abroad, or from public or private research centers.
L’archive ouverte pluridisciplinaire HAL, est destinée au dépôt et à la diffusion de documents scientifiques de niveau recherche, publiés ou non, émanant des établissements d’enseignement et de recherche français ou étrangers, des laboratoires publics ou privés.
Impact of land use on soil water content in a hilly
rainfed agrosystem : a case study in the Cap Bon
peninsula in Tunisia
Insaf Mekki, Rim Zitouna, Frédéric Jacob, Netij Ben Mechlia, Laurent Prevot,
Jean Albergel, Marc Voltz
To cite this version:
Insaf Mekki, Rim Zitouna, Frédéric Jacob, Netij Ben Mechlia, Laurent Prevot, et al.. Impact of land use on soil water content in a hilly rainfed agrosystem : a case study in the Cap Bon peninsula in Tunisia. AGROFOR - International Journal, Faculty of Agriculture, University of East Sarajevo, 2018, 3 (1), pp.64-74. �10.7251/AGRENG1801064M�. �hal-01938706�
Original scientific paper
10.7251/AGRENG1801064M UDC 631.432(611)
IMPACT OF LAND USE ON SOIL WATER CONTENT IN A HILLY
RAINFED AGROSYSTEM: A CASE STUDY IN THE CAP BON
PENINSULA IN TUNISIA
Insaf MEKKI
1*, Rim ZITOUNA CHEBBI
1, Frédéric JACOB
1,2, Nétij BEN
MECHLIA
3, Laurent PREVOT
4, Jean ALBERGEL
2, Marc VOLTZ
41INRGREF, B.P. 10, 2080 Ariana, Tunisia
2IRD, UMR LISAH, 2 place Viala, 34060 Montpellier, France 3INAT, 43, Avenue Charles Nicolle, 1080 Tunis, Tunisia 4INRA, UMR LISAH, 2 place Viala, 34060 Montpellier, France
*Corresponding author: insaf.mekki@laposte.net
ABSTRACT
Understanding the temporal and spatial variability of soil moisture is fundamental for improving the management of water and soil resources on rainfed agrosystems. The present study focused on the soil moisture (SM) patterns observed in a hilly rainfed agrosystem. We analyzed five datasets from measurement at 15 sites during various crop growth cycles under the common cereals/legumes/pasture cropping systems within the Kamech catchment in Tunisia. Results indicated a strong seasonality in the precipitation and evapotranspiration dynamics that strongly influences soil moisture patterns, with a strong reduction in the water availability during summer (average SM = 0.20 m3/m3) as compared to winter (average SM = 0.40 m3/m3). The data of two consecutive years showed that the spatial variability, expressed through the coefficient of variation of soil moisture, was at its highest point during spring. The averaged soil moisture of the two years yielded a reasonable significant linear relation (R²=0.67**), indicating temporal stability of the spatial pattern. Actual evapotranspiration was found to be the predominant factor influencing the dynamics of soil moisture.
Keywords: Soil water availability, crop water use, land use, crop sequences,
agricultural hilly catchment, Tunisia.
INTRODUCTION
Rainfed agrosystems significantly contribute to economic output and agricultural production. At the global scale in 2000, approximately 75% of the harvested agricultural areas and 66% of cereal production were associated with rainfed agrosystems (Portmann et al., 2010). Hilly rainfed agrosystems experience agricultural intensification, since their topographical features allow rainwater-harvesting techniques. Meanwhile, they are threatened by climate change, and they are subjected to human-induced pressures (Niu et al., 2015). Therefore, particular
attention should be given to the management of upstream agrosystems, so that land degradation is reduced, crop rainwater consumption is more efficient, and downstream water availability and quality are improved. Among the various drivers to be considered when addressing management of upstream agrosystems, an important factor is soil water storage, so-called green water resource (Rockström et al., 2010). Soil water content plays a key role in hydro-agricultural processes, including partitioning of precipitation between runoff and infiltration, percolation towards aquifers, soil evaporation and plant transpiration, crop functioning and related biomass production, as well as transport of chemical and biological soil constituents (Endale et al., 2006; Hébrard et al., 2006; Mekki et al., 2006; Pan et al., 2008; Zucco et al., 2014). Therefore, reliable information on soil water content is needed, in relation to agricultural practices, so that it is possible to assess the impact of management strategies (Chen et al., 2008). Land use significantly affects soil water content through changes in hydrodynamic properties and in evapotranspiration rates (Hu et al., 2010; Wang et al., 2013). Thus, several studies have shown that inappropriate land uses have negative impacts including deforestation, overgrazing, and deficient agricultural practices, leading to soil erosion, salinization and vegetation degradation, as a consequence of drastic changes in the water balance (Pla, 2006). The effects of land use on soil water variations have been investigated via statistical analysis or simulation with physical-based models combined with measurements (Chen et al., 2008; Hu et al., 2009; Romano, 2014). Beyond existing studies, accurate field measurements of soil moisture depletion are scarce and only few experiments allowed to analyze the influence of land use over whole growing seasons and crop sequences. In this context, the main purpose of this paper was to study the spatio-temporal patterns of soil moisture within a hilly rainfed semi-arid Mediterranean agrosystem. We attempt to deepen our understating of the impact of land use on soil moisture.
MATERIALS AND METHODS
Study site and experimental design description
The study site is the Kamech catchment located in northeastern Tunisia. It is an agricultural hilly catchment, 2.6 km² in size, with elevations ranging from 100 to 200 m. It is an area of ongoing research efforts and part of the long-term collaborative environmental research observatory labeled ORE OMERE (http://www.umr-lisah.fr/omere). The climate is Mediterranean semi-arid to sub-humid. Annually averaged precipitation is 680 mm, with very dry summers (75% of the total annual rainfall occurs between October and April). Annually averaged Penman-Monteith reference crop evapotranspiration is 1366 mm (Zitouna-Chebbi et al., 2017). The predominant soils are cambisols, covering 46% of the catchment. Luvisols and Vertisols cover about 26% and 10%, respectively. Regosols, which are thin and commonly associated with pasture and shrubs, cover about 18%. The catchment is characterized by a diversity of land uses, which are associated with a
large diversity of agricultural operations and overland flow fluxes (Mekki et al. 2006). Agricultural land use includes rainfed cropping systems (cereals, legumes, vineyards and fallow), and pasture systems (pastures-annual and pastures-shrubs). The most common crops are winter cereals (wheat, triticale, oat and barley), and legumes (fababean, chickpeas, peas, fenugreek). Data collection included five extensive sets of measured soil moisture profiles. The first 2-years period (Y1: 2000-01 and Y2: 2001-02) included successions of winter crops (cereals, legumes) and pastures (annuals and shrubs), and a vigneyard. For the growing seasons of years Y3 (April to June 2004), Y4 (January to June 2005) and Y5 (April to July 2006), land use plots include winter crops (cereals, legumes) and pastures (annuals and shrubs).
Measurements
Climatic data were obtained from the met station located at the catchment outlet since 1994 and they were used in the current study to estimate Penman-Monteith reference evapotranspiration (ET0). During the Y1 and Y2 growing seasons, soil
moisture profiles were collected using a neutron probe (Solo 25, Nardeux, St-Avertin, France) from a steel access tube installed in the center of each plot. The neutron probe measurements were expressed in volumetric water content, after calibration against gravimetric water content measurements taken nearby the access tube and soil bulk densities measured with a gamma-density probe (Solo 40, Nardeux, St-Avertin, France). The field experimental and the resulting datasets are detailed in Mekki et al. (2006). For the Y3, Y4 and Y5 growing seasons, gravimetric measurements of soil moisture were conducted on five different types of land use plots, selected according to soil type and topographic position. Actual evapotranspiration (ETa) was estimated as the residual of the water balance: ETa = P + ∆S – R, where P is the precipitation amount, R is the runoff amount, and ∆S is the variation of the soil water storage in the 0-100 cm soil depth layer between the two dates. During years Y3 to Y5, eddy covariance (EC) stations were installed on some of the plots, allowing direct measurements of the actual evapotranspiration (Zitouna-Chebbi et al., 2012, 2015).
RESULTS AND DISCUSSION
Climatic conditions
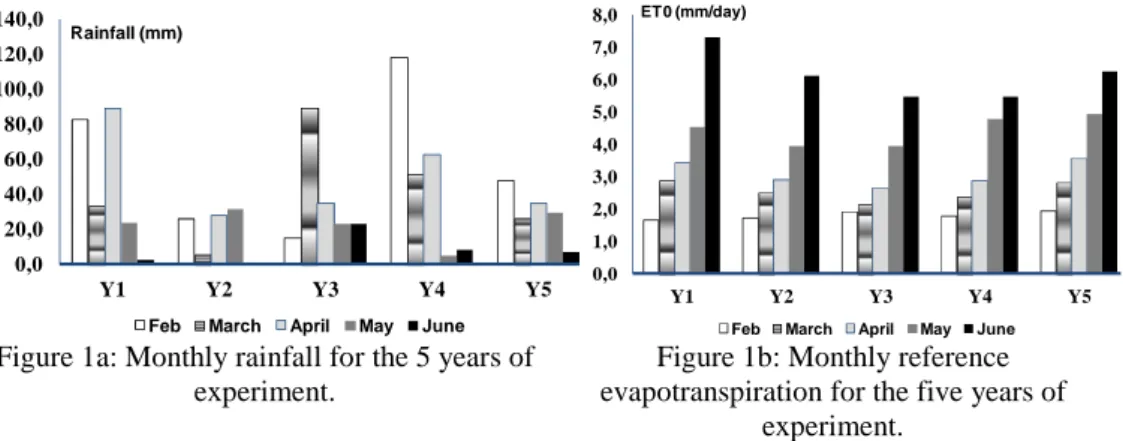
The climatic conditions for the 5 years are summarized by Figure 1. Only the February to June sub-periods are presented, since most of the crop cycle occurs during these periods. The driest year was Y2. The precipitations mainly occurred during the winter months and Monthly rainfall varied between 120 mm in February and 2 mm in June. Reference evapotranspiration had an opposite dynamic, increasing from 2 mm/day in February to 7 mm/day in June.
Figure 1a: Monthly rainfall for the 5 years of experiment.
Figure 1b: Monthly reference evapotranspiration for the five years of
experiment.
Soil moisture and crop evapotranspiration (ETa) dynamics
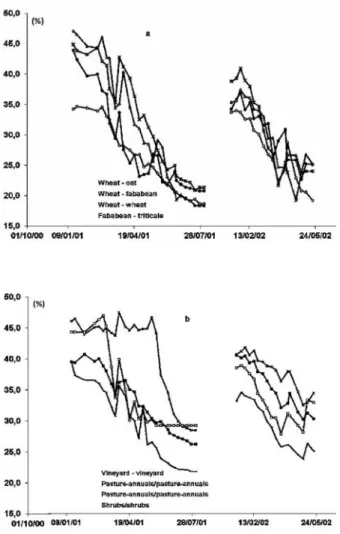
Figure 2 presents the temporal evolution of the averaged soil moisture during the years Y1 and Y2, for the different types of land use. For each plot, the soil moisture profiles were averaged over to 0 to 1 meter depths. As can be seen, the averaged soil moistures exhibit very similar temporal patterns on the different sites. There is a very significant and fast replenishment of the soil water content after the rainfalls, whereas the decrease in soil moisture after rainfall was gradual and evidently maximum at the end of the dry season. The profiles refill in January of Y2 after a significant accumulation of rain water within the soil during the August-December period in Y1. The soil moisture dynamics varies according to the development stages of the crop. The soil moisture in the vineyard plot remains at a value of 40% during the dormant period and only starts to decrease by end of May with the development of the vegetation and of root extraction. In contrast, the other land uses, like pastures and annual crops, whose vegetation was already developed in January, exhibit a decrease in soil moisture starting in February. The site on pasture-shrubs had the lowest soil moisture content, which should be related to the higher root depth. We observed large differences in soil water dynamics among the fababean, wheat, oat, and triticale. This could be caused by (i) differences in the growth periods of the different crops and the larger vegetation cover of cereals compared to fababean, (ii) the varying evapotranspiration of the different plants and (iii) management effects (e.g., planting date, tillage and fertilization). We noted that the development of winter wheat was completed by the end of June or beginning of July, whereas fababean and oat start their growing cycle later in the year and were harvested in May. The lower soil moisture in oat may also be attributed to the sandy texture of soil, with a lower water retention capacity. The low soil moisture at the start of the inter-crop periods directly results from the plant water uptake during the previous crop cycle. The results show that evapotranspiration is the predominant factor influencing soil moisture dynamics. Evapotranspiration differs significantly in relation to land use, soil properties and climatic conditions. This finding confirms results of previous work. Korres et al. (2015) found a homogenizing effect of the uniform vegetation on forest site,
0,0 20,0 40,0 60,0 80,0 100,0 120,0 140,0 Y1 Y2 Y3 Y4 Y5 Rainfall (mm)
Feb March April May June
0,0 1,0 2,0 3,0 4,0 5,0 6,0 7,0 8,0 Y1 Y2 Y3 Y4 Y5 ET0 (mm/day)
contrary to cropped areas, where the shifted periods of maximum water uptake of various crops located on various fields generated an increase of spatial variability in soil moisture patterns.
Figure 2. Temporal variations the averaged soil moisture under different land uses, during the years Y1 and Y2: (a) annual crops and (b) pastures and vineyards. For each date, soil
moistures were averaged over the 0 to 1 m depth profiles and expressed in %.
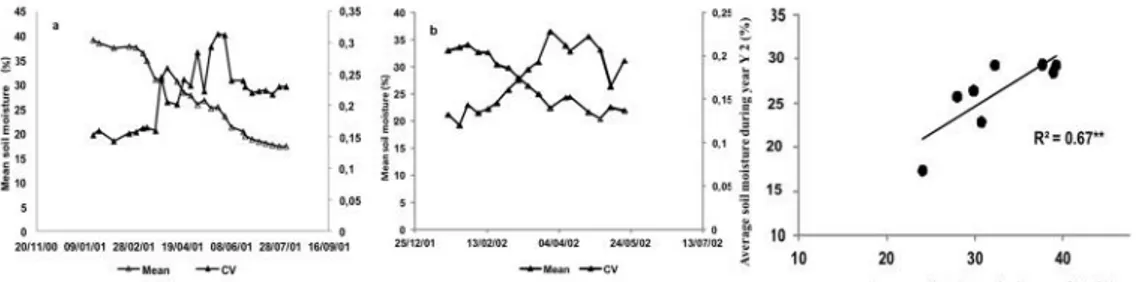
The mean soil moisture ranged from 9 to 32%, with an average value of 18.5%, during year Y1 and it ranged from 11.5 to 25.5%, with an average value of 18.5%, during year Y2. In order to analyze the evolution of the soil moisture at the catchment scale, the soil moisture measured at different locations were aggregated at each date, and Figure 3 presents the temporal evolution of the resulting averaged soil moisture and of its spatial variability, represented by the coefficient of variation (CV). For the two consecutive growth cycles (Y1 and Y2), the spatial variability of soil moisture was maximal between march and may, with a CV reaching 0.25. This period of large spatial variations corresponds to the period over
which root water extraction is the highest and can vary largely between the crops due to differences in canopy extension as well as in rooting patterns. During the dry summer season and during winter, the spatial variability of soil moisture is much smaller. Indeed, during these periods, the water consumptions by most crops is low because either the evapotranspiration demand is low or the crop are no longer active. During these periods, crops do not appear to influence soil moisture dynamics very much from a quantitative point of view, differences between plots are then restricted and are more likely driven by soil texture. As shown by Korres et al. (2015) for a catchment with heterogeneous agricultural use, autocorrelation lengths are: i) short within the growing period of different crops, and caused by land use patterns, and ii) long outside of the growing period, and mainly caused by large scale patterns of soil properties. During summer (dry soils) and winter (wet soils), the variability of soil moisture content was low. Conversely, the spring season corresponded to high rates and large variability of crop water consumption. Accordingly, the spatial variability of soil moisture between the various land uses was also at its highest point during this short period, as previously observed by Hebrard et al. (2006). Land use and agricultural practices are the main factors affecting soil surface conditions and controlling soil moisture. These controlling factors can be more easily identified when different locations within a catchment are compared, especially in areas where soil and vegetation spatial heterogeneities are important (Williams et al., 2004). Here in a semi-arid environment, the spatial variability of soil moisture is mainly locally controlled. This was also shown earlier by Hebrard et al. (2006) in a vineyard catchment located in the south of France. Figure 4 compares the averaged soil water storage at each plot, between the two growing seasons (Y1 and Y2). The averaged soil moisture of the two years yielded a reasonable significant linear relation (R²=0.67**), indicating temporal stability of the spatial pattern. A strong linear correlation is observed on Figure 4, meaning that the driest and wettest plots remain the same during the two years.
Figure 3. Mean soil moisture (%) and coefficient of variation at the catchment scale: (a) Y1 and (b) Y2.
Figure 4. Regression analysis of average water storage (%), in the soil layer 0-1 m, between Y1 and Y2.
Variation of mean soil water content profile for different land uses
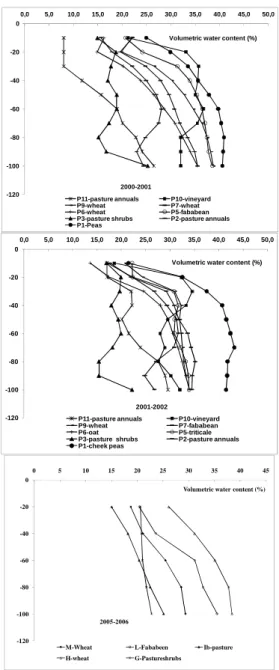
The variation of mean SWC profile within 0-100 cm is shown in Figure 5, for three periods: [January 2001 - August 2001], [January 2002 - May 2002], and [April 2006 - July 2006], and for different land uses. The mean SWC profile significantly changes with field location within the hill slope, as well as with soil thickness, as previously observed by Qui et al. (2001). Inspection of the 2001-2002 data shows that the pasture sites had the lowest mean SWC profiles and that the largest mean SWC profiles were found on chickpea and pea. We observed increasing and waving trends of soil moisture changes with depth, which is consistent with previous results from Fu et al. (2003). This was ascribed to the high evapotranspiration as compared to the rainfall amount, to the differences in soil physical properties and in root vertical distributions. The increasing type corresponded to the annual crops. The waving type was observed and pastures (mainly shrubs) and vineyard. For pasture on vertisols (field P11), soil moisture varied greatly and was strongly affected by preferential flows of water within shrinkage cracks in the root zone, these shrinkage cracks being observed on swelling soils during drying periods. For the [2005-2006] season, we observe that the wheat crop on plot H located on the rim bottom near the watercourse bed, with deep soils depicts larger mean SWC profiles than those observed on the plot M that is located on the rim top with medium soil thickness. The fababean was located on plot L, a plot having the same characteristics than plot M. However, the fababean shows relatively large mean SWC profile. This difference was ascribed to a larger wheat fraction cover and consequently to a larger evapotranspiration rate. The mean SWC observed on pasture was the lowest.
The monthly ETa values over the period of February to June were estimated either by a soil water balance approach or by eddy covariance according to the available observed data. The period analyzed here can be considered representative of crop growth conditions at this time of year. The cropping periods were marked by increases in ETa, which was consistent with the observed decrease in soil moisture and canopy growth. Mean daily ETa keeps value lower than 3 mm/day mainly during the winter-spring seasons. During April, ETa was higher during year Y1 than during year Y2. When soil water was available, the mean ETa could exceed 4 mm/day for wheat and legume plots. The maximum observed ETa (5 mm/day) occurred during the maturity stage of wheat, with a large spatial variation (3 mm/day). The natural vegetation showed high ETa during May. After harvest of legumes crops in late spring, the evapotranspiration amounts were significant on bare soils in rows, when weed development was noticeable and soil moisture still available. We observed differences in ETa between seasons up to 60% in 2001 and 2002 seasons and of 40% in 2006 season.
Figure 5. Variations of mean soil moisture profile in different seasons and land uses.
Impact of land use on water balance partition
Point scale water balance over the 0 – 1 m depth layer was obtained by integrating the soil moisture profiles. A large between-plot variability of rainfalls was observed. There was no runoff for most of the sites, the observed amounts corresponding to less than 10% of the annual rainfall. The observed amount of
-120 -100 -80 -60 -40 -20 0 0,0 5,0 10,0 15,0 20,0 25,0 30,0 35,0 40,0 45,0 50,0
P11-pasture annuals P10-vineyard P9-wheat P7-wheat P6-wheat P5-fababean P3-pasture shrubs P2-pasture annuals P1-Peas
Volumetric water content (%)
2000-2001 -120 -100 -80 -60 -40 -20 0 0,0 5,0 10,0 15,0 20,0 25,0 30,0 35,0 40,0 45,0 50,0
P11-pasture annuals P10-vineyard P9-wheat P7-fababean P6-oat P5-triticale P3-pasture shrubs P2-pasture annuals P1-cheek peas
Volumetric water content (%)
2001-2002 -120 -100 -80 -60 -40 -20 0 0 5 10 15 20 25 30 35 40 45
Volumetric water content (%)
2005-2006
M-Wheat L-Fababeen Ib-pasture H-wheat G-Pastureshrubs
available water at a given date was also variable, which could be explained by the spatial variation in soil retention capacity, infiltrated rainfall amounts and evapotranspiration fluxes. The amount of available water ranged from 160 mm to 290 mm following the observation time and the location. The amount of available soil moisture at the end of summer ranges from 0 mm to 55 mm during Y1. A larger variability was found in the soil water storage changes (∆S) calculated from the observed soil moisture. The available soil moisture varied in relation to land use and crop succession. The observed reference evapotranspiration (ET0) for the
whole experimental period was equal to 4.4 mm/day during Y1, 2.2 mm/day during Y2, 2.9 mm/day during Y3, 3.9 mm/day during Y4, and 1.6 mm/day in Y5. This is consistent with previous findings that during summer months, evaporative demand is high and tends to be relatively small in winter season. Despite drought conditions during summer, bare soils following annual pasture and legumes provide larger amounts of soil water as compared to soils with annual crops. During the wheat growing periods, the soil with medium or low soil thickness remains dry in Y1, Y2 and Y5 due to water use by wheat crop. The results show that annual rainfall is mainly converted into actual evapotranspiration (ETa) during the growing cycle for different land uses. Therefore, ETa is the predominant factor that influences the soil moisture dynamics. The average ETa for the whole experimental period varied from 1.6 to 2.4 mm/day in Y1, from 1.2 to 2 mm/day in Y2, about 1.3 mm/day in Y3, about 2.1 mm/day in Y4, and from 0.6 to 1.6 mm/day in Y5. We observed differences up to 60% in Y1 and Y2 seasons and of 40% in Y5 season. The agreement between the methods measuring ETa (water balance vs. EC) was found to be satisfactory at the cropping cycle scale, whereas large differences were observed at daily and monthly timescales.
CONCLUSION
The main purpose of this paper was to study the spatio-temporal patterns of soil moisture within a hilly rainfed semi-arid Mediterranean agrosystem. We attempt to deepen our understating of the impact of land use on soil moisture. Precipitation and evapotranspiration exhibited significant seasonal variations on the studied site, influencing the temporal patterns of soil moisture. Accordingly, the spatial variability of soil moisture between the various land uses was also at its highest point during this short period. Here in a semi-arid environment, the spatial variability of soil moisture is mainly locally controlled. The results show that evapotranspiration is the predominant factor influencing soil moisture dynamics. Evapotranspiration differs significantly in relation to land use, soil properties and climatic conditions. We observed differences in ETa between seasons up to 60% in 2001 and 2002 seasons and of 40% in 2006 season. However, we have just begun to investigate how changes in land use might affect the distribution of soil moisture profiles and the evapotranspiration patterns in semi-arid rainfed agrosystems. At a wider scale, the effect of land use on the water balance is very complex and it remains difficult to determine which other environmental factor could affect spatial and temporal variability. Despite this limitation, the coupling of soil moisture and
evapotranspiration measurements clearly complement each other, contributing to the understanding of the variability of soil moisture, and suggest that land use exercises a dominant influence on the spatio-temporal patterns, and therefore, on the continuity of hydrological pathways at the catchment scale. This has two main implications in water management of rainfed agrosystems, which can lead to positive environmental impacts on surrounding ecosystems. One is the possibility to control in part runoff and downstream water yield, by choosing appropriate agricultural practices. Second, is the possibility to control the amount of green water. Therefore, the following actions are recommended. Ideally, land use in rainfed agrosystems should be optimized to an efficient use of rainwater. Considerable differences occur with different crop sequences. During initial development of plants, soil water storage directly results from the plant’s water uptake during the previous crop cycle. The high soil moisture at the start of the inter-crop periods is accessible to the successive crop. Crop management should be compatible with soil water availability and take into account the beneficial effect of crop sequences as a management strategy. Finally, crop transpiration generates high ETa over short time periods, thus accounting for crop type to accurately estimate ETa amount and temporal dynamic, which are both critical to properly represent land-surface atmosphere interactions.
ACKNOWLEDGEMENTS
Financial support for this study was provided by: i) the French Research Programs IRD project JEAI-Jasmin and the ORE OMERE, and ii) the E.U Research Programs HYDROMED (STD4, INCO) and the Seventh Framework Program IRRIMED.
REFERENCES
Chen W., Shen Y.Y., Robertson M.J., Probert M.E., Bellotti W.D. (2008). Simulation analysis of lucerne–wheat crop rotation on the Loess Plateau of Northern China. Field Crops Research 108, 179-187.
Endale, D. M., Fisher, D. S., Schomberg, H. H., (2006). Soil water regime in space and time in a small Georgia Piedmont catchment under pasture. Soil Sci. Soc. Am. J. 70, 1-13.
Fu B., Wang J., Chen L., Qiu Y. (2003). The effects of land use on soil moisture variation in the Danangou watershed of the Loess Plateau, China. Catena 54, 197-213.
Hébrard, O., Voltz , M., Andrieux, P., Moussa, R. (2006). Spatio-temporal distribution of soil surface moisture in a heterogeneously farmed Mediterranean
catchment. Journal of Hydrology, 329, 110-121.
doi:10.1016/j.jhydrol.2006.02.012.
Hu, W., Shao, M.A., Wang, Q.J., Fan, J., Horton, R. (2009). Temporal changes of soil hydraulic properties under different land uses. Geoderma 149, 355-366.
Korres, W., Reichenau T.G., Fiener P, Koyama C.N, Bogena H.N, Cornelissen T, Baatz R, Herbst M, Diekkrüger M, Vereecken H, Schneider K. (2015). Spatio-temporal soil moisture patterns - A meta-analysis using plot to catchment scale data. Journal of Hydrology 520, 326-341.
Mekki I., Albergel J., Ben Mechlia N., Voltz M. (2006). Assessment of overland flow variation and blue water production in a farmed semi-arid water harvesting watershed. Physics and Chemistry of the Earth, 31, 1048-1061.
Niu, C. Y., Musa, A., and Liu, Y. (2015). Analysis of soil moisture condition under different land uses in the arid region of Horqin sandy land, northern China, Solid Earth, 6, 1157-1167, doi:10.5194/se-6-1157.
Pan, Y.X., Wang, X.P., Jia, R.L., Chen, Y.W., He, M.Z. (2008). Spatial variability of surface soil moisture content in a re-vegetated desert area in Shapotou, Northern China. Journal of Arid Environments 72, 1675-1683.
Pla, I. (2006). Hydrological effects of land use changes under Mediterranean climate conditions. In: Soil and Water Conservation under Changing Land Use (J. Martínez et al, ed). 21-31. Lleida (Spain).
Portmann, F.T., Siebert, S., Döll, P. (2010). MIRCA2000—Global monthly irrigated and rainfed crop areas around the year 2000: A new high resolution data set for agricultural and hydrological modeling. Global Biogeochemical Cycles, 24, 1-24.
Rockström J., Karlberg L., Wani S.P., Barron J., Hatibu N., Oweis T., Bruggeman A., Farahani J., Qiang Z. (2010). Managing water in rainfed agriculture- the need for a paradigm shift. Agricultural Water Management 97, 543-550.
Romano N, 2014. Soil moisture at local scale: Measurements and simulations. Journal of Hydrology 516 , 6-20.
Williams DG, Cable W, Hultine K, Hoedjes JCB, Yepez EA, Simonneaux V, Er-Raki S, Boulet G, de Bruin HAR, Chehbouni A, Hartogensis OK, Timouk F. (2004). Evapotranspiration components determined by stable isotope, sap flow and eddy covariance techniques. Agricultural and Forest Meteorology 125, 241-258.
Zitouna-Chebbi R., Prévot L., Jacob F., Mougou R., Voltz M. (2012). Assessing the consistency of eddy covariance measurements under conditions of sloping topography within a hilly agricultural watershed. Agricultural and Forest Meteorology, 164, 123-135.
Zitouna-Chebbi R., Prévot L., Jacob F., Voltz M. (2015). Accounting for vegetation height and wind direction to correct eddy covariance measurements under conditions of sloping topography within a hilly agricultural watershed. J. Geophys. Res. Atmos., 120, DOI:10.1002/2014JD022999.
Zucco G, Brocca L., Moramarco T, Morbidelli R. (2014). Influence of land use on soil moisture spatial–temporal variability and monitoring. Journal of Hydrology 516, 193-199.