Vol. 32, No. 9 (2018) 1850110 (17 pages) c
World Scientific Publishing Company DOI: 10.1142/S0217979218501102
Investigation of dielectric behavior
of the PVC/BaTiO3 composite in low-frequencies
A. Berrag∗
Laboratoire Dosage Analyse Caract´erisation Haute R´esolution (DAC HR), S´etif I, Algeria
Berrag amine@yahoo.fr
S. Belkhiat† and L. Madani‡ University Ferhat Abbas, S´etif I, Algeria
†Belsa set@yahoo.fr ‡madani lakhdar10@yahoo.fr Received 10 May 2017 Revised 25 November 2017 Accepted 15 December 2017 Published 2 February 2018
Polyvinyl chloride (PVC) is widely used as insulator in electrical engineering especially as cable insulation sheaths. In order to improve the dielectric properties, polymers are mixed with ceramics. In this paper, PVC composites with different weight percentages 2 wt.%, 5 wt.%, 8 wt.% and 10 wt.% were prepared and investigated. Loss index (ε00) and dielectric constant (ε0) have been measured using an impedance analyzer RLC. Fourier transform infrared (FTIR) spectroscopy, scanning electron microscopy (SEM) equipped with energy dispersive X-ray (EDX) have been used as characterization techniques. The incorporation of BaTiO3 does not modify the crystallinity and the morphology of the PVC but reduces the space charges, therefore the dielectric losses. The frequency re-sponse analysis has been followed in the frequency ranges (20–140 Hz and 115–1 MHz). Relaxation frequencies have been evaluated in each frequency range. Experimental mea-surements have been validated using Cole–Cole’s model. Experimental results show well that BaTiO3 as a filler improves the dielectric properties of PVC.
Keywords: Relaxation; insulation; polymers; loss index; dielectric constant; permittivity; BaTiO3.
PACS numbers: 77.22.Ch, 77.Gm, 77.80.bg
March 20, 2018 14:6 IJMPB S0217979218501102 page 2
A. Berrag, S. Belkhiat & L. Madani
1. Introduction
The insulation function is one of the basic operating conditions of production, transmission, and distribution of electrical energy.1 The polymers exhibit a good dielectric and mechanical quality to achieve this function.2 However, despite all the precautions taken during their implementation, the polymers experience, some challenges such as the aging and the phenomenon of space charge that can lead to premature breakdown.3–5The space charge is an important factor in the degra-dation of polyethylene. Its accumulation in the defect sites can distort the electric field distribution in the polymer matrix and results in reducing electrical strength. The ceramics incorporation in the polymers consequently reduces this phenomenon and improves the lifetime of the composite. These polymers are mixed with fillers such as black of carbon, or the ceramic powder, in order to change some dielectric properties.6–9 So, a new class of materials has been developed. They are studied in various applications including embedded capacitors, sensors acoustic emission and reduction of leakage current.10–12Taking account of its structure, its good dielectric properties, its mechanical properties and its good behavior to various constraints, polyvinyl chloride (PVC) has become an important product in the manufacture of power transmission cables.13 The use of PVC as matrix allowed the obtaining of composites having both good electrical properties and good mechanical properties according to the application. However, despite the recognized evolution of this poly-mer type, the insulation cables are experiencing some difficulties in terms of lifetime, whereas the composites-based PVC are getting increasingly popular in the industry for their great potential applications in various fields. On the other hand, the par-ticles of ceramic, such as the BaTiO3, have a high dielectric permittivity and high thermal resistance. The combination of these two materials (PVC–BaTiO3), with complementary properties, creates a new composite which could lead to a mate-rial system having a good performance.6,14–16 On the other hand, these composites are characterized by the relaxation phenomenon, especially in the low-frequencies range.17,18 The relaxation process depends, generally, on the temperature and the frequency range.19 The frequency responses such as the permittivity, of the com-posite, depend on various factors such as the grain size, the shape, the fill volume and the distribution of the load in the matrix. Several models have been developed in the literature to describe the relaxation phenomena. The most used model is Cole–Cole’s empirical model.20 The dielectric dispersion was mainly attributed to the polarization and the dielectric relaxation phenomena.21However, pure PVC and composites present low permittivity, whereas the relaxation mechanism is relatively slow, comparatively with molecular vibrations.22
In this paper, the dielectric response of composites (PVC–BaTiO3), containing 2, 5, 8 and 10 wt.%. BaTiO3 have been investigated in the low-frequency range. The study is based mainly on the characterization of dielectric properties such as the dielectric loss index and the dielectric constant of the composite (PVC– BaTiO3). The experimental data has been introduced in Matlab Simulink in order
to analysis the relaxation in the PVC–BaTiO3 composite based on the simulation of the Cole–Cole’s model.
2. Theoretical Relaxation Model
Several models expressing the dielectric properties and relaxation process which oc-cur in the solid insulation (such as amorphous polymers, semi-crystalline polymers), were developed in the literature.23–25 These physical phenomena are generally poorly identified and complex. For that, often empirical models are rather used without the formal explanation of the relaxation phenomenon. The Cole brothers’ model, based on the Debye’s formalism, was the most used because of its simplic-ity.26 Debye’s formalism was originally developed in several models.20 However, a general theoretical approach describing the dielectric relaxation is expressed by the following temporal response:
P (t) = P∞+ (Ps− P∞)(1 − e
−t
τ ), (1)
where τ is the relaxation time constant, P∞is the instantaneous polarization and Ps is the static polarization. Laplace’s transformation of the permittivity expression, using Debye equation, permits to deduce the response of the medium harmonic [Eq. (2)].27
ε(ω) = ε∞+
εs− ε∞
1 + jωτ. (2)
This equation describes the relaxation phenomenon in the case of a pure dielectric. From Eq. (2), we can extract the dielectric constant ε0 and the dielectric loss index ε00 as follows:
ε0(ω) = ε∞+
εs− ε∞
1 + (ωτ )2, (3)
March 20, 2018 14:6 IJMPB S0217979218501102 page 4
A. Berrag, S. Belkhiat & L. Madani
Fig. 2. Cole–Cole’s diagram.
ε00(ω) = (εs− ε∞) ωτ
1 + (ωτ )2. (4)
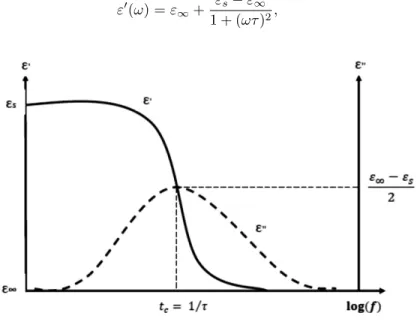
Figure 1 represents Bode’s diagrams plotted from Eqs. (3) and (4). tc = 1/(τ ) represents the relaxation frequency (fc). After eliminating the term (ωτ ) between Eqs. (3) and (4), we obtain the following equation:
ε02+ ε002− ε0(εs+ ε∞) + εsε∞= 0. (5) The equation representation in the axis system (ε0, ε00) is a circle centered on the ε0-axis to the point semicircle (εs+ε∞
2 , 0) and radius εs−ε∞
2 . Cole–Cole’s model is so represented in Fig. 2.
Otherwise, the relaxation in the frequency domain is represented by the Nyquist diagram of Fig. 2. This one provides a diagram permitting to deduce the following dispersion parameters:
• fcis the frequency at which the dielectric loss factor was maximal and corresponds to the top of the semicircle. At this frequency the constant dielectric is reduced to the half.
• The projection ∆ε0 of the constant dielectric related to the dispersion is the diameter of the semicircle.
• The maximum loss factor ∆ε00 is the radius of the semicircle.
• The static (εs) and instantaneous (ε∞) dielectric constants, are the intersections of the circle with the ε0 (constant dielectric) axis.
3. Experimental Procedure
The composition of the studied samples is given in Table 1. The basic element of the samples was the PVC resin. The following materials were used:
— PVC used in Algerian industry (K-value 68; powdered product of suspension polymerization).
Table 1. Content of PVC/BaTiO3composites.
Sample N◦ 1 2 3 4 5
Polymer (PVC) 100% 98% 95% 92% 90%
BaTiO3 0% 2% 5% 8% 10%
— Dioctyl phthalate (DOP) having a density equals to 0.982 g/cm3 at 20◦C and refractive index equals to 1.986 at 20◦C; product from CONTRACO, Germany. — Two types of samples (pure and doped at 2, 5, 8 and 10 wt.%) have been elaborated in agreement with International Standard Norm IEC 60811-3-2.28 The average BTO particle size is 70 nm.
The formulation has been mixed in a two-roll mixer for 7 min at a temperature of 150◦C.
The sample was prepared in the form of predetermined thickness sheets. The sheet is then cut into square of size 1 cm × 1 cm. The thickness of composite sam-ple is 1 mm. For the studies of the electrical properties, silver paste was applied to the two faces of the sample to provide electrodes. The capacitor was subjected to an alternating electric voltage of 1 V. The apparatus used was an impedance analyzer RLC (Wayne 6420) which can provide accurate measurements with the frequency range 1 MHz. The measurement error range was ±0.05%. Otherwise the microstructure of the samples was characterized by scanning electron microscopy (SEM type Hitachi-S2150) equipped with energy dispersive X-ray (EDX) spectrom-eter for the chemical elements analysis which is characterized by a scanning speed of 2◦/nm and an angle increment of 0.02◦in a 2θ range of 20◦to 80◦. The Fourier transform infrared (FTIR) spectroscopy (JASCO FT/IR4200 type) working in the frequency range 600–4000 cm−1and with 0.5 cm−1as maximum resolution at room temperature was used to characterize the structure of the elaborated composites. The weights and the composition were measured, respectively, using a sensitive electronic balance scale and confirmed by X-ray peak area.
4. Results
This work is a continuation of the previous paper8 where the dielectric properties of PVC, loaded with 5, 10, 15 and 20 wt.%. BaTiO3have been studied without the analysis of the relaxations. Also, a similar study has been made on the dielectric behaviors of water and thermally aged XLPE/BaTiO3 composites.9 The results recommend that the best rate of BaTiO3, as load, is around 10 wt.%, whereas, less than 5 wt.% is low, and more than 10 wt.% led to fissures and pores. We so focus the study especially on the samples containing 5 wt.% and 10 wt.% BaTiO3. Also, it has been found in the previous work,9that water diffusion in the composite decreases with the increasing of BaTiO3content from 5 wt.% to 10 wt.%. However, we give later some results obtained on samples containing 2 wt.% and 8 wt.%;
March 20, 2018 14:6 IJMPB S0217979218501102 page 6
A. Berrag, S. Belkhiat & L. Madani
(a) (b) (c)
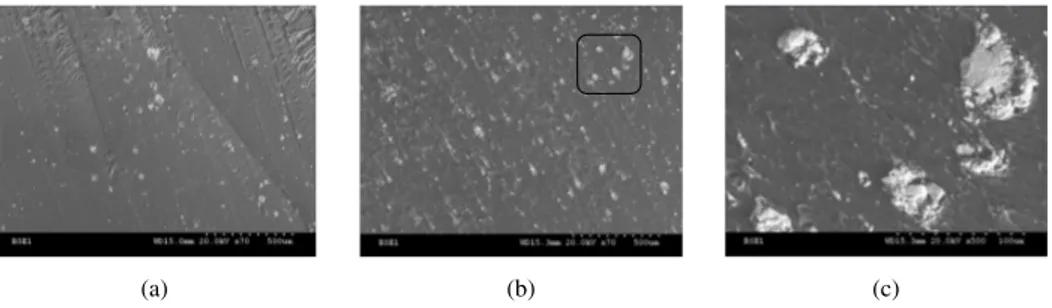
Fig. 3. SEM images of composites. (A) Sample N◦3, (B) Sample N◦5, (C) zoom of SEM image B (five times aggrandizement).
whereas the samples number two and number four give results very close to those of numbers three and five.
(a) SEM characterization
Following a MES sweep of several samples containing 5% and 10% of the filler, it is found that its distribution in the PVC matrix containing 10% is more homogeneous than that of the 5% and Fig. 3 shows this.
The SEM image (C) is the zoom of the zone picked out by a star in the SEM image (B). This one shows well the homogeneous distance between the grains of the composite. The average inter-granular distance is evaluated to 9 µm. From the SEM images, in the sample number three (5%.), we observed 100 grains in an area of ∼5.2 mm2. The grains of BaTiO
3 take 18.09% of the total surface. However, in the sample number five (10%), there is exactly the twice (200 grains were in a space of ∼5.2 mm2) in the same surface. This one corresponds also to 36.18% of the sample surface. This simple calculation is so in accordance with the BaTiO3 content in the composite samples.
Figure 4 shows the EDX mapping of the elemental distribution of Ba, Ti, C, Cl and O in the PVC matrix of the sample number three. The zoom (scale 50 µm) of the SEM image [Fig. 3(c)] is reproduced in Fig. 4(a). The aggrandizement was 10 times more. The bright regions correspond to the filler (BaTiO3) localization. Figures 4(b) and 4(c) represent, respectively, the distribution of Cl and C con-stituting the PVC matrix. The filler (BaTiO3) localization, picked out by circle, appearing less dark in the SEM image [Fig. 4(b)] and it is visible only a little in the SEM image of the Fig. 4(c). However, in the SEM images [Figs. 4(d)–4(f)], we can well observe that oxygen, titanium and barium are distributed in all the bulk of the matrix. Figure 4(g) shows the XRD spectrum of the composite where we can observe that the Cl peak is more resolved, whereas the PVC formula is (CH2– CHCl) nCl. The peak intensity seems to be in accordance with the SEM image of Fig. 4(b) comparatively with C and O.
The samples number two and number four, containing, respectively, 2 wt.% and 8 wt.% BaTiO3 are characterized by EDS in the following section. For the sample two (Fig. 5), we can see some aggregates appearing brighter in the SEM image of the
(a) (b)
(c) (d)
(e) (f)
Fig. 4. (Color online) EDX mapping of elemental distribution, Chlorine, Oxygen, Titanium and Barium of sample number five: (a) Composite morphology, (b) Chlorine distribution, (c) Car-bon distribution, (d) Oxygen distribution, (e) Titanium distribution, (f) Barium distribution and (g) XRD composite spectrum.
March 20, 2018 14:6 IJMPB S0217979218501102 page 8
A. Berrag, S. Belkhiat & L. Madani
(g)
Fig. 4. (Continued )
composite (first image left). These aggregates are ascribed to the filler (BaTiO3). Elemental distributions of Ba, Ti and O are shown in Fig. 5(a). Comparatively with Figs. 4(e) and 4(f), there are only a few Ba and Ti since the sample number two contains only 2 wt.% BaTiO3. Otherwise, we can observe in the XRD spectrum that the carbon peak is more resolved than the other chemical element (Ba, Ti, Cl and O) [Fig. 5(b)].
However, the SEM image of the sample four (Fig. 6) shows therefore more of the brighter aggregates (first image at left) which are ascribed also to the filler (BaTiO3). Therefore, the elemental distribution of the Ba and Ti contents are greater in the matrix [Fig. 6(a)]. However, we can observe in the XRD spectrum that the Cl peak is more resolved than the other chemical element (Ba, Ti, Cl and O) [Fig. 6(b)].
(b) Characterization by impedance analyzer
The frequency dependence of the permittivity and of the loss index for the pure PVC and the samples three and five are shown in Figs. 7(a) and 7(b) and Figs. 8(a) and 8(b) for the frequency ranges [20–140 Hz] and [115 Hz–1 MHz], respectively. (c) Characterization by FTIR spectroscopy
Figure 9 shows the FTIR spectra of the pure PVC and the PVC/BaTiO3 com-posites. The absorption spectra exhibit five absorptions. These ones, respectively, located at 3000 cm−1 and at 1750 cm−1, are characteristic of C–H and of (C–O)
50μm 50μm Cl 0 9 2% BaTiO3 C 50μm 0 9 Ba 50μm 0 5 Ti 50μm 5 0 O 50μm 7 0 0 1000 2000 3000 4000 5000
Full scale counts
(a)
(b)
Fig. 5. (Color online) EDX mapping of elemental distribution of sample two, (a) elemental dis-tribution of Chlorine, Carbon, Oxygen, Titanium and Barium, (b) XRD diffraction of composite.
bending. The second peak is due to the carbonyl group formation, similar to that found in Ref. 9. It is the characteristic of detecting the oxidation in PVC. Oth-erwise, the absorption band observed at 1250 cm−1 can be attributed probably to carbon bending (C–C). However, the absorption bands located at 1000 cm−1
March 20, 2018 14:6 IJMPB S0217979218501102 page 10
A. Berrag, S. Belkhiat & L. Madani
(a) (b) A) A) 50μm C 50μm 0 6 8% BaTiO3 O 50μm 5 0 Ba 50μm 0 5 Cl 50μm 0 6 Ti 50μm 5 0 0 1000 2000 3000 4000 5000
Full scale counts
Fig. 6. (Color online) EDX mapping of sample number four, (a) elemental distribution of, Chlo-rine, Carbon, Oxygen, Titanium and Barium, (b) XRD diffraction of composite.
and 700 cm−1 are well resolved and both are due to C–Cl bending. It can be seen that the spectra are superimposed with the characteristic spectrum of the pure sample. This is suggesting that there is no effect of BaTiO3 on PVC (it means that there is no chemical reaction between PVC and BaTiO 3 in which
a new functional appears). Otherwise, the composites’ spectra particularly the ones’ characteristic of the samples number four (8 wt.% BaTiO3) and number five (10 wt.% BaTiO3), tend to decrease in amplitude for probably possible apparition of absorption peaks expected towards 570 cm−1 and 440 cm−1. Two broad absorp-tion peaks’ characteristics, respectively, of the Ti–O vibraabsorp-tional mode and BaTiO3 such as reported in the literature were so expected at 570 cm−1and 440 cm−1.29,30 These ones cannot be recorded with the used spectrometer IR, whereas 610 cm−1is its short wave number limit. No chemical alteration, induced by BaTiO3, has effect on PVC.
5. Discussion
A peak appears in the curve of the dielectric constant and in parallel an inflection in the curve of the loss index around the value 20 Hz. Otherwise, a second peak, more resolved in the dielectric constant and an inflection in loss index curves, has been recorded at the frequency 500 Hz. These values of relaxation frequencies have been indicated in Ref. 31. However, as the BaTiO3 content icreases, the dielectric constant increases, especially at the range 20–500 Hz [see Figs. 7(a) and 7(b) and Fig. 8(a)], whereas after 500 Hz the dielectric constant of the sample three decreases below that one of the number two [Fig. 7(b)] whose content is only 5 wt.% BaTiO3. This latter seems to decrease more at high-frequencies around 1 MHz [Fig. 8(a)]. The peak of the most intense relaxation, occurring in the low-frequency region, seems to be dependent on the content of BaTiO3 and on the accumulation of charges at the interface between the sample and electrodes such as those indicated in Refs. 19, 31 and 32 because of the interfacial polarization (IP) expected at this frequency.
Otherwise, there is no change for the values (20 Hz and 500 Hz) of the relaxation frequencies after doping. The relaxation peaks appearing in the dielectric constant
(a) (b) 0 20 40 60 80 100 120 140 1,0 1,5 2,0 2,5 3,0 3,5 4,0 Pure PVC 5% wt.BaTiO3 10% wt.BaTiO3 Dielect ric const ant Frequency (Hz) 10 100 1000 10000 100000 1000000 1E7 1,6 1,8 2,0 2,2 2,4 2,6 2,8 3,0 3,2 3,4 Dielect ric const ant Frequency (Hz) Pure PVC 5% wt.BaTiO3 10% wt.BaTiO3
Fig. 7. (Color online) Dielectric constant versus frequency. (a) Frequency range [20–140 Hz], (b) frequency range [115–1 MHz].
March 20, 2018 14:6 IJMPB S0217979218501102 page 12
A. Berrag, S. Belkhiat & L. Madani
(a) (b) 0 20 40 60 80 100 120 140 0,0 0,2 0,4 0,6 0,8 1,0 1,2 1,4 Pure PVC 5% wt.BaTiO3 10% wt.BaTiO3 L o s s in d e x Frequency (Hz) 10 100 1000 10000 100000 1000000 1E7 0,0 0,1 0,2 0,3 0,4 0,5 0,6 Loss I n dex Frequency (Hz) Pure PVC 5% wt.BaTiO3 10% wt.BaTiO3
Fig. 8. (Color online) Loss Index versus frequency. (a) Frequency range [20–140 Hz], (b) frequency range [115–1 MHz]. 4500 4000 3500 3000 2500 2000 1500 1000 500 60 70 80 90 100 110 Pure PVC 2% BaTiO3 5% BaTiO3 6% BaTiO3 8% BaTiO3 10% BaTiO3 Transmittance (T%) Wavenumber (cm-1)
Fig. 9. (Color online) FTIR spectra of pure PVC and PVC/BaTiO3composites.
curves are also present as inflections in one of the loss index curves. They are located in the same frequencies (20 Hz and 500 Hz). The result is in agreement with that carried out in Ref. 33.
However, the loss index curve can be divided in two parts, in the frequency ranges (20–25 Hz) and in the frequency range (115–1 MHz). In the first part of the curve (20–25 Hz), the loss index decreases when the filler content increases [see Fig. 8(a)]. However, the intensity of the relaxation peak decreases when the filler content also increases.
Otherwise, for all frequencies greater than 25 Hz, the loss index of the sample number three remains smaller than that of the sample number one (pure PVC).
100 101 102 103 0.5 1 1.5 2 2.5 3 3.5 4 D ie le c tr ic c ons ta nt ( a bs ) Bode Diagram Frequency (Hz) Pure PVC 5% BaTiO3 10% BaTiO3 System : 10% BaTiO3 Frequency (Hz): 20.5 Dielectric constant (abs): 2.75 System : 5% BaTiO3 Frequency (Hz): 20.5 Dielectric constant (abs): 2.52 System : Pure PVC Frequency (Hz): 20.5 Dielectric constant (abs): 2.15 101 102 103 104 1.6 1.8 2 2.2 2.4 2.6 2.8 3 3.2 3.4 3.6 D iel ect ri c co n s ta n t ( a b s ) Bode Diagram Frequency (Hz) Pure PVC 5% BaTiO3 10% BaTiO3 System : 10% BaTiO3 Frequency (Hz): 504 Dielectric constant (abs): 2.67 System : Pure PVC Frequency (Hz): 504 Dielectric constant (abs): 2.18 System : 5% BaTiO3 Frequency (Hz): 504 Dielectric constant (abs): 2.61 (a) (b)
Fig. 10. (Color online) Bode diagram, (a) frequency range [20–140 Hz], (b) frequency range [115–1MHZ]. 0 0.5 1 1.5 2 2.5 3 3.5 4 0 0.5 1 1.5 Nyquist Diagram Dielectric constant Los s i n de x Pure PVC 5% BaTiO3 10% BaTiO3 system :10% BaTiO3 Real : 2.52 Imag : 1.18 Frequency (Hz):19.9 system : Pure PVC Real : 1.93 Imag : 0.963 Frequency (Hz):19.9 system : 5% BaTiO3 Real : 2.23 Imag : 1.23 Frequency (Hz):19.9 0 0.5 1 1.5 2 2.5 3 3.5 0 0.1 0.2 0.3 0.4 0.5 0.6 0.7 0.8 Nyquist Diagram Dielectric constant Los s i n de x Pure PVC 5% BaTiO3 10% BaTiO3 system : 5% BaTiO3 Real : 2.58 Imag : 0.409 Frequency (Hz):502 system : 10% BaTiO3 Real : 2.58 Imag : 0.673 Frequency (Hz):502 system : Pure PVC Real : 2.14 Imag : 0.419 Frequency (Hz):502 (a) (b)
Fig. 11. (Color online) Nyquist diagram, (a) frequency range [20–140 Hz], (b) frequency range [115–1 MHZ].
In reverse, in the frequency range (25–1 MHz), the loss index of the sample five is greater than that of the sample one (pure PVC) and the sample number three.
With the use of frequency (or time) of relaxation of each sample (pure PVC, composites, three and five), the plotting of the Bode’s diagram (Fig. 10) and Nyquist (Fig. 11) based on Cole–Cole’s model and Debye, allows to evaluate the dielectric parameters such as dielectric constant, loss index and the point of relaxation.
The dielectric relaxation is not a simple procedure of peaks allocation mecha-nism, which cannot be achieved by simply observing the dielectric set. The tran-sitions can be attributed to the IP also known as the effect of Maxwell–Wagner– Sillars (MWS),34–36 where it is explained that the electrical effects in the PVC composites can be due to the effects of phase transitions and the polarization and conductivity mechanisms.37 All composites at room-temperature, as we can see, present a relaxation at the same frequency. Otherwise at room-temperature, the
March 20, 2018 14:6 IJMPB S0217979218501102 page 14
A. Berrag, S. Belkhiat & L. Madani
Cole–Cole’s model provides more information on the mechanism of relaxation as we can see in Figs. 10 and 11.
In our case, two semicircles are clearly distinctly formed corresponding to the samples number three and five. The relaxation frequencies are, respectively, evalu-ated to 19.9 Hz for the samples one, three and five in the frequency range 20–140 Hz. However, in the frequency range (115–1 MHz), the relaxation frequencies have been evaluated to 504 Hz for the three samples (one, three and five). The values well correspond to those experimentally measured.
It is well-known that the MWS effect occurs in complex systems that present the electrical heterogeneity due to the accumulation of charges at the interfaces of the system.17,19,35This can be clearly observed with the dielectric permittivity of BaTiO3which is remarkably higher than that of PVC. BaTiO3and the charges can-not be well-scattered in the PVC matrix, resulting of the preparation phase of the samples; consequently, large amount of dipoles occur in the matrix. These induced dipoles should have difficulties in following the alternating electric field, so the relax-ation process occurs in the low-frequency region. This implies a slower relaxrelax-ation process (α-relaxation process). Similarly, the time required for a reorientation of dipoles is called the relaxation time τ and the inverse is the relaxation frequency f . When the frequency of the electric field is much higher than the relaxation fre-quency of a type of polarization, the polarization may not occur. Conversely, if the frequency of the electric field is much smaller than the relaxation frequency, polar-ization occurs instantaneously and the phase difference between P (polarpolar-ization) and E (electric field) is zero. But if the frequency of the electric field and the fre-quency of relaxation are similar, the phase difference (δ) increases to a maximum value. So, the resonance frequency (fc) is, also, the relaxation frequency.34
Otherwise, the concentration of BaTiO3particles affects the maximum variation of the loss. As BaTiO3 is a typical ferroelectric material, ∼140◦C (TC) is its char-acteristic temperature transition, from the ferroelectric phase to the para-electric phase.31On other hand, the samples have been elaborated at 150◦C and measure-ments have been taken in the ambient temperature. Below this temperature (TC), the BaTiO3consists of a large number of grains whose orientation is similar to that of the domains (areas). These domains possess a spontaneous polarization due to the low symmetry of the crystal lattice with respect to the unit cell in the paraelec-tric phase. Under the influence of the elecparaelec-tric field, the dipole moment of at least of one side of these areas will be able to follow the applied field contributing to the overall sample polarization.31–34 Therefore, the volume and quantity of charge of BaTiO3 in the matrix, and thus, the intensity of the overall relaxation of sample will be influenced and without that the relaxation time will change.
It is to highlight that at low concentration of the BaTiO3 particles there is a decrease of the loss index (at least up to 5 wt.% of BaTiO3); however, for higher contents of BaTiO3 (from 5% to 10%), the loss index increases indicating that the dielectric losses increase when considerable amounts of BaTiO3particles (up to 10%) are incorporated in the PVC. The result is reverse with that one carried out in
Ref. 38 for low-density polyethylene (LDPE); the more the presence of BaTiO3, the lower the dielectric loss. The same result has been obtained in the previous work.8 In our PVC samples the balance of space charges due to faults and BaTiO3, seems to be rather reached at 5 wt.% [Figs. 8(a) and 8(b)]. However, in the composite (XLPE/BaTiO3), the dielectric losses’ increase, has been recorded for the samples containing more than 10 wt.%.9The result is ascribed to the space charges and to the heterogeneous distribution of BaTiO3, whereas the aggregates can be seen in the SEM image [Fig. 3(c)].
The dielectric response of the composite PVC–BaTiO3, in the frequency ranges (20–140 Hz; 115–1 MHz) and at room-temperature, has been investigated in the present work. The study allowed us to assess the potential use of a new material to provide the isolation function for low-frequency applications, whereas this cable sheath is expected to be employed in high voltage.
The work concerns primarily on the characterization of the dielectric properties of the polymer (PVC) loaded BaTiO3, depending on the display frequency, and on the influence of the loading on the relaxation phenomenon. For that, different char-acterization methods have been used. The impedance analyzer RLC permits us to estimate the relaxation frequency. They are evaluated, respectively, to 19.9 Hz and 504 Hz in the ranges 20–140 Hz and 115–1 MHz with ±0.05% as the error range. The theoretical model based on the Cole–Cole’s model and from the experimen-tal data allowed us to validate the values found. The relaxation phenomenon was present in all samples and at the same frequency in each frequency range. All relax-ation processes that were recorded (from lowercase to fastest) are allotted to the IP effect MWS, the glass transition of the rubber matrix of the amorphous polymer, or the local movement group side of the macromolecular chains..34–36 Otherwise, relaxation can be modified at a high-frequency, greater than 1 kHz. Other relax-ations due to BaTiO3presence in the composite can exist, but at higher frequency, such as that reported in the literature.39,40 These relaxations cannot be observed here, whereas the frequency responses are recorded in low frequency.
Otherwise, the characterization using FTIR spectroscopy shows well that the spectra are superimposed (Fig. 9). These results show that the incorporation of BaTiO3 does not modify the PVC structure. No extra IR bands are found in the composite samples compared to that of the neat PVC (Fig. 9), which indicates the absence of degradation and, hence, chemical changes in the matrix during processing which could influence electrical properties. The same results have been obtained by Gonzalez-Benito et al.38 concerning HDPE filled with BaTiO3.
6. Conclusions
The study results obtained on the composite (BaTiO3 /PVC) are summarized as follows.
The study allowed us to assess the potential use of a new material to provide, a best isolation function for low-frequency applications, whereas this cable sheath is expected to be employed in the low and high voltage electrical networks.
March 20, 2018 14:6 IJMPB S0217979218501102 page 16
A. Berrag, S. Belkhiat & L. Madani
— Dielectric constant increases when BaTiO3 as filler increases, but its value re-mains included in the admissible limit for good insulation.
— The dielectric loss decreases as a function of the filler up to 5 wt.% of BaTiO3. For a filler amount greater than 5 wt.%, the dielectric losses increase, since, the distribution of BaTiO3particles was heterogeneous, therefore, aggregates which are at the origin of the pores, consequently are space charge. These dielectric losses remain, nevertheless, lower than that of pure PVC.
— At low concentration of BaTiO3 particles, there is a decrease of the loss index (at least up to 5 wt.% of BaTiO3); however, for higher contents of BaTiO3(from 5% to 10%), the loss index increases but remains smaller than that of pure PVC. — The relaxation phenomenon was present in all samples. All the recorded relax-ation processes (from lowercase to fastest) are allotted to the IP effect. The re-laxation frequencies have been evaluated, respectively, to 19.9 Hz and to 504 Hz in the ranges 20–140 Hz and 115–1 MHz. These values have been validated using Cole–Cole’s model.
— The incorporation of BaTiO3 does not modify the PVC structure. No extra IR bands are found in the composite samples, compared to that of the neat PVC (Fig. 9), which indicates the absence of degradation and, hence, chem-ical changes in the matrix during processing which could influence electrchem-ical properties.
These results, together with those obtained by FTIR, indicate that the presence of BaTiO3 particles does not exert any influence on the structure of the PVC, and show well that BaTiO3 as filler improves the dielectric properties of PVC.
References
1. A. Greenwood, IEEE, Trans. Electr. Insul. 15, 134 (1980). 2. B. Adhikari and S. Majumdar, Prog. Polym. Sci. 29, 699 (2004).
3. B. Han et al., Effect of nano silica filler size on treeing breakdown lifetime of epoxy nanocomposites, in Proc. 9th Int. Conf. Properties and Applications of Dielectric Materials (Harbin, China, 2009), 733–736.
4. V. Durman and J. Lelˆak, J. Electr. Eng. 61, 229 (2010).
5. L. Boukezzi et al., Ann. Chim. Sci. Mater. 31, 561 (2006).
6. P. Barber, S. Balasubramanian and Y. Anguchamy, Materials 2, 1697 (2009). 7. K. Sonod and T. Hua, J. Eur. Ceram. Soc. 30, 381 (2010).
8. L. Madani, A. Berrag and S. Belkhiat, Ann. Chim. Sci. Mater. 38, 167 (2013). 9. L. Madani et al., Int. J. Mod. Phys. B 29, 1550186 (2015).
10. K. Sonoda and J. Juuti, Compos. Struct. 92, 1052 (2010). 11. R. Popielarz et al., Macromolecules 34, 5910 (2001).
12. Z.-M. Dang, Y.-H. Lin and C.-W. Nan, Adv. Mater. 15, 1625 (2003). 13. A. T. Mohamed, J. Electr. Power Energy Syst. 64 (2015) 469. 14. I. K. Bishaya and S. L. Abd-El-Messieh, Mater. Des. 32, 62 (2011). 15. P. K. Khare and A. Pal, J. Electrost. 68, 328 (2010).
16. M. A. Alam and M. H. Azarian, Microelectron. Reliab. 51, 946 (2011). 17. C. V. Bouanga and K. Fatyeyeva, J. Non-Cryst. Solids 356, 611 (2010).
19. C. S. Ramya et al., J. Non-Cryst. Solids 354, 1494 (2008). 20. R. Brahem et al., J. Ceram. Int. 40, 9355 (2014).
21. T. Nezakati, A. Tan and A. Seifalian, J. Colloid Interface Sci. 435, 145 (2014). 22. K. M. Jadhav et al., J. Compos. B 43, 3406 (2012).
23. M. Lazebnik et al., IEEE Microw. Wirel. Compon. Lett. 17, 822 (2007). 24. J. Xiang et al., Comput. Geosci. 29, 647 (2003).
25. L. C. Haynes and J. P. Locke, J. Microw. Power Electromagn. Energy 30, 124–131 (1995).
26. Y. M. Koledintesva, J. Electr. Eng. 5, 97 (2002). 27. T. Samiha Bishay, Egypt. J. Sol. 23, 179 (2001).
28. International Standard Norme IEC 60811-3-2, Second edition, 2005-03, Norme ICE. 29. A. Choudhury, Mater. Chem. Phys. 121(1–2), 280 (2010).
30. E. K. Nyutu et al., J. Phys. Chem. C 112, 9659 (2008).
31. A. Patsidis and G. C. Psarras, Express Polym. Lett. 2, 718 (2008). 32. S. Raghu et al., J. Radiat. Phys. Chem. 98, 124 (2014).
33. M. Olszowy, Condens. Matter Phys. 6, 307 (2003). 34. A. M. Y. El-Lawindy, Egypt J. Solids 28, 97 (2005). 35. K. Yu et al., J. Appl. Phys. 113, 034105 (2013). 36. G. Hu et al., J. Alloys Compd. 619, 686 (2015).
37. T. Ra¨ıssi et al., Rev. Int. G´en. ´Electr. 8(1), 97–117 (2005).
38. J. Gonzalez-Benito et al., Polym. Test. 32, 1342 (2013). 39. J. F. Lomax et al., J. Appl. Phys. 115, 1014103 (2014).