HAL Id: hal-02567919
https://hal.archives-ouvertes.fr/hal-02567919
Preprint submitted on 8 May 2020HAL is a multi-disciplinary open access
archive for the deposit and dissemination of sci-entific research documents, whether they are pub-lished or not. The documents may come from teaching and research institutions in France or abroad, or from public or private research centers.
L’archive ouverte pluridisciplinaire HAL, est destinée au dépôt et à la diffusion de documents scientifiques de niveau recherche, publiés ou non, émanant des établissements d’enseignement et de recherche français ou étrangers, des laboratoires publics ou privés.
The quest for green welfare state in developing countries
Tancrède Voituriez
To cite this version:
The quest for green welfare state
in developing countries
Tancrède Voituriez
April 2020
The quest for green welfare state in developing countries
Tancrède Voituriez (Cirad, IDDRI-Sciences Po and PSE-WIL)
This version: 26/03/2020
Introduction
In 2015, the world nations agreed to tackle the “two greatest challenges of our century” to paraphrase Nick Stern (2009) – namely growing inequality and climate change. They signed up the Agenda 2030 and endorsed its 17 sustainable development goals (SDGs), thereby committing to shift development patterns towards sustainable paths. The same year, the Paris Agreement on climate change was celebrated as a breakthrough in environmental governance, marking a watershed between an old world suffocating under fossil-fuel pollution, and a green new world matching the economic aspiration of a growing world middle class within a ‘safe operating space for humanity’ (Steffen et al., 2015). The transition from one world to the other is not part of any handbook however, nor was it laid out in companion texts to the SDGs and the Paris Agreement. The recipe for turning coal, oil and gas into carbon-free watts and joules while curbing the seemingly irresistible rise of income and wealth inequalities seems as coveted as were alchemist formulae to turn sand into gold a few centuries ago. The practicality of the transition remains debatable, as global inequality and CO2 emissions seem stubbornly stuck to their long-term rising trend (Wid, 2018 ; Carbon Tracker Institute, 2019).
To tackle the magnitude of inequality and environmental intertwined challenges, some scholars framed the concept of green welfare state or “ecostate” almost twenty years ago. They called for a transformation of the welfare state as we know it in most of OECD countries into a governance system supplying the insurance mechanisms and public goods and services to cope with environmental degradation and shocks. This paper is a quest of emerging ecostate in existing literature, and in most recent data.
The first section presents a literature review on welfare state and ecostate, and on the expected transition from one to the other. In section two, we update Wood and Gough (2006) typology on welfare regimes to include the most recent available data covering income inequalities and environmental performance. We conduct an empirical multivariate analysis and come up with four distinct type of ecostates: unequal, super unequal, balanced and insecure. We focus in sections four and five on the particular case of insecure ecostates, which gathers a large share of emerging economies. Taking Nigeria as an example, we delineate the characteristics of ecostate insecurity and possible way forward, drawing on ongoing in-house research made in this country. Research gaps and bridging initiatives are hinted at in conclusion.
2
1. From welfare state to ecostate: A literature review
The debate on the emergence of a green welfare state or “ecostate” dates back to the late 1980s, with the conflation of rising environmental alarm and the crisis of the welfare state and Fordist accumulation model (Dente, 1996). Meadowcroft (2005) defines the Ecostate as “government programmes dedicated to controlling environmental impacts and adjusting patterns of socio/ecological interaction to avoid ecological risks and enhance ecological values” (Meadowcroft, 2005, p.3). An ecological state would be one “committed to sustainable development, to securing a social development trajectory which remained within the frontiers of environmental sustainability” (id.). Last, the ecological state “is predicated on a recognition that environmental systems are critical to long term social welfare, and that their protection and enhancement require conscious and continuous adjustment by the public power” (Meadowcroft, 2005, p. 6).
The rationale for transforming the welfare state into an ecostate lies in the need to manage the environmental risks coming on the top of the inter-temporal risks and market failures mitigated by welfare programs. As Koch and Fritz (2014: 2) argue, “not only will social policies need to address the inequalities and conflicts that are likely to emerge in the transition towards more sustainable production and consumption patterns, it will also be increasingly necessary to formulate them in ways that create synergy with environmental goals and that are acceptable to the electorate”. They deduced that welfare states, and particularly social democratic welfare state following Esping-Andersen (1990) typology, are promising candidates because of their track records on social risk-coping mechanisms, social conflict resolution and income and wealth “fair” distribution.1 Hence Gough (2008) argues that
“social democratic welfare states have been pioneers in developing comprehensive environmental policies, including climate change mitigation”, prejudging that this edge could be sustained. Dryzek (2008) arrives at the “provisional conclusion” that social-democratic welfare states (…) are better placed to handle the intersection of social policy and climate change than the more liberal market economies with more rudimentary welfare states (Dryzek, 2008: 340).
Two theoretical arguments underpin the hypothesis of a synergy between social-democratic welfare regimes and ecostate. The first is that the changing climate, adaptive responses to the changing climate, and efforts at mitigation create ‘winners’ and ‘losers’, so that “an array of policy measures may be needed to cushion shocks imposed on specific societal sectors” (Meadowcroft, 2008: 336). Second, in countries with lower income inequalities and energy poverty, it should be easier to tax and curb energy consumption because of less regressive and perverse distributive effects (Kennett and Lendvai-Bainton, 2017, p. 381).
The synergy hypothesis lacks empirical grounding however. The possibility of competition, clashes and conflicts is emphasised by environmental economists such as Victor (2008), Jackson (2009), and Bailey (2015), who point to the weak empirical evidence for absolute decoupling and the much too early praise of welfare state’s moult into ecostate. The empirical assessment of the linkages between social and environmental policies in welfare states can be found in one single study due to Koch and Fritz (2014). Drawing on ISSP 2010 data collating environmental attitudes, the two authors have tried to figure out whether social-democratic welfare states were “greener” than conservative and liberal welfare states. To that end, they created a typology of ecostates (established, deadlocked, failing, emerging and endangered) based on observation of their past development. They further investigated whether individuals from social democratic welfare states were more concerned about the
1 Esping-Andersen (1990) distinguished three welfare state regimes in the OECD world, which he labels liberal,
3 environment than about economic growth, more in favour of government intervention to protect the environment and more willing to cut the standard of living to protect the environment than individuals from other forms of welfare states.
Their main findings suggest that there is no ‘automatic’ emergence of the ecostate based on existing welfare institutions. Representatives of all welfare regimes are spread across established, deadlocked, failing, emerging and endangered ecostates. Second, responses to the statements ‘economic growth always harms the environment’ and ‘governments should pass laws to make ordinary people protect the environment, even if it interferes with people’s rights to make their own decisions’ did not vary across welfare regimes. Yet, people from social-democratic countries expressed more often than average their willingness to accept cuts in their standard of living in order to protect the environment. Jakobsson, Muttarak and Mi Ah Schoyen (2018) investigated further public attitudes towards environmental and traditional welfare policies, asking the question as to whether individuals that care for one area also care for the other. Do the preferences in these two policy spheres complement or substitute one another? They tested these hypotheses at individual- and country-level, using data from a small set of 14 countries included in three waves (1993, 2000, and 2010) of the environmental module in the International Social Survey Programme. Specifically, they investigated the relationship between attitudes towards income redistribution (indicator of support for welfare policy) and willingness to pay for environmental protection (indicator of support for environmental policy). Their findings suggest that attitudes in the two areas are substitutes in the total sample, but that the relationship is weak and statistically significant in some specifications only. In short, although there is substantial country variation, they found no evidence of a double-worry or synergy between support for environmental and welfare policies in their sample. Drivers behind preferences for preserving the environment and preferences for income redistribution are likely to be different, they argue, and so are the scale and time horizon of the social returns of the two types of policies. Therefore, they conclude, one “cannot expect that positive attitudes towards income redistribution will enhance the willingness to pay for policies that benefit the environment” (Jakobsson, Muttarak and Mi Ah Schoyen, 2018: 328). The existence of a welfare state system is a weak predictor of the emergence of, or transformation into, an ecostate.
2. An empirical comparison of welfare regimes in developing countries
2.1. Typologies of welfare states in developing countries
Esping-Andersen (1990) laid out a landmark typology of welfare states, splitting them into “liberal”, “conservative” and “social-democratic”. His basic insight was that the differences between welfare states in the North were not simply ones of scale (amount of spending), but reflected different architectures and designs. Drawing on Polanyi, he hypothesized that welfare regimes differed in terms of ‘decommodification’ – i.e. “the degree to which individuals, or families, can uphold a socially acceptable standard of living independently of market participation” (ibid.: 37). Some scholars have tried to expand or refine his work, to consider the largest possible range of country situations, and include in particular developing countries, which were not in the original scope of Esping-Andersen’s
4 Rudra (2007) recalled that the early comparative political economy (CPE) literature focused on the convergence hypothesis across OECD welfare state regimes, making the implicit assumption of an “extreme divergence” among developing countries – a kind of chaos from where no clear pattern emerged as regards the management of the basic social risks by the government and by non-state communities. The very existence of a welfare state was deemed implausible in countries, which did not experience industrialization. What was assumed was that the level of industrialization (and income) precluded or permitted the existence and the structure of a welfare state. “Convergence in income across OECD countries was supposed to foster convergence in social structure and public policy choices, while uneven industrialization was mirrored by endless types of would-be welfare regimes in the poor South” Rudra (2007) emphasised.
Rudra (2007) argued that at least three ideal types of welfare states had emerged in the developing world, mirroring different domestic institutional arrangements. A productive welfare state streamlining efforts towards promoting market dependence of citizens. Productive welfare states (such as Korea at the early stage of its post-war development) prioritised commodification, especially through mass education and capacity building, which pulled people into wage labour in export-oriented production sectors. A protective welfare state would prioritize the protection of certain individuals from the market, what Esping-Andersen refers to as “decommodification”. Protective welfare states (such as India) focus on the decommodification of formal sector workers (typically behind tariff barriers or subsidies). A third group assembles elements of both: the weak dual welfare state. Dual welfare states (such as Brazil) combined both emphases. Rudra’s analysis ultimately challenged the standard view that welfare states are part of “late” capitalist development and take various forms in the industrialized world only.
Gough (2004) embraces a quite different perspective. He contends that few states are sufficiently developed for the welfare regime to be seen as an actual or potential welfare state regime. In many cases, he argues, the state does nothing for popular welfare, and in some cases predatory elites running the ‘state’ actually undermine popular welfare including through violent conflict. Wood and Gough (2006) label these ‘informal security’ and ‘insecurity’ regimes respectively. They recognise that states exist in the ‘informal security regimes’, but argue that states are primarily vehicles for patron-client relationships and the reproduction of political and economic inequalities. The consequence of this is that the construction of a more modern state (‘declientelisation’) is more important than, or at least a prerequisite for, decommodification, giving a sense of a sequential development of the welfare state in a deterministic fashion. Gough et al. (2004) and Wood and Gough (2006) suggest that the concept of welfare regimes in the South needs to take into account other mechanisms or players that do not exist in the North, including the local communities, foreign aid donors and remittances sent by international migrants.
Bevan (2004) coined the term “in/security” regime to describe situations where the very essence of the nation-state is contested. Predatory capitalism combines with variegated forms of oppression and clientelization, people overwhelmingly rely on individuals in households, unorganized community or organized aspects of civil society to secure livelihood, all factors which combine to generate gross insecurity and low level of need satisfaction. Wood and Gough (2006) built on the notion of insecurity regime and tried to substantiate it, through the empirical clustering of developing countries welfare regimes. Their cluster analysis covers a large set of countries outside the OECD. It explores cross-national pattern of welfare mixes measured by public spending on health and education as a share of GDP, and the sum of international inflows of aid and remittances as a share of GNP, and welfare outcomes (captured by HDI). They ended up with three identifiable clusters and a taxonomy of global welfare regimes, namely welfare state, informal security regimes, and insecurity regimes, in
5 developing countries. Their classification depicts Sub-Saharan African as a region of failed states, whose failure is sustained by a vicious circle of “insecurity, vulnerability and suffering for all but a small elite and their enforcers and clients” (Wood and Gough, 2006: 1707). Counter-examples might exist, they conclude, pockets of social development and African success stories could qualify but they “do not alter this conclusion” (id.). Key to shift away from the insecurity regime is to shift the focus from de-commodification (the OECD welfare state story, to put it short) to de-clientelization. Assuming that prevailing arrangements, which best describe insecurity regimes when compared to the two other regimes, are characterized by patron-client relationships, they infer that de-clientelization is the main driver of improvement toward welfare state. Insecurity regimes as defined by Wood and Gough are those countries experiencing a low-to-very low level of HDI, a low level of public spending, and a medium-to-high level of international flows (Wood and Gough, 2006: 1703).
2.2. Updating welfare regimes typologies with inequality and environmental data
Wood and Gough’s three types of welfare regimes (welfare state regime, informal security regimes, and insecure regimes) were defined in the mid-2000s when conversation on development rolled on the Millenium Development Goals, the value-added of Official development assistance (ODA) and state failure/state building in particular in Sub-Saharan Africa. They typology mirrors the concerns of its time. It did not pay attention to environmental protection (which was almost absent from the MDGs) nor to domestic inequality reduction, albeit at the core of the welfare state’s social contract. We complement the classification made by Wood and Gough (2006) so as to infer a classification of countries transitioning to an ecostate. The theoretical framework is given by pioneer work made on economic inequality and environmental degradation relationships. This body of literature, which developed outside the welfare state community, provides theoretical insights and provisional evidence on causation mechanisms between these two issue areas. It stresses in particular that economic inequality mutates into inequality of capacity to cope with economic and environmental shocks. In essence, the more unequal a society, the less resilient it is to external shocks – including climate shocks (World Bank, 2015). Not only climate change “aggravates fragile situations, feeds insecurity and conflict”2 and thus exacerbates insecurity in relation to the narrow definition of physical integrity and
political stability: it is in itself an additional factor of insecurity for people in their relationships to power. Climate risk increases the demand from exposed population for insurance and social protection within the community, by the State or by international donors, thereby raising the risk to sustain patronage and clientelism. Climate change can be seen as a compounding factor of insecurity in the sense given by Bevan (2004) and Wood and Gough (2006), and a new risk on its own to which diverse forms of welfare regimes choose to respond or not.
We expand Wood and Gough pioneer work in three directions.
First we update data on health and education government expenditure, to take into account the changes in budget resources and spending which occurred over the last 15 years – including hence the commodity boom of the late 2000s. Data were downloaded from the World Bank Development Database3. Second, we take an explicit inequality and environmental protection perspective, arguing
2 UN Development Chief to Security Council: Climate change ‘aggravates fragile situations, feeds insecurity and
conflict’, UNDP Post, January 25, 2019.
6 that inequality mitigation provides the bedrock of welfare state or regimes and need to be explicitly considered, while environmental protection falls into the realm of ecostate (table 1).
To reflect the structure of economic inequality, we choose the top 10%/bottom 50% income ratio, in the absence of consistent data for the top 1% in all countries. We use the WID database to generate this ratio4.
As regards environmental protection, we use the EPI, which provides detailed-enough data coverage for developing countries. The caveat remains of ad hoc weighting of performance sub-indicators aggregated. The number of developing countries with full data coverage across our set of indicators amounts to 98.
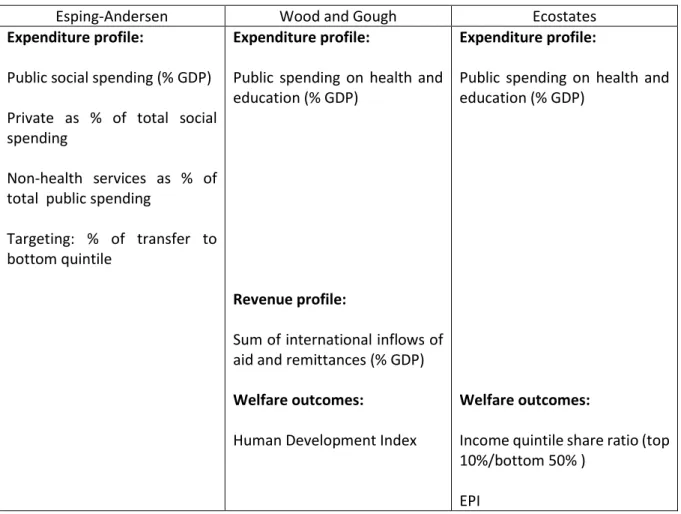
Table 1: Descriptive variables of welfare state and Ecostate regimes
Esping-Andersen Wood and Gough Ecostates
Expenditure profile:
Public social spending (% GDP) Private as % of total social spending
Non-health services as % of total public spending
Targeting: % of transfer to bottom quintile
Expenditure profile:
Public spending on health and education (% GDP)
Revenue profile:
Sum of international inflows of aid and remittances (% GDP)
Welfare outcomes:
Human Development Index
Expenditure profile:
Public spending on health and education (% GDP)
Welfare outcomes:
Income quintile share ratio (top 10%/bottom 50% )
EPI
The results of our multivariate analysis are presented in table 2 next page. The centre values of each cluster are given on the top of the country lists.
Four clusters emerge out of the multivariate analysis.
- A first group of countries displays a high5 level of health and education government
expenditures, a high level of inequality, and a high level of environmental performance. This
4 https://wid.world
5 “High” “medium” and “low” are to be considered in relative terms, meaning as a way to compare one group
7 first group outperforms the other groups on the environmental criterion. We label this group “Unequal Ecostates” for their high level of inequality.
- A second group gathers countries with a low level of health and education government expenditures, a high level of income inequality, and a medium-high level of environment protection. The level of income inequality in this group far exceeds income inequality level in the other groups. We label it “Super Unequal Ecostates”.
- A third group of countries is characterised by a low-to-medium level of health and education government expenditures, a low level of income inequality, and medium environmental performance. This is the group with the lowest income inequality level. We label it “Balanced Ecostates” for their medium performance across the whole set of criteria.
- A fourth group gathers countries with the lowest level of health and education government expenditures, the lowest EPI and medium inequality level. The poor performance on the social and environmental criteria deserves this group the label of “Insecure Ecostates” in reference to Wood and Gough (2006) typology.
Some striking features can be stressed out.
1. The top unequal countries are countries where public expenditures on education and health are low. Yet the reverse is not true. Countries with the highest level of social spending are countries displaying a high level of inequality (even though it is not the highest). This correlation is not causation (in one direction or in another) yet it suggests at least that policies designed to tackle inequality of opportunities (access to education and health) do not transfer at once into a low level of inequality of outcome. It is very likely that the high level of income inequality is one of the determining factors of the high level of social spending. And it is highly plausible that the latter mutates into income inequality reduction after a certain delay (which could not be captured in our analysis) with the help of additional inequality mitigation measures such as progressive taxes.
2. A high level of environmental performance is compatible with a high level of inequality. The hypothesis that inequality reduction comes along environmental protection cannot be confirmed by our analysis. There is no perfect match between environmental protection and inequality level across the whole range of country groups. This can be read as the confirmation that inequality-environment relationship is neither univocal nor stable across countries.
3. The larger number of countries falls within the “balanced” group. These countries enjoy the lowest level of inequality, with medium level of spending on education and health and medium level of EPI. At stake for them to upgrade their environmental performance without trading this off with an increase in inequality.
8
9 4. Insecure ecostates differ strikingly from “insecure” country regimes that Wood and Gough (2006) come up with in their analysis of welfare regime in developing countries. Their category of insecure welfare regimes encompassed Subsaharan African countries almost exclusively (Afghanistan and Gaza completing the group). This is not the case here. Subsahran African countries and low income countries more broadly are spread across the four ecostate groups. By contrast, large emerging economies are to be found in the group of insecure ecostates: Bangladesh, India, Indonesia, Nigeria, Pakistan, Philippines... In these middle- income countries lives the majority of the world poor. These countries face the daunting task to reduce inequality at the bottom of the distribution while mitigating environmental risks associated with growth-led poverty reduction strategies. Their succeeding or not in mutating from emerging economies into emerging ecostate will be critical for the global achievement of the sustainable goals and the Paris Agreement on Climate change.
3. Characterising insecure Ecostates - the case of Nigeria
Nigeria is a lower-middle income country, with annual per capita income of about US$2,500 (World Bank, 2018). It is Africa’s largest economy, and despite Nigeria’s abundant human and natural resource capital, around a third of the 180 million Nigerians live below the national poverty line, with around another third just above. Nigeria is set to surpass the United States to become the world’s third most populous country by 2050 according to forecasts from UNDESA (2018).
Nigeria’s per capita GHG emissions are around 2 tCO2e per capita. The country represents a tiny 1% of global GHG emissions. It however stands to suffer dramatically from climate change. Maplecroft’s Climate Change Vulnerability Index consistently ranks Nigeria within the top ten most climate-vulnerable countries, and Lagos is the tenth most climate-vulnerable city in the world (Verisk Maplecroft, 2013). The only comprehensive study on the economic costs of climate change in Nigeria points to losses in GDP in the range 2–11% by 2020 if no adaptation measures are taken (ERM, 2009), a figure that is considered conservative (Yetano Roch et al., 2019: 3).
3.1. Glaring yet poorly measured income and wealth inequalities
Like the other countries we have defined as “insecure ecostates”, Nigeria faces high level of outcome inequalities. Almost one third of Nigeria’s national income belongs to the top 10 percent, while less than three percent goes to the bottom 10 percent (IMF, 2018:19). In 2012, the highest quintile held 54 percent of the total wealth, while the lowest accounted for only 4.4 percent (World Bank, 2016a). The top20%/bottom 20% income ratio has evolved between 7,5 and 15 over the last four decades – and these figures are to be considered as low range estimates, because they are based on household survey data which poorly capture top centiles income shares. The quasi absence of personal income tax and the poor tax collection capacity of Nigeria leave wide room for the top 1% and top 0.1% national income shares to grow unnoticed. In 2013, a report issued by the Africa Progress Panel underlined that despite Nigeria’s positive economic growth for many years, poverty had increased, and the proceeds of growth had gone almost entirely to the top 10% of the population (Africa Progress Panel, 2013). Development Finance International and Oxfam have set up an index reflecting countries’ commitment to reducing inequalities (CRI Index). They investigate on a yearly basis 18 indicators across three policy areas that have a key impact on levels of inequality: taxation, social spending on sectors such as health,
10 welfare and education, and labour rights. The CRI Index ranks Sweden top out of 152 countries. Nigeria has the unenviable position of being at the bottom of the Index. The CRI 2018 report soberly concludes that Nigeria has high levels of inequality and is failing to do anything about it. “Income inequality is one of Nigeria’s most serious but least talked about challenges” summarises Matthew Page, formerly the US Intelligence community’s leading expert on Nigeria, quoted by the Guardian6.
The North West and North East of Nigeria together account for about 60 percent of poor Nigerians according to World Bank LSMS data. A mapping exercise from Gething and Molini (2015) found that poverty is concentrated in a belt covering the North and along to the eastern part of Nigeria. The South West (around Lagos) is least affected by poverty with rates lower than 12 percent. Most of South Central experiences rates below 13 percent, though moving southeast rates rise to 30 percent. The South South experiences pockets of poverty, but is homogenously less poor (World Bank, 2016a). The same striking North-South divide comes out of other social indicators. Under-five mortality rate (U5MR) in Nigeria is among the highest in Sub-Saharan Africa, and thus among the highest in the world. U5MR is unequal both across states and income groups. The rate of child mortality (between ages 1 and 5) is eight times higher among the poor than the rich. Vaccination coverage rates, an important cause of U5MR, vary dramatically across states and regions and have changed little in Nigeria over the last 25 years, in sharp contrast with other countries in West Africa such as Cameroon, Ghana, or Senegal, which have witnessed more rapid progress (World Bank, 2018). The discrepancy between Northern and Southern states is spectacular also for the percentage of out-of-school children. With approximately 10 million children out of school, Nigeria has the one of the highest number of out-of-school children of primary age in the world. And over 90% of these are to be found in Northern states. Not only is access highly unequal across states, it is also hurts the poorest most (72 percent for the poorest quintile vs. 3 percent for the wealthiest), and among these, the girls. In the North, out-of-school rates among girls are highest, with 1 girl to 3-4 boys in out-of-school (World Bank, 2018).
3.2. A low budget and willingness to pay taxes
Lying in the range [6% - 10%], the tax-to-GDP ratio of Nigeria is one of the lowest in the world. Nigeria federally-collected gross revenue remains highly dependent on oil – oil revenues range between 50% and 80% of the Federation’s revenue depending on years, meaning depending on world oil price levels. High-dependency on petroleum profit tax for public revenue generation makes Nigeria’s budget poorly resilient to oil market downturns, as it happened in 2016 and 2020, when the collapse of oil prices drove the country into recession.
Low general budget level translates into low public spending for health and education mechanically. According to WHO and World Bank data, the Nigerian general government spends less on health than any other government in the world. In 2016, public health spending rounded 0.6% of GDP, and was also very low as a share of government expenditure. Health care is mainly financed by household out-of-pocket health expenditures, which account to about 70% - one of the highest levels in the world. It has to be compared to 58% and 34% in low-to-middle income countries and upper-to-middle income countries, respectively (World Bank, 2018). Public spending on education is slightly better, with an estimated 1.7% of GDP in 2015, but remains far lower than Sub Saharan African countries average of 4.7% (World Bank, 2018).
6
11 Nigeria’s tax system is largely regressive. The proportion of personal-income tax revenue in the General government tax revenue is almost insignificant, while the proceeds from VAT (flat rate 5%) and custom duties make up roughly a third. The two favoured tax instruments – the petroleum profit tax (30% for gas, 50% for profit sharing contracts, 65% for joint-venture partners that have not fully recovered their capital investment, 85% for joint-venture partners that have fully recovered their capital investment) and the company income tax (flat rate 30%) – are notoriously skewed against small and medium enterprises (SMEs). It is now established that multinationals receive questionable tax waivers and tax holidays, and utilise loopholes in tax-laws to shift huge profits generated in the country to low tax jurisdictions (Oxfam, 2017).
Two mains accounts make up the budget of the General government of Nigeria. The Federation account, comprising non-mineral and mineral revenues. And the VAT account. From these two accounts a given amount is allocated to three tiers of Government. Net revenue accruing to the Federation Account includes all oil and gas revenues and some non-oil revenues (customs revenue, corporate taxes, and solid minerals revenue). It is the main revenue stream for all tiers of Government. In addition to the revenues accruing to the Federation Account, VAT is also federally collected and then distributed to the Federal, state and local governments. Oil producing States receive an extra 13% of mineral revenues so that 87% of mineral revenues are poured into the Federation account for allocation to the three tiers.
The horizontal allocation formula determines the ratio of distributable revenue and VAT, which accrues to each any local government and State. 40 percent of federal allocations are divided equally among states, 30 percent proportionally to the state‘s population, 10 percent on the basis of land mass and terrain, 10 percent on social development factors, and 10 percent for internal revenue efforts. The result of these two allocation processes brings to the fore the horizontal inequality in the Nigerian Federation. It depicts a country where the distribution of States available revenue in per capita terms is highly unequal. Per capita available revenue among the top 20% States range between 1.5 to 5 times the median per capita revenue per State (11,000 NGN, meaning roughly US$ 30). At the other end of the distribution, the bottom 20% States collect revenues ranging between 0.4 and 0.8 the median value per capita (figure 1). The ratio of the top 20% and bottom 20% States revenue per capita amounts to 5 (2017 data), which is greater than the ratio top 20%/bottom 20% States GDP per capita, the value of which is 4. Budget allocation magnifies territorial inequality, to the detriment of Northern poor States (Maps 1 and 2).
In term of public revenue per capita, southern States and in particular littoral ones are better off than their Northern non-oil-producing counterparts. Even though the derivation formula remains criticized by some Southern States political leaders for depriving oil-producing States from much needed public resources (Babalola, 2014), it does not change much the picture of the distribution, which is skewed against the North. The upper part of Map 2 next page depicts the distribution of States available revenue across quintiles with derivation, while the bottom map shows the distribution of States available revenue after the 13% derivation was subtracted from their budget. With the exception of Yobe State in the Northeast, which ranks among the 4th quintile, all northern States are in the bottom
12
Figure 1: Distribution of States available revenue per capita (2017)
Source: BudgIT, Office of the Accountant General of the Federation, National Bureau of Statistics
In a description of the conspicuous underdevelopment of the Niger Delta region (the oil-producing hotspot in Nigeria) observed that, in the Niger Delta area “life expectancy is falling in an age of blockbuster oil prices. Energy availability is poor in a region that provides one-fifth of the energy needs of the United States… There is an almost total lack of roads in a region whose wealth is funding gigantic infrastructural development in other parts of Nigeria and expensive peacekeeping activities in other parts of Africa” (UNDP, 2006: 25). It seems reasonable to suggest that the main factor responsible for the gross underdevelopment of the Niger Delta area is to be found less in the proportion of the general budget flowing back to the region, but in the way it has been spent. The littoral states experienced a dramatic surge in federal transfer at the very beginning of the 4th Republic (e.g. as of 1999), “but due
to a culture of impunity among regional leaders, the supposed gains have made no difference to the citizens”, Babalola (2014) emphasises. In specific relation to the misuse of Nigeria’s oil-generated revenue, the diagnosis of Welch (1995: 636) remains valid: 'Nigeria has received billions of dollars from oil – most of which seems to have disappeared into private hands without perceptible benefit to most Nigerians'. Due to a lack of adequate checks on office holders, particularly the governors, public funds that could have been used to provide public goods are siphoned mostly through kickbacks from contractors. This explains why it was reported for instance that, ‘there are schools in the region where pupils still sit on bare floors with leaking roofs’ and ‘nearly all school facilities are in a state of extreme disrepair’ (Ajodo-Adebanjoko and Ojua, 2013: 181).
13 Map 1: Distribution of States GDP per capita (2010) (quintiles)
Map 2: Distribution of States revenue with (top) and without (bottom) derivation, 2017 (quintiles)
14
3.3. Systemic corruption
According to the Afro Barometer (2018), more than 90 percent of Nigerians still report that they perceive public officials as corrupt. Thanks to the first ever large-scale household survey on corruption released by Nigeria National Bureau of Statistics (NBS, 2016), it is now established that corruption is “as bad as most people imagined”7. Nearly a third of Nigerian adults who had contact with local public
officials in the period reviewed in the survey (June 2015 to May 2016) reported cases where bribes were solicited or paid to a public official, the report found. On average, Nigerians pay six bribes per year, or one every two months. NBS estimates the total amount of bribes paid to public officials amount to $4.6 billion in purchasing power parity terms—the equivalent of 39% of the country’s federal and state budgets for education in 2016.
Audit reports in Nigeria at all levels reveal flagrant disregard to rules and procedures, overthrow of financial discipline, accountability, probity and transparency, which the treasuries were set-up to establish and protect (Adamu and Rasheed, 2016). These abuses and breaches range from duplication of contracts, over-valuation of contracts, fictitious payments of contracts, non-certification of payment vouchers by the internal auditor among others. Other fraud in treasury activities may include over payment to existing staff, payment of salaries and allowances to dead or retired staff and ghost workers (id.). Public resource management is subject to elite capture, corruption and rentseeking, and as such contributes to reproducing inequality. According to the Economic and Financial Crimes Commission (EFCC) quoted by Oxfam (2017), between 1960 and 2005, about $20 trillion was stolen from the treasury by public office holders – which amounts roughly to US GDP in 2012.
In 2014, the former minister of finance, Ngozi Okonjo Iweala, reported in a letter to the Executive Secretary of the Nigerian Investment Promotion Commission (NIPC) that the federal government had lost a lot of revenue due to fraudulently tax holidays granted to companies by officials of the NIPC to companies that did not qualify. She estimated that Nigerian government had lost about 800bn naira (€2bn) to tax wavers and concessions to businesses and corporations between 2011 and 2013. She concluded these wavers led to no measurable benefit for the Nigerian economy8. Two years later, an
Inter-Ministerial Committee was constituted and tasked with undertaking a review of tax expenditures resulting from 52 types of incentives being implemented by the Federal Government through its agencies. The Committee’s preliminary findings indicate that between 2011 and 2015, the government conceded 1.28 percent of GDP to the granting of only four types of incentives: import duty waivers/concessions/grants, VAT waivers/concessions/grants, and pioneer status—separately for nonoil companies and oil companies – which carries tax holidays of 3 to 5 years. The largest share of incentives came from the granting of import duty waivers (World Bank, 2018). The worry is that Nigerian customs are renowned for remaining riddled with corruption and inefficiency (Soyombo, 2016). Nigeria’s ports display a lack of transparency, with recurring accusations of corruption among the Nigerian Ports Authority (NPA). In the most recent World Bank Enterprise Survey (2014), 40.7% of Nigerian firms expected to bribe officials to acquire an import license, compared to a sub-Saharan average of 16.8%. Due to widespread fraudulent practices, in 2017, Nigeria was overall ranked 169 out of 189 countries for ease of doing business and 181 in terms of ease of trading across borders (World Bank’s Doing Business 2017 Report).
7 Yomi Kazeem, “Why Nigeria Is Finally Pulling the Plug on Its Controversial Fuel Subsidy in 2016,” Quartz, December 18, 2015; Kevin
Sieff, “The Nigerian Military Is so Broken, Its Soldiers Are Refusing to Fight,” Washington Post, May 10, 2015.
8
https://www.premiumtimesng.com/business/153493-nigeria-lost-n797-8bilion-waivers-tax-exemptions-3-years-says-okonjo-iweala.html. See also: https://guardian.ng/business-services/seplat-responds-to-okonjo-iweala-waiver-accusations/
15
4.
Moving out of the insecurity trap
The portrait of inequalities in Nigeria we have brushed may seem quite bleak, the truth is that it does not do justice to a wealth of initiatives from civil society groups and researchers, both from Nigeria and foreign countries, that intend to shift Nigeria onto a more sustainable path. Below we hint at some promising avenues, which are currently explored by researchers, think tanks and civil society organizations’ members with the view of influencing policy makers for delivering the expected social and environmental changes, pursuant to the SDGs.
4.1. Swapping fossil fuel subsidies for social spending
Nigeria’s petroleum product subsidies were introduced in 1977 by the military government as a short-term cushion for rising international oil prices. The price of petroleum products has been adjusted more twenty times since the military administration of General Obasanjo raised for the first time the pump price of petrol by 74% in 1978.
Most upward adjustments in the ceiling pump price have unleashed civil unrest. The most recent example occurred on January 1, 2012, when the federal government of President Jonathan more than doubled the fuel price from NGN65 to NGN145 (USD 0.41 to USD 0.91) per litre in a bid to completely remove the subsidy on refined petroleum products. This led to widespread protests and a 10-day national strike. The government partially reversed the increase, by reducing the price to NGN97 (USD 0.61) per litre. Two years later, the fall in oil prices led to a dramatic fall in foreign reserves and government revenue, causing widespread fiscal crisis across Nigerian States. As at June 2015, 23 out of 36 states were unable to meet up with recurrent expenditure, particularly the payment of salaries of public sector workers. The crisis was further exacerbated by the re-emergence of oil-pipeline vandalism in the Niger-Delta region in the South of the country, leading to a rapid fall in crude oil production (Onyekwena, Adedeji, Akanonu, Momoh, 2017). In May 2016, the price of gasoline was adjusted upward to NGN145 (USD 0.72) per litre and has remained at this level until March 2020 when it was adjusted downward to NGN 125 in the midst of coronavirus crisis.
The new system is officially no longer a subsidy. The ceiling pump price is supposed to align with world oil price changes. However, and in spite of market price soaring in 2017 and 2018, the pump price has remained stuck to NGN145 (USD 0.72), leading to under-recovery claims by and payments to NNPC, which boil down to fossil fuel subsidy.
Evidence shows that fossil fuel subsidy in Nigeria has created economic inefficiency, exacerbated negative environmental and health externalities, and worsened macroeconomic stability, without achieving its desired social benefits (Siddig et al., 2014; Soile and Mu, 2015; Umar and Umar, 2013). It has not improved access to energy either, as subsidies divert investment from public power infrastructure.
Our estimates of subsidy levels between 2006 and 2015 range between 5% and 13% of General government expenditures for “normal” years, meaning for years without large scale blatant subsidy
16 overwriting (2011) or record low oil price level in world markets (2015 and 2016). For these “normal” years, the amount of FFS exceeded the level of public expenditure for health.
To cushion the distribution effects of FFS removal, the Jonathan government launched the Subsidy Reinvestment and Empowerment Program (SURE-P), the objective of which was to provide support to various strata of the population through a range of programs, including the financing of infrastructure and the creation of job opportunities for unemployed youths. Sure-P stands out as one of the attempts from Fourth republic governments to “give back” to Nigerians the oil rent they own. It delineates the contour of Nigeria’s insecure Ecostate’s welfare system. Table 2 encapsulates the welfare programmes or measures, which have been set up either as a way to ease FFS removal, or as a means to enhance the social benefits of public oil revenues and strengthen in turn the fragile legitimacy of 4th Republic
Governments. Their implementation is however incomplete and unpredictable, due to lack of funding, poor targeting, undefined eligibility criteria, lack of monitoring and evaluation (M&E) systems, and absence of a management information system (World Bank, 2016a). Cash transfers are primarily implemented at the state level, with low overall reach and limited results from evaluations. As the World Bank (2016a) points out, an impact evaluation for ‘In Care of the People’ (COPE) found that while many of the design elements were sound, its effectiveness was constrained by low coverage, low benefit levels, and weak incentives for state involvement – with an overall reach to 22,000 households, meaning 0.001% of poor households nation-wide. These bricks of a welfare state remain fragile and incomplete.
The Buhari government set up after the 2015 presidential election drafted a National Social Protection Policy (NSPP) - the first ever in the 4th republic history. - and sustained its commitment throughout its
mandate through budget inclusion for social protection of NGN 500 billion (US$2.5 billion) per year. This includes financing for six new priority government programs, including conditional cash transfers, youth employment, school feeding, microcredit, and education vouchers. About NGN 70 billion (US$345 million) has been allocated to targeted cash transfers (TCTs) per year. In 2016, The World Bank provided US$ 500 million credit to support the NSPP by expanding access for poor households to social safety nets, and ultimately “allow the Government to target and deliver a range of programs to poor households more effectively and efficiently” (World Bank, 2016b: 5) – meaning in a more comprehensive and less “insecure” way. The definitive abolition of FFS in Nigeria would add up USD 2 billion (2018 fuel subsidy level) to the general budget for poverty alleviation and social safety net programs spending.
The example of Indonesia – another “insecure ecostate” in our typology – shows that swapping fossil fuel subsidies for social spending is actually manageable in periods of low world oil prices. Using the window of opportunity offered by declining world oil prices, the Indonesian government managed to cut the amount of fuel subsidies from USD 13.6 billion in 2014 to USD 1.6 trillion in 2015 state budget. Support from (part of) the public and compensation programs proved critical to the success of the reform. Even though the Indonesian Land Transport Operators Association called for one-day nation-wide strike after the 2014 fuel price hike, other major groups provided support to the reform. Unconditional and conditional cash transfer programs, on the top of pre-existing social assistance programs largely praised by the population, contributed to build trust and eased the process of subsidy removal. Within a decade, the government introduced poverty alleviation programs and social safety nets to help population cope with energy price increase. Beyond their original mandate, they “represent the building blocks of a comprehensive social welfare system” (G20, 2019: 40).
17
Table 4: The building blocks of an oil-based welfare regime
Policy program Objective Target group Mode of operation
SURE-P Urban mass transit
Maternal and child health services Graduate Internship Scheme Public work
Vocational training
-
Pregnant women in rural areas Graduates (tertiary)
Youth and women Youth
Intervention fund (off-the-budget)
UK Department For International Development (DFID) involved in the early stages
Free-Basic Education Improve access to primary and basic education.
The program entitles children to free and compulsory education for the first nine years of education (e.g. children < 15 years)
Funding of infrastructure development, provision of teaching materials and equipment, training of teachers. States are to provide counterpart funds. The release of the federal government financial commitments is contingent on the states providing their matching funds. Many states are in arrears. Mass-Transit Program Implemented by the Federal Capital
Territory Administration (FCT) to facilitate commuters’ transportation, mainly within Abuja and its suburbs
Public sector employees and informal sector operators who
With the support of SURE-P, the FCT introduced branded taxis allocated to private sector transport operators. The idea is for the beneficiaries to trade their old vehicles for new ones provided by the government at an additional but subsidized cost. Fertilizer E-Wallet Designed to replace the inefficient and
corruption-ridden system associated with the government purchase and distribution of farm inputs to smallholders. The E-wallet allows farmers to receive subsidized electronic vouchers for fertilizer and seeds directly on their mobile phones. The farmers then use their electronic vouchers to pay for these inputs from private sector agricultural input dealers.
The Nigeria Agriculture Payment Initiative (NAPI) was set up to improve the targeting by collecting biometric data on all farmers in the country. The agricultural input subsidy money is transferred into an E-wallet card that farmers can access through ATM machines. About 14.5 million farmers are registered as participants in the E-wallet program
Conditional cash transfer forwarded to the farmers’ phones through the E-wallet. Under the E-wallet program, a farmer is eligible for one free bag of fertilizer. The system has subsequently been modified from 100 per cent subsidy support to 50 per cent of the cost of a bag of fertilizer.
18 Care of People (COPE)
Conditional cash-transfer
Provide cash transfers to the poor to enable them to meet their health and education needs.
The cash transfer is expected to empower poor families in rural areas to access education and health facilities that would have been out of their reach.
COPE targets roughly 22 per cent of Nigeria’s population estimated by the National Bureau of Statistics to be in extreme poverty on the basis of criteria including physically challenged heads of household and female-or teenage-headed households. Unlike what happens in pioneer CCTs such as Bolsa Família in Brazil and Oportunidades in Mexico, where households benefit from the programmes for longer periods, households only participate in COPE for a year, without any possibility of extension. The number of participating households is restricted to 10 per community, even though several other households also meet the eligibility criteria.
The main conditions for COPE relate to school attendance of at least 80 per cent for each child in the household, and participation of household members in government-sponsored immunisation programmes. Households that fulfil these
conditions receive what is referred to as the ‘Basic Income Guarantee’ (BIG) of NGN1500
(approximately USD10 when the programme was launched) per child, or a maximum of NGN5000 for four or more children, every month.
Selected households participate in COPE for a year, after which they are expected to leave the
programme. A Poverty Reduction Accelerator Investment (PRAI) payment of NGN84,000 is paid to each household or used to purchase equipment to help them set up a business or trade after they leave the programme payment for the school fees of their children.
Family Economic Advancement Program (FEAP)
Enhancing the well-being of the family by alleviating distress due to lack of income or sustainable means of livelihood.
The FEAP involves extending grants to families judged by community leaders to be in distress in the assessment of the and after verification by the FEAP office at the Federal Ministry of Women Affairs.
The grant is not a fixed amount, as it depends on family size, the nature of the project the beneficiaries are engaged in and the magnitude of fund allocation to FEAP by the federal government. The FEAP has been in operation since 2006 but is being restricted to only a few communities due to a lack of funds.
19
4.2. Building on humanitarian cash-transfer experiences to develop adaptative
social protection systems
In the face of looming climate crisis and delayed collective action, UNFCCC parties have strengthened the adaptation agenda in the early 2010s, contemplating scenarios of temperature increases exceeding 2° over the century as plausible. The Paris Agreement on Climate Change has not wiped out their concerns, so that adaptation has become a core component of developing countries’ climate strategies, as reflected by their nationally determined contribution (NDCs).
An inherent difficulty in adaptation funding lies in the need to get grips with the issue of uncertainty. As recalled by Wood (2011: 4) “Not only is there uncertainty due to the complexity of the climate system and challenges in modelling it, impacts will depend heavily on their interactions with highly complex ecological and socio-economic systems”. In the case of smallholder farmers, she warned, the impacts of climate change is extremely difficult to predict. The supply of market-based insurance services is all but unlikely due to this uncertainty. On the demand side, those most vulnerable to climate change are invariably threatened by a whole range of threats, and more immediate ones such as hunger, disease, conflict or fluctuating prices, which overshadow considerations about the longer-term issues of adaptation, and eventually depress their willingness to pay for adaption services. In developing countries, uncertainty on long-term climate impacts is indeed but one of the many uncertainties poor people face in a context where market incompleteness is more the rule than the exception. “Climate change presents social policy with a dual challenge” Wood (2011) summarised: “building and extending safety nets in areas which currently lack them and where climate change is likely to increase stresses, whilst simultaneously promoting transformative interventions which reduce the marginalization of the most vulnerable and increase their long term adaptive capacity” (Wood, 2011: 6).
Cash transfers rank among the privileged means contemplated by government and donors to address the multiple causes of vulnerability. Even though the exact contribution of cash transfers to poverty reduction or livelihood transformation is dependent upon the local context and institutional setting and remains an empirical question, the sign of this contribution seems positive across the projects examined to date (Asfaw et al., 2016 ; Bastagli et al, 2016 ; Daidone et al. 2015). Cash transfers are a privileged option for what is now labelled “adaptative social protection” (ASP) to cope with crisis and build resilience against a wide range of uncertainties in close connection with humanitarians. ASP goes one step further than classical social protection programs by helping ensure that critical investments in human capital made under the latter are not undermined by a crisis or shock (World Bank, 2017 ; Rutkowski, 2018). ASP can help in building resilience to climate change by increasing human capital, facilitating changes in economic activities by decreasing liquidity constraints, improving natural resource management, and building local economics (Asfaw et al., 2016). At the end of the day, the question no longer is “Are cash transfers good for the poor?” but “Is there a role for cash transfers to build resilience to climate change?” and answers seem to lean towards “yes”.
Most of the social protection programmes that have been explicitly designed to address the impacts of climate change are located in South Asia and East Africa (Asfaw et al., 2017). As regards Sub-Saharan Africa, exception lies in Zambia and in Ethiopia, where climate risk adaptation and social protection were combined through the Productive Safety Net Programme (PSNP). PNSP helped improve the food caloric intake of beneficiaries by almost 30 percent as compared to non-beneficiary households (Id.). In Zambia, Lawlor et al. (2015) examined if cash transfers allow
20
households facing climate and other negative shocks to avoid negative coping strategies that lead to a poverty trap. Using a randomised roll-out of the Zambian Child Grant Programme, and 2,515 households to estimate the impact, they found that in the event of shocks, cash increased the resilience of poor households. Giving credence to these findings, Asfaw et al. (2016) also show significant evidence that cash transfers in Zambia have mitigated the negative impacts of climate events (Awojobi, 2017). This evidence reveals that cash transfers are an impactful policy option for promoting climate-resilient development. In Nigeria, humanitarian and development organizations intervening in the poorest and most vulnerable states of the Federation over the last two decades have developed incomparable knowledge on cash transfer programs either through vouchers, direct cash or mobile money (ICRC, 2017; Sossouvi, 2018; Unicef, 2017). The consequences of global warming in humanitarian-crisis prone states could affect the efficacy and magnitude of these programs. The other way round, development programs and policies targeting the SDGs could learn much from the humanitarian community when designing resilient social transfer programs in the critical context of uncontrolled global warming.
4.3. Substituting renewables-based mini-grids and solar home systems to
fossil-fuel based generators
In 2017, 77 million Nigerians or 40% of the population had no access to affordable and reliable electricity. Diesel- and petrol-fuelled back-up generators supply the vast majority of electricity in the country. There is considerable uncertainty around the magnitude of fossil fuel-based self-generation systems however. Based on the number of generators imported annually, it is estimated that there was around 16 GW of diesel and petrol-based generation installed capacity in Lagos alone in 2015 (Yetano Roche, 2019). The net capacity of all small gasoline generators (0-4 kVA) is estimated by A2EI and Dalberg (2019) at roughly 42 GW, meaning 8 times the current peak realized on-grid capacity. Substituting renewables-based mini-grids and solar home systems to these fossil-fuel based generators represents a promising way forward to meet the key long-term ambitions of Nigeria as far as electricity access and decarbonization of the energy sector are concerned. Nigeria has three key long-term ambitions for the electricity sector (Yetano Roche et al., 2019):
- A capacity expansion target: 30 GW of installed on-grid capacity by 2030 (current peak realized capacity is 5.4 GW), of which 13.8 GW from grid-connected renewables (corresponding to 45% of total capacity and 30% of generation, respectively).
- The goal of universal electrification by 2040, and of 90% electrification by 2030.
- And the emission reduction targets in its nationally-determined contribution (NDC) under the Paris Agreement. Under the Paris Agreement, Nigeria pledged a 20% unconditional reduction of its Business-as-Usual (BAU) greenhouse gas emissions (GHGs) by 2030, and a 45% reduction, conditional on financial, technical and capacity building support for implementation (FGN, 2015, 2016; FMPWH, 2016). 60% of these reductions are foreseen in the power sector.
Replacing gasoline generators presents a big opportunity as they are expected to produce 22% of targeted reductions from the energy sector in 2030 (A2EI and Dalberg, 2019). Nigeria has a large potential off-grid market indeed, be it through renewables-based mini-grids or through solar home systems (SHS) (All On, 2016; NESG & RMI, 2018). Standalone solar PV systems are already
cost-21 competitive on a lifetime basis over diesel and gasoline generators (NESG & HBS, 2017). However, they have significant upfront costs: it currently takes 8-9 years before the total costs of a solar system fall below those of generators (A2EI and Dalberg, 2019). Some of the key barriers for investments in the off-grid electricity market are the lack of consumer affordability and financial viability of projects, the weak enabling environment, and more importantly, the lack of data to make investment decisions (Yetano Roche, 2019).
Recent policies designed to tackle challenges in the off-grid-sector include regulations for mini-grids (NERC, 2018), and a proposed bill for the removal of import tariffs on solar components. A number of funds and financing partnerships have been launched to address key financing gaps in the deployment of mini-grids and SHS. Overcoming the massive failure of the power grid with the provision of off-grid or mini-grid solar systems has been gaining momentum over the last decade however, in particular among Northern states where energy infrastructures and public budgets are in disarray (Yetano Roche, 2019).
Leveraging private finance in solar mini-grids with concessional loans is among the objectives of donors such as the EU and the World Bank. In 2014, the EU launched the ‘Nigerian Energy Support Programme (NESP)’. With a contribution of €15.5 million, this programme attracted private investment to set up independent power systems to provide electricity to small communities without the support of an electrical grid. A market worth €8 billion annually, according to the Nigerian Rural Electrification Agency (REA) 9. We can also mention ElectriFI, the EU-funded impact investment blending facility, set
up to de-risk investments and allow private investors and development finance institutions to deploy capital that they could not have invested otherwise10. A EUR 30 million country window is dedicated
to the Nigerian renewable energy market. Let’s mention also the $350 million World Bank Nigerian Electrification Project (NEP), set up to leverage private sector investments in solar mini grids and standalone solar systems to provide electricity to 2.5 million people and 70,000 MSMEs (Coony, 2018). Although limited in their reach when compared to the massive needs, solar mini-grids are promising means to address inequality of access to energy in a sustainable way.
Conclusion
This paper departs from the closely intertwined and pressing challenges of rising economic inequalities and environmental degradation in developing countreis. The concept of eco-social state or « ecostate » we use in this paper was coined almost twenty years ago to define government programmes dedicated to controlling environmental impacts and adjusting patterns of socio/ecological interaction to avoid ecological risks and enhance ecological values.
The absence of any literature on ecostate in developing countries led us to infer the emergence of ecostate from available data. Our multivariate analysis suggests four possible types of ecostates – unequal, super-unequal, balanced and insecure ecostates. It further suggests that a high level of environmental performance is compatible with a high level of inequality, something which breaches
9 In 2014, the EU launched the ‘Nigerian Energy Support Programme (NESP)’. With a contribution of €15.5
million, this programme attracted private investment to set up independent power systems to provide electricity to small communities without the support of an electrical grid. A market worth €8 billion annually, according to the Nigerian Rural Electrification Agency (REA). See
https://ec.europa.eu/commission/news/bringing-reliable-electricity-rural-communities-nigeria-2019-jul-03_en
22 the hypothesis that inequality reduction comes along environmental protection. Our multivariate analysis also tends to confirm the critical position of emerging economies, most of which are to be found in the “insecure” ecostate group.
How do such countries reconcile inequality reduction and environmental protection? Does fossil fuel subsidy removal, which on the paper increases the available funding for welfare-type policies while limiting the consumption of fossil energy, deliver the expected social outcomes? We have hinted at some of these issues in the case of Nigeria. Embracing an ecostate perspective, we have characterized “insecurity” in its particular case, then pinpointed ongoing policy initiatives which could reconcile inequality reduction and environmental protection, and allow Nigeria to escape the insecurity trap. The income inequality-environment policy nexus is a new field of research, to which this paper offers a modest and imperfect contribution. The lack of consistent data on key outcome of ecostate programs is deterrent to many researchers. In particular, data on the concentration of income in the top centiles, on the distribution of energy consumption and CO2 emissions across households, on the access to off-grid renewable energy, let alone the effectiveness of official government spending in both social and environment protection areas are crucially missing.
This state of play should not be considered as a given and discourages further research however. Nigerian civil society has been mobilised for years to raise accountability across public enterprises and government, to unveil data hidden in the budget, and improve transparency. This mobilisation found support in some cases in foreign-country based institutions, which funded campaigns, data production and sharing. Oil revenue tracking for instance coalesces the Extractive Industry Transparency Initiative (EITI), the Natural Resource Governance Institute (NRGI), the Oil Revenue Tracking Initiative (ORTI) and BudgIT in a loose but coordinated manner to disseminate simplified information on the state of oil revenue management. The World Bank is moving towards expanding its portfolio to climate emergency relief and climate resilience operations, something also contemplated by Humanitarians. PSE-WIL and World Bank engage in ad hoc cooperation to deliver WIL Distributional National Accounts in the context of scarce data regions. Constructing disaggregated income and wealth data makes the cooperation with the main actors of the “governance by disclosure” stream absolutely key. These actors come up with invaluable information on the budget design, let alone their outreach in the national political ecosystem. The other way round, the transparency initiatives they are in would much benefit from distributional income and wealth data to make their case even stronger, spark reforms and eventually build trust in governmental action to move out of the insecure ecostate trap.
References
A2EI and Dalberg (2019). Putting an End to Nigeria’s Generator Crisis: The Path Forward. Access to Energy Institute (A2EI) and Dalberg.
Adamu, A., and Rasheed, Z.H. (2016). “High Cost of Governance and the Challenges of National Development in Nigeria’s Fourth Republic”. Journal of Good Governance and Sustainable Development in Africa (JGGSDA) 3(1):46-57.
Africa Progress Panel (2013). Equity in Extractives: Stewarding Africa’s natural resources for all. Afro Barometer (2018). “Corruption, Violent Extremism, and Clashes between Herdsmen and Farmers. Findings from Afrobarometer Round 7 Survey in Nigeria.” Clean Foundation; Practical Sampling International.