HAL Id: hal-01368392
https://hal.univ-reunion.fr/hal-01368392
Submitted on 28 Oct 2016
HAL is a multi-disciplinary open access
archive for the deposit and dissemination of
sci-entific research documents, whether they are
pub-lished or not. The documents may come from
teaching and research institutions in France or
abroad, or from public or private research centers.
L’archive ouverte pluridisciplinaire HAL, est
destinée au dépôt et à la diffusion de documents
scientifiques de niveau recherche, publiés ou non,
émanant des établissements d’enseignement et de
recherche français ou étrangers, des laboratoires
publics ou privés.
A model-based assessment of reef larvae dispersal in the
Western Indian Ocean reveals regional connectivity
patterns - Potential implications for conservation policies
Estelle Crochelet, Jason Roberts, Erwann Lagabrielle, David Obura, Michel
Petit, Pascale Chabanet
To cite this version:
Estelle Crochelet, Jason Roberts, Erwann Lagabrielle, David Obura, Michel Petit, et al.. A
model-based assessment of reef larvae dispersal in the Western Indian Ocean reveals regional connectivity
patterns - Potential implications for conservation policies. Regional Studies in Marine Science,
Else-vier, 2016, 7, pp.159-167. �10.1016/j.rsma.2016.06.007�. �hal-01368392�
A model-based assessment of reef larvae dispersal in the Western
Indian Ocean reveals regional connectivity patterns — Potential
implications for conservation policies
Estelle Crochelet
a,b,∗, Jason Roberts
c, Erwann Lagabrielle
d,e, David Obura
f, Michel Petit
g,
Pascale Chabanet
aaIRD/ UMR 9220 ENTROPIE, Parc Technologique Universitaire, 2 rue Joseph Wetzell, CS 41 095, 97495 Sainte Clotilde Cedex, Reunion bIRD/ UMR 228 ESPACE-DEV, Parc Technologique Universitaire, 2 rue Joseph Wetzell, CS 41 095, 97495 Sainte Clotilde Cedex, Reunion cDuke University, Marine Geospatial Ecology Laboratory, Nicholas School of the Environment, Durham, NC 27708, USA
dUniversité de La Réunion/ESPACE-DEV (UMR 228), 15 avenue René Cassin, BP 7151, 97715 Saint Denis MESSAG Cedex 9, Reunion eNelson Mandela Metropolitan University, Botany Department, George, South Africa
fCORDIO East Africa, #9 Kibaki Flats, Kenyatta Beach, Bamburi Beach, P.O.BOX 10135 Mombasa, 80101, Kenya gIRD/France-Sud direction, 911 Avenue Agropolis, 34394 Montpellier Cedex, France
a b s t r a c t
Marine resources are under increasing pressure from a wide variety of threats such as overfishing, offshore energy development, and climate change. As marine ecosystems degrade, so do the well-being and livelihoods of humans that depend directly on the ecosystem goods and services they provide. Marine protected areas have been proposed to protect biodiversity, restore damaged ecosystems, sustain fisheries, and rebuild overexploited stocks. The effectiveness of marine protected areas depends in part on their effectiveness as connected networks, linked over large areas by ecological processes such as larval dispersal. Here, we applied a biophysical model driven by ocean currents derived from satellite altimetry to evaluate connectivity between Western Indian Ocean reefs. We applied graph-theoretic analysis, including clustering and a betweenness centrality metric. Our results show high interconnectivity within several regions (Mozambique Channel, Mascarene archipelago) and lower connectivity across the WIO region. We compared the results with the current MPA network, and proposed sites/reefs that should be considered priority sites for MPA implementation: Pebane, Cosmoledo, Majunga, Masoarivo, Platte Island, Farquhar, Agalega and Geyser bank. Our results are timely, considering the oil and gas exploration that is ongoing in the region. We discuss implications for transboundary marine policies and regional cooperation in the Western Indian Ocean, and advocate the creation of a regional-scale organization to structure interactions among the different actors.
1. Introduction
The world’s coastal resources are being fundamentally altered by the combined effects of climate change, overfishing, pollution, and disease (Hughes et al., 2003; Hoegh-Guldberg et al.,2007;
Srinivasan et al.,2012). Nineteen percent of the global extent of coral reefs has already been lost, with a further 35% under threat of
loss within the next 20–40 years (Wilkinson, 2008). This will have significant impacts on the well-being and livelihoods of over 500 million people worldwide who depend directly on the ecosystem goods and services they provide (Moberg and Folke, 1999). Managing these ecosystems and associated resources effectively is crucial, from both social and ecological perspectives. This paper focuses on the assessment of coral reef connectivity patterns at broad scale (100–1000 km) and on using this information to improve marine protected areas (MPA) management and design in the broader framework of marine spatial planning (MSP).
The importance of an integrated ecosystem approach to the management of the ocean has been recognized (Lester et al.,
2009;Foley et al.,2010), and environmental tools such as MPAs ∗Correspondence to: Institut de Recherche pour le Développement (IRD), Parc
Technologique Universitaire, 2 rue Joseph Wetzell, CS 41 095, 97495 Sainte Clotilde Cedex, Reunion. Fax: +262 02 62 48 33 53.
are a cornerstone of conservation strategy. MPAs have been implemented to conserve or restore species, fisheries, habitats, ecosystems, and ecological functions (NRC,2001;Russ et al.,2004;
Mouillot et al., 2008; Guidetti et al., 2008; Lester et al.,2009;
Pujolar et al.,2013;Bennett and Dearden, 2014;Costello,2014;
Rossiter and Levine, 2014). They have a potential positive impact on poverty alleviation (Gjertsen, 2005) and could contribute to climate change mitigation and adaptation (McLeod et al., 2008). The Convention on Biological Diversity (CBD), through the Aichi Target 11, has committed countries to establish an ‘‘effectively and equitably managed, ecologically representative and well-connected systems of protected areas’’ covering 10% of the global ocean area in 2020 (COP10:www.cbd.int/cop10;Toropova et al., 2010). Although MPAs are expanding rapidly (Gray, unpublished), they currently cover only about 2.3% of the world’s oceans (Spalding et al., 2013).
The effectiveness of MPAs depends in part on the maintenance of demographic and genetic connections through processes such as the dispersal of larvae, to support population replenishment, persistence, and gene flow within protected areas, between protected areas, and with adjacent habitats (García-Charton et al.,
2008;Botsford et al.,2009). Many recent studies investigate how networks of MPAs can be designed to better protect and secure natural patterns of connectivity (Lubchenco et al.,2003;Cowen et al.,2007;Jones et al.,2007;Almany et al.,2009;Jones et al.,2009;
McCook et al.,2009). Conservation organizations also recognized the importance of incorporating spatially-explicit connectivity knowledge into MPA design (Salm and Coles, 2001;Laffoley,2008;
Conservation International, 2009; Roberts et al., 2010a; Green et al.,2014). Determining whether protected areas are ecologically connected as a network, as well as where new MPAs should be established to promote network functions, requires information on the connectivity of biological populations across large areas (Fenberg et al., 2012).
Larval dispersal is an important process connecting marine populations but assessing the larval connectivity between distant populations is very challenging, and must consider both the physical processes of hydrodynamic transport (horizontally and vertically) and the biological traits of larvae. Many marine species have a bipartite life cycle and experience pelagic larval stage of certain duration, the pelagic larval duration (PLD), which may last from days to months. During development, larvae may acquire swimming and sensory capabilities that enable them to control aspects of their dispersal (Leis,2002;Kingsford et al.,2002). Larval dispersal is notoriously difficult to study empirically due to the small size of larvae and long dispersal distances of up to hundreds of kilometers (Leis, 1984; Victor, 1987), and the dynamics of dispersal may vary greatly among species. By and large, these patterns remain a critical gap in the scientific knowledge required for the effective management of marine systems (Sale et al.,2005;
Cowen and Sponaugle, 2009;Foley et al.,2010;Wilson et al.,2010). A variety of approaches (genetics, microchemical fingerprint-ing, stable isotopes, otolith chemistry and otolith shape analysis) have been developed to assess patterns of larval dispersal and fish population connectivity in the marine environment. How-ever many techniques have limited spatial and temporal cover-age. Spatially-explicit numerical transport models have then been developed to infer pattern of larval dispersal (Schultz and Cowen, 1994;Roberts,1997;Cowen et al.,2000;Treml et al.,2008;Mora et al.,2012) and are increasingly being used worldwide for the design of MPAs (Planes et al., 2009) and fisheries management (Gaines et al., 2010).
This paper outlines a model-based assessment of connectiv-ity patterns between reef ecosystems of the Southwestern Indian Ocean (WIO). To infer these patterns, we use a hydrodynamic con-nectivity model (Treml et al., 2008) parameterized with altimetric
data (2006–2010) and a gradient in pelagic larval duration imple-mented in the Marine Geospatial Ecology Tools software (Roberts et al., 2010b). In a second step, a set of connectivity matrix are de-rived and summarized over time. The properties of the resulting connectivity network are measured using cluster analysis and a centrality index. Focusing on the implications of the connectivity analysis for marine spatial planning, we compared the connectivity matrix with the current location of MPAs and identified key sites required to fill in notable gaps in the MPA constellation. Finally, we discuss implications for transboundary marine policies and re-gional cooperation in the Southwestern Indian Ocean.
2. Methods 2.1. Study area
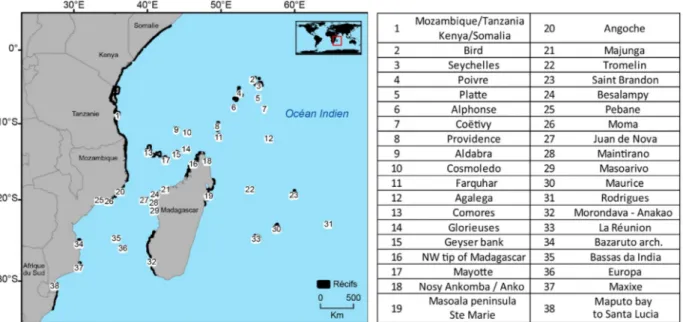
The study area (Western Indian Ocean) lies between 2°N and 35°S and 25–70°E (Fig. 1). The climate of this region is tropical. Coastal and island coral reefs cover 45 425 km2. The study area (Southwestern Indian Ocean) lies between 2°N and 35°S and 25–70°E (Fig. 1) and includes coastal and island reefs. Note that the method used (see below) treats the mainland fringing reef from northern Mozambique to Somalia as a single ‘reef’ so connectivity along this coastline and of different locations on this coastline to the other selected sites is not analyzed.
The South Equatorial Current flows east-to-west between 4°N and 20°S (Fig. 2), splitting north and south when it reaches Madagascar (Tomczak and Godfrey, 2003;Chapman et al.,2003). The southern flow, the East Madagascar Current, flows south along Madagascar’s east coast and meets the Agulhas Current. The northern flow diverges again adjacent to the Comoros, with part of it flowing into the Mozambique Channel in a series of dynamic cyclonic and anticyclonic eddies that have a net southwards flow, and a part of it flowing north as the East African Coastal Current, and meeting the Somali Current at about 2°S.
During the northeast monsoon season (November–May), cy-clones occur episodically, with variable trajectories but generally following a southwesterly direction (Ginis, 2002). They cause sig-nificant perturbations in marine ecosystems at varying spatial and temporal scales, occasionally affecting coral reef structure and communities (Harmelin-Vivien,1994;Gardner et al.,2005).
The region covers about 40 degrees of latitude and hosts a high level of marine biodiversity (Tessema and Salm, 1998;Obura et al.,
2004;WWF,2004a,b). It is home to at least 350 species of coral (Obura, 2012), 11 species of mangrove, and 12 species of seagrass, together with 1500 species of fish, 3000 species of molluscs, 450 species of crabs, 300 species of echinoderm and five of the world’s seven marine turtle species (WWF,2004a,b;Guerreiro et al.,2010). However, despite the substantial value of its environmental assets, the WIO faces significant resource management and environmen-tal challenges (Moffat et al., 1998). Four overarching threats to ma-rine biodiversity have been identified: overexploitation of natu-ral resources, habitat degradation, land-based sources of pollution, and marine pollution (WWF,2004a,c,d;Borja et al.,2008;Billé and Rochette, 2010).
The first MPAs in the WIO were implemented in 1965 in Mozambique (IUCN, 2000). Madagascar and Kenya followed within three years (UNEP-WCMC, 2010). Early MPAs tended to be small (
<
10 km2) and designed to protect a specific habitat. By the 1990s, the emphasis had shifted to larger, multiple-use sites, based on more participatory forms of management (Rocliffe et al., 2014). Today, all WIO countries host MPAs except Somalia where conservation is difficult to set up (IUCN,2000;Barrow et al.,2007). Seventy five MPAs have been declared in the region with a total coverage of 183 975 km2, but still covering less than 10% of the continental shelf in the region (Rocliffe et al., 2014). Sixty sixFig. 1. Coastal and island reefs and their analysis identification number.
Fig. 2. Major currents in the western Indian Ocean.
Source: Adapted fromLutjeharms and Bornman, 2010.
percent of reefs in the WIO are considered at risk from local threats, with half rated at high or very high risk, especially in Somalia, Tanzania, Comoros and La Réunion Island where more than 90% of reefs are threatened from activities such as overfishing, watershed-based pollution, and dynamite fishing.
2.2. Hydrodynamic connectivity model
We modeled larval dispersal patterns for the WIO region using the modeling framework ofTreml et al.(2008) implemented in
the Marine Geospatial Ecology Tools (MGET) software (Roberts et al., 2010b). This framework uses a two-dimensional Eulerian advection–diffusion algorithm to simulate the transport of larvae by dynamic ocean currents and turbulent diffusion. The dispersal simulation outputs a connectivity matrix that specifies, for each pair of source and destination reefs, the peak concentration of larvae released by the source reef that reached the destination reef.
For the study area definition, we used shoreline data from the GSHHS database (ftp://ftp.soest.hawaii.edu/pwessel/gshhs/,
Wes-sel and Smith, 1996) and reef locations from the World Atlas of Coral Reefs (UNEP-WCMC) at 1 km resolution. We downloaded daily surface geostrophic current velocities (deduced from remote sensing altimetry data) from AVISO (http://www.aviso.oceanobs. com) at 1
/
3°resolution (‘‘Global DT-Upd Merged MADT’’ prod-ucts) for the five-year period 2006–2010. We interpolated missing geostrophic current values using the Laplace interpolation method available in MGET. We organized all data as rasters projected into the World Mercator coordinate system with the WGS84 datum and a 33 km cell size.Pelagic larval duration (PLD) is the period of time during which larvae remain viable and capable of settling, and varies by species.
Treml et al.(2012) offered evidence that PLD is one of the primary determinants of seascape-wide connectivity. To evaluate how PLD affects connectivity in the WIO region, we performed dispersal simulations for PLDs of 10, 20, 30, 40 and 50 days. For each year, we back-calculated the larval release time (t0) for each new moon corresponding to ‘‘new moon date - PLD’’ and running until the PLD elapsed, resulting in approximately 12 simulations per year.
2.3. Connectivity measurement
Using the R statistical software (R Development Core Team, 2012), for each PLD we summarized the five years of connectivity matrices that resulted from the simulations into mean connectivity matrices. Next, to identify groups of reefs that were connected with one another, we applied a clustering algorithm to the mean connectivity matrices using APCluster, an R package for affinity propagation clustering (Bodenhofer et al., 2011). The algorithm is based on the ‘‘message passing’’ between points. Unlike other clustering algorithms (k-means or k-medoids;Jacobi et al., 2012;
Berline et al., 2014; (Rossi et al., 2014)), it is not necessary to determine or estimate the number of clusters before running the algorithm. This method has been developed to cluster images of faces, detect genes in microarray data, identify representative sentences in a manuscript, and identify cities that are efficiently accessed by airline travel (Frey and Dueck, 2007). In our analysis, we sought to identify clusters of highly connected reefs.
Finally, for each PLD, to highlight which reefs act as stepping stones for spreading individuals through the network (Kininmonth et al., 2010), we calculated betweenness centrality metrics for all nodes in the mean connectivity network, using the R package
igraph (Csardi and Nepusz, 2006). The betweenness centrality met-ric measures the proportion of shortest paths between nodes that pass through a given node (Borgatti, 2005). Nodes in the network (i.e. reefs) with high betweenness centrality are gateways through which larvae (and thus genes) have to pass in order to spread to other nodes, and therefore may be the most important for multi-generational connectivity within the region. To summarize the re-sults and identify reefs with consistently high betweenness cen-trality independent of PLD, we counted the number of PLDs for which each reef’s betweenness centrality score was higher than the mean for that PLD. Hereafter, we refer to this count as the ‘‘occur-rence’’ score for the reef. ‘‘Occurrences’’ ranges from 0 to 5.
3. Results
3.1. Connectivity matrices
Connectivity matrices, displaying the mean pattern of larvae flow among individual sites over the 2006–10 period, were derived for PLD comprised between 10 and 50 days. As PLD increases, the number of connections increases (Fig. 3). At low PLDs, some reefs did not exchange larvae with any other reefs, i.e. they are completely disconnected from the network. For example, for a PLD of 10 days, reefs of Pebane (reef number 25), Masoala Peninsula /
Fig. 3. Model-based assessment of the relationship between the PLD (x axis) and the number of connected coral reef sites (y axis) in the Western Indian Ocean.
Sainte Marie (19), Tromelin (22) and the islands of the Mascarene Archipelago (30, 31, 33) are disconnected. Pebane’s reef (25) is disconnected at all PLDs we tested.
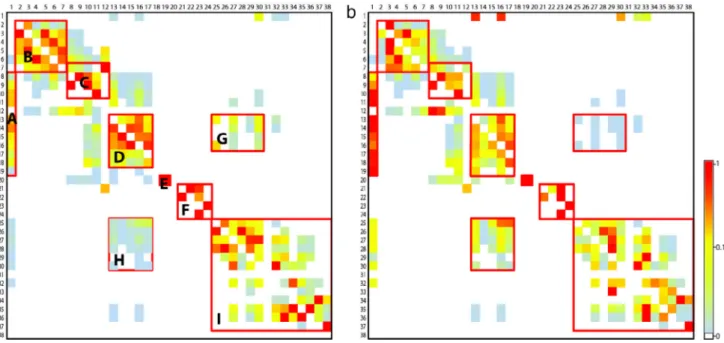
Nine ‘‘source–destination’’ sub-regions are visually identified on the connectivity matrices (Fig. 4): A: Comoros, South Seychelles, North tip of Madagascar and East African Coast; B: North Sey-chelles; C: South SeySey-chelles; D: Comoros, North tip of Madagas-car and the North of the Mozambique channel; E: Tromelin to East Madagascar; F: Mascarene archipelago; G: From Comoros region to the middle of the Mozambique Channel; H: From the middle of the Mozambique Channel to Comoros region; I: reefs of the middle and South of the Mozambique channel.
The results suggest that, for a PLD of 30 days (the median value we tested;Fig. 4), reefs in the WIO region were connected by larval dispersal during the studied period in a patchy fashion, with high interconnectivity within several sub-regions, and lower connectiv-ity across the entire WIO region. The same pattern was evident in both the import and export matrix. For example, the matrices indicate strong connections among reefs within the Mozambique Channel area (Fig. 3, region H), within the North Seychelles (B), and South Seychelles (C) islands, and between Tromelin and East Mada-gascar (E). Moreover, although the Mascarene archipelago islands are well connected with each other they are isolated from the other reefs of the region (F).
3.2. Cluster analysis
The cluster analysis confirms the visual interpretation of the connectivity matrices and reveals geographic sub-groups of reef based on the connectivity matrix for PLDs ranging from 10 to 50 days (Fig. 5). The number of clusters varies with PLD. For a PLD of 10 days 17 clusters are identified, against 12 clusters for a PLD of 20 days. Over 30 days, the number of cluster decreases from 10 (PLDs of 30 and 40 days) to 9 (PLD of 50 days) while clusters become geographically more integrative.
The geographic extent of most clusters grows with longer PLDs. For example, at PLDs lower than 30 days, Morondava/Anakao reefs (reef number 32), Bassas Da India (35), and Europa (36) are grouped within a single cluster (Fig. 5, upper left panel, cyan box). When PLD is longer than 40 days, this cluster extends to include Juan de Nova (27) and Masoarivo reefs (29). Similarly, at a PLD of 10 days, reefs extending from Santa Lucia to Maxixe (37, 38) formed a cluster (Fig. 5, upper left panel, orange box); at higher PLDs, this cluster extends to include Bazaruto archipelago reefs (34). Finally, this phenomenon was most pronounced with the largest cluster which first clustered the East African coast, Comoros, Mayotte, Geyser bank and Majunga reefs (13–15, 21) at a PLD of 10 days (Fig. 5, upper left panel, large blue box), but expand as PLD increased to 50 days to include all of Madagascar’s northern reefs and the northern part of the Seychelles archipelago.
Fig. 4. Connectivity matrices for PLD of 30 days, normalized to show immigration (a) and emigration (b). Rows represent ‘‘source’’ reefs; columns represent ‘‘destination’’ reefs. Reefs are ordered by their number (Fig. 1) increasing from top to bottom and left to right. (a) shows for each destination reef (column) the proportion of larvae coming from different source reefs (rows). (b) shows for each source reef (row) the proportion of larvae exported to each destination reef (column).
Fig. 5. Reefs clusters according to PLD (10–50 d). Each cluster is mapped as a cardinal rectangle embedding selected reef sites. All clusters belong to the same level (i.e. there are no sub-clusters). (For interpretation of the references to color in this figure legend, the reader is referred to the web version of this article.)
In contrast, several clusters remain stable (no additional reef added) as PLD increased. Notably, the Mascarene Archipelago reefs remained a distinct cluster for PLDs of 20–50 days (they were not connected at PLD
=
10 days); the same pattern occurred for the cluster grouping Tromelin (22) and the east Madagascar reefs (Masoala peninsula/Sainte Marie−19), and reefs of Angoche (20)
and Moma (26) in Mozambique.3.3. Betweenness centrality analysis
The values of the betweenness centrality index were calculated for each PLD. They are highly variable across reefs depending on PLD (Fig. 6). Four reefs had a betweenness centrality of zero for all PLDs (10 to 50 days): Nosy Ankomba/Nosy Anko reefs in Madagascar (18), Pebane reefs in Mozambique (25), La Réunion
Fig. 6. Betweenness centrality of reefs within the Western Indian Ocean according to PLD. Columns D10–D50 refer to PLD values. See identification of reef number inFig. 1.
reefs (33) and reefs extending from Santa Lucia in South Africa to Maputo in Mozambique (38). This indicated that they were isolated, i.e. not central for multi-step connectivity in the network for all PLDs (10–50 days).
Ten reefs (26%) have no occurrences, suggesting they were rel-atively less important to the overall connectedness of the network. No reefs had the maximum possible occurrence score of 5. Seven reefs tallied 4 occurrences: Cosmoledo (10), Mayotte (17), Angoche (20), Majunga (21), Moma (26), Masoarivo (29) and Europa (36). This result suggests that, comparatively, these reefs are the most important for multigenerational larvae connectivity in the WIO.
4. Discussion
4.1. Model-based connectivity patterns in the WIO
This model-based connectivity analysis assesses and compares larvae transport among 38 coral reefs distributed in the Western Indian Ocean region for PLD ranging from 10 to 50 days. Based on model outputs, this study identifies ‘‘source–destination’’ rela-tionships between reefs (connectivity matrices), to understand the scale and geographic patterns of connectivity in the region (cluster analysis), and highlight reefs of importance for connectivity within the WIO (betweenness centrality analysis).
As a main result, we identified clusters of reefs based on connec-tivity patterns, with high interconnecconnec-tivity within several regions (Mozambique Channel, Mascarene archipelago) and lower connec-tivity across the WIO region. With higher PLD, the model shows that connectivity increases in the region: larvae are transported further and the connectance is higher. Nevertheless, the Mascarene Archipelago remains isolated even with a PLD of 50 days.
Those results are congruent with genetic analysis performed in the region.Muths et al. (2011,2012,2014)provided information about the genetic diversity and differentiation of three reef fish species (E. merra, L. kasmira and M. berndti) to estimate the connectivity of coral fish in the southwestern Indian Ocean. They identified three main regions: the Mascarene archipelago, the Northern Mozambique Channel (Tanzania, Kenya, Seychelles) and
patchy structures within the Mozambique Channel. This genetic structure along the Mozambique Channel was also reported for the green turtle Chelonia mydas (Bourjea et al., 2007) and for brittle-stars (Hoareau et al., 2013) without the emergence of a clear shared pattern. We also found similarities with the biogeographic boundaries identified for reef-building corals byObura(2012) and conservation priority zones for the green turtle Chelonia mydas by
Bourjea(2014).
4.2. Methodological limitations and improvement
The hydrodynamic model MGET provides a way to assess larval connectivity in terms of connectance and larval flow direction. Nevertheless, the model uses low-resolution altimetry data and simplistic passive larvae behavior to simulate larvae transport. It could be improved by accounting for additional oceanographic and biological factors as discussed in Crochelet et al. (2013). However,Treml et al.(2012) show evidence that PLD is one of the primary determinants of seascape-wide connectivity and that larval behavior is much more important at local scales (i.e. local retention) than regional scale.
This study also experienced limitations due to the fact that reefs of the East African coast were aggregated together during spatial treatment resulting in a single contiguous reef (reef 1). This latter should be ‘‘cut’’ every 50/100 km for a future analysis to give more detailed results in this area.
The three methods of analysis used in this study (connectivity matrices, clustering and betweenness centrality calculation) provide complementary results but are also strengthening each other. The visual analysis of the connectivity matrices and the ‘‘automatic’’ clustering analysis using the R script APCluster lead to similar results. APCluster has been applied to various domains including genes detection in microarray data and airport connectivity but, to our knowledge, this study is the first application of APCluster to ecological connectivity. Our study demonstrates that this analytical method is relevant and quick to implement. This approach would prove particularly useful in the case of finer-scale connectivity analysis with connectivity
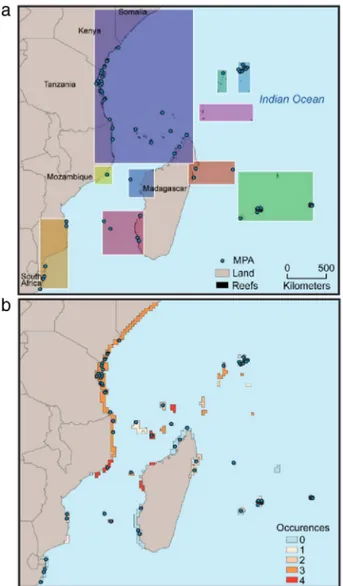
Fig. 7. Crossed analysis between clustering results and MPA locations (a), betweenness centrality and MPA locations (b).
matrices made of hundreds or thousands of sites (i.e. excluding a visual analysis). The betweenness centrality analysis completes the clustering analysis by highlighting individual reefs that are central in the connectivity network. Moreover, in the two analyses, the same reef was identified as isolated: Pebane’s reef (25) in Mozambique. This result has been verified by a connectivity degree analysis (neighborhood of graph vertices, igraph package, not presented here), which shows this reef as the only one completely isolated from the regional network.
4.3. Implications for conservation and fisheries management
Our study shed some light on the likely geographical scale of connectivity and reef centrality in the WIO. This information provides support for spatial conservation planning and regional cooperation (Fig. 7).
MPAs of the region include approximately 20% of reefs (The World Database on Protected Areas, www.protectedplanet.net;
Fig. 7(a)). MPAs are globally well represented in every cluster. There is at least one MPA per cluster except in the ‘‘South Sey-chelles’’ cluster where there is no MPA. However, only three sites (out of seven) of high centrality (Fig. 7(b); number of occur-rences
=
4) host one MPA (Europa, Mayotte, Moma and Angoche). It is thus important to consider the other high centrality sites as priority sites for MPA implementation: Cosmoledo (10), Majunga(21) and Masoarivo (29). Four more sites can be added to this list such as Platte Island (5), Farquhar (11), Agalega (12) and Geyser bank (15), with a number of betweenness centrality occurrences of 3. We would also recommend considering Pebane’s reef (25) in Mozambique, which was discarded from all analysis because com-pletely isolated for all PLD. This analysis could be completed with an assessment of impacts of anthropogenic pressures across the re-gional network of coral reef, partially covered with MPAs (Halpern et al., 2009).
This connectivity study shows that the MPA implementation in the WIO has to be designed as a network and planned at the regional scale to maintain connectivity nodes and the health of spawning stocks. Thus different governments would need to work together to create an effective cross-boundary and transnational management of inter-connected ecosystems. Moreover, this could lead to the establishment of a strong knowledge-based network that would better reflect regional ecological patterns and pro-cesses. The establishment of an MPA network is a way to enhance links between countries knowing that the resources of a country also depend on those of neighboring countries.
Regional scale conservation planning could be set-up through international cooperation only including groups of countries (cor-responding with clustering results for example) but also by inte-grating already existing regional instruments such as IOC (Indian Ocean Commission), EAC (East African Community) or Nairobi Con-vention. In the end, we can imagine the establishment of an or-ganization to operate at the WIO-scale, aimed at structuring in-teractions among different actors (i.e. scientists, MPA managers, decision makers and multisectoral stakeholders) with the collec-tive goal of integrating connectivity into MPA networks planning. This concept has already been set up in the form of an alliance in the Indian Ocean: the Sargasso Sea Alliance in the Southern Indian Ocean (Garcia et al., 2013), or the Western Indian Ocean Sustain-able Ecosystem Alliance which are voluntary associations of ex-isting institutions with public and private partners. Last but not least, this initiative cannot continue in the coming years without appropriate funding. Each country could allocate a portion of its revenue from fisheries, tourism, resource exploitation, etc. for con-servation. The bridging regional conservation organization would be in charge of this management fund to promote common profits, prosperity and sustainable use of resources at the regional scale.
5. Conclusion
We tested different methods to measure and characterize ma-rine connectivity patterns in the WIO such as clustering and be-tweenness centrality using model-based transport data from 2006 to 2010. Clustering gave information on groups of countries which should cooperate to preserve their common marine resources. Betweenness centrality analysis refers to how important a reef is for connecting other ones that would otherwise be discon-nected. Comparing those results with the actual MPA constellation highlighted that several reef complexes have to be considered as next priority sites for MPA implementation: Pebane, Cosmoledo, Majunga, Masoarivo, Platte Island, Farquhar, Agalega and Geyser bank. This kind of information is crucial, especially considering the oil and gas exploration which currently takes place in the re-gion. Moreover, the crossed-analyses with marine human impacts showed that a lot of reefs are still situated in very high impacted zones and should be placed in protection. Finally expected efforts to extend the current MPA network in the WIO will need inter-national collaboration, through political will, which is the key for successful marine environments protection. We advocated the cre-ation of an organizcre-ation operating at the regional scale to structure interactions among the different actors and which could be respon-sible of a common management fund. The success of governance across the borders of the countries will depend on the clarifica-tion of the responsibilities of each actors and their collaborative and concerted vision of the ocean particularly at political level.
Acknowledgments
This study was initiated with the financial assistance of the UNEP-GEF ASCLME: 2011/LICA-SP/29392 project (Agulhas and Somali Current Large Marine Ecosystems) and was finalized in the framework of the MASMA MOZALINK: MASMA/Planning Grant/09/13 project ‘‘Linking marine science, traditional knowl-edge and cultural perceptions of the sea in the Mozambique Channel to build tomorrow’s marine management using spatial simulation tools and educational game’’ (www.wiomsa.org). We acknowledge the MASMA program funds and the assistance of WIOMSA (Western Indian Ocean Marine Science Association). All authors thank Gaël Potin for his assistance in R computing.
References
Almany, G.R., Connolly, S.R., Heath, D.D., Hogan, J.D., Jones, G.P., McCook, L.J., Mills, M., et al.,2009. Connectivity, biodiversity conservation and the design of marine reserve networks for coral reefs. Coral Reefs 28, 339–351. Barrow, E., Mahler, F., Mosele, L., Mvoyi, C., Ntahuga, L., et al.,2007. Sound natural
resource management: The foundation for achieving the MDGs in Somalia. Policy Brief.
Bennett, N.J., Dearden, P.,2014. From measuring outcomes to providing inputs: Governance, management, and local development for more effective marine protected areas. Mar. Policy 50, 96–110.
Berline, L., Rammou, A.-M., Doglioli, A., Molcard, A., Petrenko, A., 2014. A connectivity-based eco-regionalization method of the Mediterranean sea. PLoS One 9, e111978.http://dx.doi.org/10.1371/journal.pone.0111978.
Billé, R., Rochette, J., 2010. Feasibility Assessment of an ICZM Protocol to the Nairobi Convention.
Bodenhofer, U., Kothmeier, A., Hochreiter, S.,2011. APCluster: an R package for affinity propagation clustering. Bioinformatics 27, 2463–2464.
Borgatti, S.P.,2005. Centrality and network flow. Social Networks 27, 55–71. Borja, A., Bricker, S.B., Dauer, D.M., Demetriades, N.T., Ferreira, J.G., Forbes, A.T.,
Hutchings, P., et al.,2008. Overview of integrative tools and methods in assessing ecological integrity in estuarine and coastal systems worldwide. Mar. Pollut. Bull. 56, 1519–1537.
Botsford, L.W., White, J.W., Coffroth, M.-A., Paris, C.B., Planes, S., Shearer, T.L., Thorrold, S.R., et al., 2009. Connectivity and resilience of coral reef metapopulations in marine protected areas: matching empirical efforts to predictive needs. Coral Reefs 28, 327–337.
Bourjea, J.,2014. Structure et connectivité de la mégafaune marine à l’échelle d’une région océanique: enjeux pour la gestion durable des tortues marines dans l’océan Indien occidental. (Thèse de doctorat), Université de La Réunion, p. 169. Bourjea, J., Lapègue, S., Gagnevin, L., Broderick, D., Mortimer, J.A., Ciccione, S., Roos, D., Taquet, C., Grizel, H., 2007. Phylogeography of the green turtle, Chelonia
mydas, in the Southwest Indian Ocean: Phylogeography of the green turtle. Mol.
Ecol. 16, 175–186.http://dx.doi.org/10.1111/j.1365-294X.2006.03122.x. Chapman, P., Marco, S.F.D., Davis, R., Coward, A.,2003. Flow at intermediate depths
around Madagascar based on ALACE float trajectories. Deep Sea Res. Part II 50, 1957–1986.
Conservation International, 2009. In: Proceedings of the 2008 Annual Seascapes Strategy Workshop, held December 11–13, 2008, in Kota Kinabalu, Malaysia. Conservation International, Arlington, VA, USA.
Costello, M.J.,2014. Long live marine reserves: A review of experiences and benefits. Biol. Cons. 176, 289–296.
Cowen, R., Gawarkiewicz, G., Pineda, J., Thorrold, S., Werner, F.,2007. Population connectivity in marine systems: An overview. Oceanography 20, 14–21. Cowen, R.K., Lwiza, K.M.M., Sponaugle, S., Paris, C.B., Olson, D.B.,2000. Connectivity
of marine populations: open or closed? Science 287, 857.
Cowen, R.K., Sponaugle, S., 2009. Larval dispersal and marine population connectivity. Annu. Rev. Mar. Sci. 1, 443–466.
Crochelet, E., Chabanet, P., Pothin, K., Lagabrielle, E., Roberts, J., Pennober, G., Lecomte-Finiger, R., et al.,2013. Validation of a fish larvae dispersal model with otolith data in the Western Indian Ocean and implications for marine spatial planning in data-poor regions. Ocean Coast. Manage. 86, 13–21.
Csardi, G., Nepusz, T.,2006. The igraph software package for complex network research. Int. J. Complex Syst. 1695.
Fenberg, P.B., Caselle, J.E., Claudet, J., Clemence, M., Gaines, S.D., Antonio García-Charton, J., Gonçalves, E.J., et al.,2012. The science of European marine reserves: Status, efficacy, and future needs. Mar. Policy 36, 1012–1021.
Foley, M.M., Halpern, B.S., Micheli, F., Armsby, M.H., Caldwell, M.R., Crain, C.M., Prahler, E., et al., 2010. Guiding ecological principles for marine spatial planning. Mar. Policy 34, 955–966.
Frey, B.J., Dueck, D.,2007. Clustering by passing messages between data points. Science 315, 972–976.
Gaines, S.D., White, C., Carr, M.H., Palumbi, S.R.,2010. Designing marine reserve networks for both conservation and fisheries management. Proc. Natl. Acad. Sci. 107, 18286–18293.
Garcia, S.M., Cohen, H., Freestone, D., Martinez, C., Oral, N., Rogers, A., Verlaan, P.A., Vousden, D.,2013. An Ecosystem Approach to Management of Seamounts in the Southern Indian Ocean. Volume 4 – A Road Map Towards Sustainable use and Conservation of Biodiversity in the Southern Indian Ocean. IUCN, Gland, Switzerland, p. 32 + iv.
García-Charton, J.A., Pérez-Ruzafa, A., Marcos, C., Claudet, J., Badalamenti, F., Benedetti-Cecchi, L., Falcón, J.M., et al.,2008. Effectiveness of European Atlanto-Mediterranean MPAs: Do they accomplish the expected effects on populations, communities and ecosystems? J. Nat. Conserv. 16, 193–221.
Gardner, T.A., Côté, I.M., Gill, J.A., Grant, A., Watkinson, A.R.,2005. Hurricanes and Caribbean coral reefs: impacts, recovery patterns, and role in long-term decline. Ecology 86, 174–184.
Ginis, I.,2002. Tropical Cyclone-Ocean Interactions. Atmosphere-Ocean Interac-tions. In: Advances in Fluid Mechanics Series, vol. 33. WIT Press, pp. 83–114. Gjertsen, H.,2005. Can habitat protection lead to improvements in human
well-being? Evidence from marine protected areas in the philippines. World Dev. 33, 199–217.
Gray, N.J., 2008. Producing Success: Co-Management of a Marine Protected Area in Belize. (unpublished paper). Nicholas School of the Environment, Duke University, Durham, NC.
Green, A.L., Fernandes, L., Almany, G., Abesamis, R., McLeod, E., Aliño, P.M., White, A.T., et al.,2014. Designing marine reserves for fisheries management, biodiversity conservation, and climate change adaptation. Coast. Manag. 42, 143–159.
Guerreiro, J., Chircop, A., Grilo, C., Viras, A., Ribeiro, R., van der Elst, R.,2010. Establishing a transboundary network of marine protected areas: Diplomatic and management options for the east African context. Mar. Policy 34, 896–910. Guidetti, P., Milazzo, M., Bussotti, S., Molinari, A., Murenu, M., Pais, A., Spanò, N., et al.,2008. Italian marine reserve effectiveness: Does enforcement matter? Biol. Cons. 141, 699–709.
Halpern, B.S., Walbridge, S., Selkoe, K.A., Kappel, C.V., Micheli, F., D’Agrosa, C., Bruno, J.F., Casey, K.S., Ebert, C., Fox, H.E., Fujita, R., Heinemann, D., Lenihan, H.S., Madin, E.M.P., Perry, M.T., Selig, E.R., Spalding, M., Steneck, R., Watson, R., 2009. A global map of human impact on marine ecosystems. Science 319, 948–952. http://dx.doi.org/10.1126/science.1149345.
Harmelin-Vivien, M.L.,1994. The effects of storms and cyclones on coral reefs: a review. J. Coast. Res. 211–231.
Hoareau, T.B., Boissin, E., Paulay, G., Bruggemann, J.H., 2013. The Southwestern Indian Ocean as a potential marine evolutionary hotspot: perspectives from comparative phylogeography of reef brittle-stars. J. Biogeogr. 40, 2167–2179. http://dx.doi.org/10.1111/jbi.12155.
Hoegh-Guldberg, O., Mumby, P.J., Hooten, A.J., Steneck, R.S., Greenfield, P., Gomez, E., Harvell, C.D., et al.,2007. Coral reefs under rapid climate change and ocean acidification. Science 318, 1737–1742.
Hughes, T.P., Baird, A.H., Bellwood, D.R., Card, M., Connolly, S.R., Folke, C., Grosberg, R., et al.,2003. Climate change, human impacts, and the resilience of coral reefs. Science 301, 929–933.
IUCN, 2000. Progress in implementing the Jakarta Mandate in the eastern Africa region. In: A Report to the Fifth Conference of the Parties to the Convention on Biological Diversity.
Jacobi, M.N., André, C., Döös, K., Jonsson, P.R., 2012. Identification of sub-populations from connectivity matrices. Ecography 35, 1004–1016. http://dx.doi.org/10.1111/j.1600-0587.2012.07281.x.
Jones, G.P., Russ, G.R., Sale, P.F., Steneck, R.S.,2009. Theme section on ‘Larval connectivity, resilience and the future of coral reefs’. Coral Reefs 28, 303–305. Jones, G., Srinivasan, M., Almany, G.,2007. Population connectivity and
conserva-tion of marine biodiversity. Oceanography 20, 100–111.
Kingsford, M.J., Leis, J.M., Shanks, A., Lindeman, K.C., Morgan, S.G., Pineda, J.,2002. Sensory environments, larval abilities and local self-recruitment. Bull. Mar. Sci. 70, 309–340.
Kininmonth, S., De’ath, G., Possingham, H.,2010. Graph theoretic topology of the Great but small Barrier reef world. Theor. Ecol. 3, 75–88.
Laffoley, D. d’A. (Ed.),2008. Towards Networks of Marine Protected Areas. The MPA Plan of Action for IUCN’s World Commission on Protected Areas. IUCN WCPA, Gland, Switzerland, ISBN: 978-2-8317-1091-4, p. 28.
Leis, J.M.,1984. Larval fish dispersal and the east Pacific barrier. Océanogr. Trop. 19, 181–192.
Leis, J.,2002. Pacific coral-reef fishes: The implications of behaviour and ecology of larvae for biodiversity and conservation, and a reassessment of the open population paradigm. Environ. Biol. Fishes 65, 199–208.
Lester, S., Halpern, B., Grorud-Colvert, K., Lubchenco, J., Ruttenberg, B., Gaines, S., Airamé, S., et al.,2009. Biological effects within no-take marine reserves: a global synthesis. Mar. Ecol. Prog. Ser. 384, 33–46.
Lubchenco, J., Palumbi, S.R., Gaines, S.D., Andelman, S.,2003. Plugging a hole in the ocean: The emerging science of marine reserves. Ecol. Appl. 13, 3–7. Lutjeharms, J.R.E., Bornman, T.G., 2010. The importance of the greater
Ag-ulhas Current is increasingly being recognised. South Afr. J. Sci. 106, http://www.sajs.co.za/index.php/SAJS/article/view/160(accessed 30.09.14). McCook, L.J., Almany, G.R., Berumen, M.L., Day, J.C., Green, A.L., Jones, G.P., Leis,
J.M., et al.,2009. Management under uncertainty: guide-lines for incorporating connectivity into the protection of coral reefs. Coral Reefs 28, 353–366. McLeod, E., Salm, R., Green, A., Almany, J.,2008. Designing marine protected area
networks to address the impacts of climate change. Front. Ecol. Environ. 7, 362–370.
Moberg, F., Folke, C.,1999. Ecological goods and services of coral reef ecosystems. Ecol. Econ. 29, 215–233.
Moffat, D., Ngoile, M., Linden, O., Francis, J.,1998. The reality of the stomach: coastal management at the local level in Eastern Africa. Ambio 27, 590–598.
Mora, C., Treml, E.A., Roberts, J., Crosby, K., Roy, D., Tittensor, D.P.,2012. High connectivity among habitats precludes the relationship between dispersal and range size in tropical reef fishes. Ecography 35, 89–96.
Mouillot, D., Culioli, J.M., Pelletier, D., Tomasini, J.A.,2008. Do we protect biological originality in protected areas? A new index and an application to the Bonifacio strait natural reserve. Biol. Cons. 141, 1569–1580.
Muths, D., Gouws, G., Mwale, M., Tessier, E., Bourjea, J., Moran, P., 2012. Genetic connectivity of the reef fish Lutjanus kasmira at the scale of the western Indian Ocean. Can. J. Fish. Aquat. Sci. 69, 842–853. http://dx.doi.org/10.1139/f2012-012.
Muths, D., Tessier, E., Bourjea, J., 2015. Genetic structure of the reef grouper
Epinephelus merra in the West Indian Ocean appears congruent with
biogeographic and oceanographic boundaries. Mar. Ecol. 36, 447–461.http://dx.doi.org/10.1111/maec.12153.
Muths, D., Tessier, E., Gouws, G., Craig, M., Mwale, M., Mwaluma, J., Mwandya, A., Bourjea, J., 2011. Restricted dispersal of the reef fish Myripristis berndti at the scale of the SW Indian Ocean. Mar. Ecol. Prog. Ser. 443, 167–180.
http://dx.doi.org/10.3354/meps09394.
National Research Council,2001. Marine Protected Areas Tools for Sustaining Ocean Ecoystems. National Academy Press, Washington, DC.
Obura, D., 2012. The diversity and biogeography of Western Indian ocean reef-building corals. PLoS One 7, e45013.
http://dx.doi.org/10.1371/journal.pone.0045013.
Obura, D., Church, J., Daniels, C., Kalombo, H., Shleyer, M., Suleiman, M., 2004. Status of coral reefs in East Africa 2004: Kenya, Tanzania, Mozambique and South Africa.
Planes, S., Jones, G.P., Thorrold, S.R.,2009. Larval dispersal connects fish populations in a network of marine protected areas. Proc. Natl. Acad. Sci. 106, 5693–5697. Pujolar, J.M., Schiavina, M., Di Franco, A., Melià, P., Guidetti, P., Gatto, M., De Leo, G.A.,
et al.,2013. Understanding the effectiveness of marine protected areas using genetic connectivity patterns and Lagrangian simulations. Divers. Distrib. 19, 1531–1542.
R Core Team, R: a language and environment for statistical computing. R Foundation for Statistical Computing, Vienna, Austria, 2012, ISBN 3-900051-07-0, URL http://www.R-project.org/.
Roberts, C.M.,1997. Connectivity and management of Caribbean coral reefs. Science 278, 1454–1457.
Roberts, J.J., Best, B.D., Dunn, D.C., Treml, E.A., Halpin, P.N.,2010b. Marine geospatial ecology tools: An integrated framework for ecological geoprocessing with ArcGIS, Python, R, MATLAB, and C++. Environ. Model. Softw. 25, 1197–1207. Roberts, C.M., Hawkins, J.P., Fletcher, J., Hands, S., Raab, K., Ward, S., 2010a. Guidance
on the size and spacing of marine protected areas in England. University of York, York: Environment Department.
Rocliffe, S., Peabody, S., Samoilys, M., Hawkins, J.P.,2014. Towards a network of locally managed marine areas (LMMAs) in the Western Indian Ocean. PLoS One 9, e103000.
Rossi, V., Ser-Giacomi, E., López, C., Hernández-García, E.,2014. Hydrodynamic provinces and oceanic connectivity from a transport network help designing marine reserves. Geophys. Res. Lett. 41, 2883–2891.
Rossiter, J.S., Levine, A.,2014. What makes a ‘successful’ marine protected area? The unique context of Hawaii’s fish replenishment areas. Mar. Policy 44, 196–203. Russ, G.R., Alcala, A.C., Maypa, A.P., Calumpong, H.P., White, A.T.,2004. Marine
reserve benefits local fisheries. Ecol. Appl. 14, 597–606.
Sale, P.F., Cowen, R.K., Danilowicz, B.S., Jones, G.P., Kritzer, J.P., Lindeman, K.C., Planes, S., et al.,2005. Critical science gaps impede use of no-take fishery reserves. Trends Ecol. Evol. 20, 74–80.
Salm, R.V., Coles, S.L. (Eds.),2001. Coral bleaching and marine protected areas. Proceedings of the workshop on mitigating coral bleaching impact through MPA design. Asia Pacific coastal marine program Report #0102. Bishop Museum, Honolulu, Hawaii, 29–31 May, Honolulu, Hawaii. The Nature Conservancy.
Schultz, E.T., Cowen, R.K.,1994. Recruitment of coral reef fishes to Bermuda: Local retention or long-distance transport? Mar. Ecol. Prog. Ser. 109, 15–28. Spalding, M.D., Meliane, I., Milam, A., Fitzgerald, C., Hale, L.Z.,2013. Protecting
marine spaces: global targets and changing approaches. In: Ocean Yearbook, Vol. 27. Dalhousie University, Leiden, pp. 213–248.
Srinivasan, U.T., Watson, R., Rashid Sumaila, U.,2012. Global fisheries losses at the exclusive economic zone level, 1950 to present. Mar. Policy 36, 544–549. Tessema, Y., Salm, R.V., 1998. Kenya Wildlife Service. IUCN Eastern Africa
Programme. IUCN East Africa Regional Office. Partnership for conservation: report of the Regional Workshop on Marine Protected Areas, Tourism, and Communities, Diani Beach, Kenya, 11–13 May, 1998. IUCN Eastern Africa Regional Office, Nairobi, Kenya.
Tomczak, M., Godfrey, J.S.,2003. Regional Oceanography: An Introduction, second ed. Daya Publ. House, Delhi, p. 390.
Toropova, C., Meliane, I., Laffoley, D., Matthews, E., Spalding, M., 2010. Global Ocean Protection Present Status and Future Possibilities. IUCN WCPA, Brest, France, p. 96. Agence des aires marines protégées, Gland, Switzerland, Washington, DC and New York, USA, Cambridge, UK: UNEP-WCMC, Arlington, USA: TNC, Tokyo, Japan: UNU, New York, USA: WCS. http://data.iucn.org/dbtw-wpd/edocs/2010-053.pdf(accessed 30.09.14).
Treml, E.A., Halpin, P.N., Urban, D.L., Pratson, L.F.,2008. Modeling population connectivity by ocean currents, a graph-theoretic approach for marine conservation. Landsc. Ecol. 23, 19–36.
Treml, E.A., Roberts, J.J., Chao, Y., Halpin, P.N., Possingham, H.P., Riginos, C., 2012. Reproductive output and duration of the pelagic larval stage determine seascape-wide connectivity of marine populations. Integr. Comp. Biol. 52, 525–537.
UNEP-WCMC, 2010. World Database on Protected Areas (WDPA) Annual Release 2010. Cambridge: UNEP-World Conservation Monitoring Centre. Available: http://www.unep-wcmc.org.
Victor, B.C.,1987. Growth, dispersal, and identification of planktonic labrid and pomacentrid reef-fish larvae in the eastern Pacific Ocean. Mar. Biol. 95, 145–152.
Wessel, P., Smith, W.H.,1996. A global, self-consistent, hierarchical, high-resolution shoreline database. J. Geophys. Res. Solid Earth 101, 8741–8743. (1978–2012). Wilkinson, C., 2008. Status of coral reefs of the world: 2008. Global Coral Reef
Monitoring Network and Reef and Rainforest Research Centre, Townsville, Australia.
Wilson, S.K., Adjeroud, M., Bellwood, D.R., Berumen, M.L., Booth, D., Bozec, Y.-M., Chabanet, P., et al.,2010. Crucial knowledge gaps in current understanding of climate change impacts on coral reef fishes. J. Exp. Biol. 213, 894–900. WWF, 2004a. Eastern African Marine Ecoregion Programme. Eastern African Marine
Ecoregion Conservation Plan (2005-2009). WWF Dar es Salaam, Tanzania. p. 62. WWF, 2004b. Eastern African Marine Ecoregion. Towards the Establishment of an Ecologically Representative Network of Marine Protected Areas in Kenya, Tanzania and Mozambique. WWF: Dar es Salaam, Tanzania. p. 74.
WWF, 2004c. Eastern African Marine Ecoregion. The Eastern African Marine Ecoregion Vision: A large scale conservation approach to the management of biodiversity. WWF: Dar es Salaam, Tanzania. p. 53.
WWF, 2004d. Eastern African Marine Ecoregion, Biodiversity Conservation Strategic Framework 2005-2025. WWF: Dar es Salaam, Tanzania. p. 54.