To cite this document: Hor, Anis and Saintier, Nicolas and Robert, Camille and Palin-Luc, Thierry and Morel, Franck Analysis of the multiaxial fatigue strength at the
mesoscopic scale using 3D microstructure modeling and extreme value statistics. (2013)
In: 13th International Conference on Fracture (ICF13), 16 June 2013 - 21 June 2013 (Beijing, China).
Open Archive Toulouse Archive Ouverte (OATAO)
OATAO is an open access repository that collects the work of Toulouse researchers and makes it freely available over the web where possible.
This is an author-deposited version published in: http://oatao.univ-toulouse.fr/ Eprints ID: 10877
Any correspondence concerning this service should be sent to the repository administrator: [email protected]
Analysis of the multiaxial fatigue strength at the mesoscopic scale using 3D
microstructure modeling and extreme value statistics
Anis Hor
1,*, Nicolas Saintier
1, Camille Robert
2, Thierry Palin-Luc
1, Franck
Morel
21
Arts et Métiers ParisTech, I2M - CNRS, Esplanade des Arts et Métiers 33405 Talence, France 2
Arts et Métiers ParisTech, LAMPA, 2 bd du Ronceray 49035 Angers, France * Corresponding author: [email protected]
Abstract Fatigue life computing methods are generally based on putting into equation the mechanical
quantities calculated at the micro or meso scale, the relevance of these selected quantities being validated by the capacity of the models to reproduce experimental results at the macroscopic scale. Although the scaling of the damage mechanisms involved in fatigue crack initiation processes are relatively well identified (grain scale, slip bands), their explicit consideration in fatigue criteria is still not well-developed. Furthermore, the existing methods do not consider the microstructure-sensitivity. The aim of this paper is to present the computational strategies developed to account for the microstructure-sensitivity in the calculation of fatigue strength. This work is based on three parts: (1) the development of 3D microstructure modeling tools (2) the analysis of the dispersion induced by the microstructure heterogeneities on the critical fatigue damage indicators and (3) the development of a statistical approach which provides a framework for analyzing calculation results in the HCF (High Cycle Fatigue) regime.
In this background, a method of analysis based on the construction of statistical extreme value distributions from FEA calculation results was developed. The evolution of the scaling parameters of these distributions for different loading conditions informed us about the effect of non-proportional loading and microstructure. A design method based on these extreme value statistics is presented to obtain a new mesoscopic criterion sensitive to microstructure parameters. Finally, surface effects are discussed too.
Keywords HCF, crystal plasticity, extreme value probability, FE simulation.
Abbreviation and designation
HCF: High Cycle Fatigue
FIP: Fatigue Indicator Parameter RVE: Representative Volume Element SVE: Statistical Volume Element
GEV: Generalized Extreme Value distribution Microscopic length scale: corresponding to the integration points
Mesoscopic length scale: Corresponding to the average density in a grain Macroscopic length scale: Corresponding to the elementary volume average
1. Introduction
In literature, methods for determining the fatigue behavior based on multiscale modeling estimate that the fatigue strength of metals depends on the extreme value statistics of a single microstructure
attribute [1] (for example inclusion size). This is only valid when the considered element of microstructure is a representative volume element (RVE) with regards to fatigue. Although the definition of the RVE is possible for some deterministic behaviour aspects (such as elastoplastic behaviour), it is difficult to evaluate a RVE for the HCF strength which is macroscopically highly dispersed. Therefore the use of a single microstructure element (with a smaller volume than the RVE with regards to the fatigue behaviour but equal to the RVE size with regards to the elastoplastic behaviour) does not make it possible to take into account the contribution of the microstructure heterogeneities in the HCF response. To solve this issue, Liao [2] used the Monte Carlo method to build statistical volume element (SVE) of a microstructure with a random distribution of grain sizes and crystallographic orientations. Despite considering elastic behaviour of crystal only, Liao showed a good correlation between the results obtained by modeling the extreme value probability with a Fréchet distribution and experimental results. Recently, Przybyla et al. [3, 4] introduced a new framework taking into account the effects of neighborhood through the extreme values of the marked correlation functions to quantify the influence of microstructure on the fatigue limit and the contribution of interactions in the microstructure in the case of uniaxial loading. Przybyla used Gumbel distribution function to describe the extreme value probability of the studied parameters.
The purpose of this work is, first, to analyze the microstructure sensitivity (morphology and orientation) of the fatigue indicator parameter (FIP) corresponding to the adaptation of multiaxial fatigue strength criteria at the mesoscopic length scale. Then a statistical study is used to define new mesoscopic thresholds for the FIPs, different from the original thresholds of the macroscopic criteria. Finally, the capability of the macroscopic criteria to take into account the microstructure sensitivity will be discussed through a comparison between the thresholds determined by the statistical response of the microstructure at the grain scale (called mesoscopic) and the original macroscopic thresholds. Free surface effects are also discussed with the comparison between FIPs determined from different FE models: 2D, 3D and 3D taking into account the grain surface only.
2. Numerical model
2.1. Constitutive relationsThe material parameters considered in this work are those of pure copper. This material has a face-centered cubic crystal structure with 12 slip systems (<111> {110}). The behaviour is modeled by cubic elasticity and crystal plasticity constitutive law. The crystal plasticity model used in this work is the one introduced by Meric and Cailletaud [5]. The cubic elasticity constants, the material parameters and the coefficients of the interaction matrix have been identified on a high purity copper by Gérard et al. [6].
2.2. Grain morphology and crystallographic texture
The simulations performed in this study were done using 3D semi-periodic microstructures (periodicity along X1 and X2). The Voronoï polyhedra method was used to model the morphology of
positioned and oriented germs so as to have a distance greater than or equal to 0.02 between two germs. The CAD model was discretized by around to 5.105 linear tetrahedral finite elements (figure 1-(b)). Computed microstructure contains 200 equiaxed grains (figure 1-(a)) with an average of 2500 finite elements per grain. In addition to loading, periodicity conditions were applied on the planes corresponding to X1min, X1max, X2min and X2max. To take into account the free surface
effect, the symmetry conditions were applied on the face corresponding to X3min. The grain
number on the free surface (corresponding to X3max) is about 50. Finally, the random selection of
200 crystal orientations was carried out in the Euler space defined by the three angles (
ϕ
1,φ
,ϕ
2) assuming cubic crystal symmetry and triclinic sample symmetry. Figure 1-(c) shows the {100} and {110} pole figures of these 200 orientations. Given the low number of orientations, this crystallographic aggregate can be considered as having no preferential orientations.Figure 1. (a) Grain morphology, (b) Mesh and (c) {100} and {110} pole figures showing the selected crystallographic orientations
2.3. Fatigue loading conditions
Different loading conditions are investigated in this section: uniaxial loading, and tension /torsion loadings with different biaxiality ratios k =
σ
aτ
a and different phase shifts. The selected loading ratio is R =σa,min σa,max =−1. The combined loading levels equivalent to the median fatigue limit at 107 cycles are determined using the Crossland criterion [9]. These load levels are given in Table1.Table 1. Tension (
σ
a) and torsion (τ
a) stress amplitude used for different load conditions (σ
aτ
a [MPa])loading Tension Torsion Combined loading tension/torsion P h as e s h if t biaxiality k =0 k =∞ k=0.5 k =1 k =2 ° = 0 ϕ 56/0 0/36 43.5/22 30/30 17/34 ° = 45 ϕ 47/23 31/31 17/34.5 ° = 90 ϕ 56/28 34/34 17.5/35
3. Mesoscopic fatigue indicator parameters
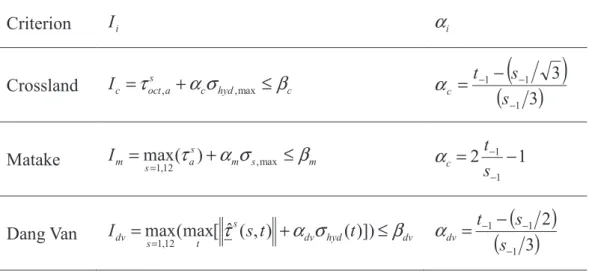
The studied fatigue indicator parameters (FIPs) were selected from stress criteria widely used in the literature. The multiaxial HCF criteria considered here are Crossland [9], Matake [10] and Dang Van [11]. These fatigue criteria are generally defined in the context of continuum mechanics. In order to evaluate the fatigue criterion on each computed microstructures, the usual HCF criterion are projected on the slip systems of the crystals. This procedure is repeated for each crystal considering its local orientation (
ϕ
1,φ
,ϕ
2) and localstress state computed by FE for each loading case. For instance, the shear stress vector in a given plane is transformed into a resolved shear stress vector over a slip system. The rotation of the crystal in space (defined by the Euler angles (ϕ
1,φ
,ϕ
2)) covers all the planes and directions of space, which enables to find the same critical planes and directions (planes and directions maximizing the criterion) than those obtained by the original criterion (with continuous formulation). Table 4 displays the expressions of FIPs adapted to the crystal scale.Table 2. Expression of Fatigue Indicator Parameters (FIPs) of the studied criteria
Criterion Ii αi Crossland c hyd c s a oct c I =
τ
, +α
σ
,max ≤β
(
)
(
3)
3 1 1 1 − − − − = s s t c α Matake m s m s a s m I = τ +α σ ≤β =1,12( ) ,max max 2 1 1 1 − = − − s t c αDang Van dv hyd dv
s t s dv s t t I =
τ
+α
σ
≤β
= (max[ ˆ ( , ) ( )]) max 12 , 1(
)
(
3)
2 1 1 1 − − − − = s s t dv αFinally, the parameters αi and βi describing the median macroscopic threshold of the considered criteria are identified from two median fatigue limits for 107 cycles of the considered material on
smooth specimens under fully reversed loadings: tension (s−1=56MPa) and torsion (t−1=36MPa)
from the work of Lukas and Kunz [12]. The parameters
β
i are identical for the three criteria (β
c =β
m=β
dv=t−1). The expression ofα
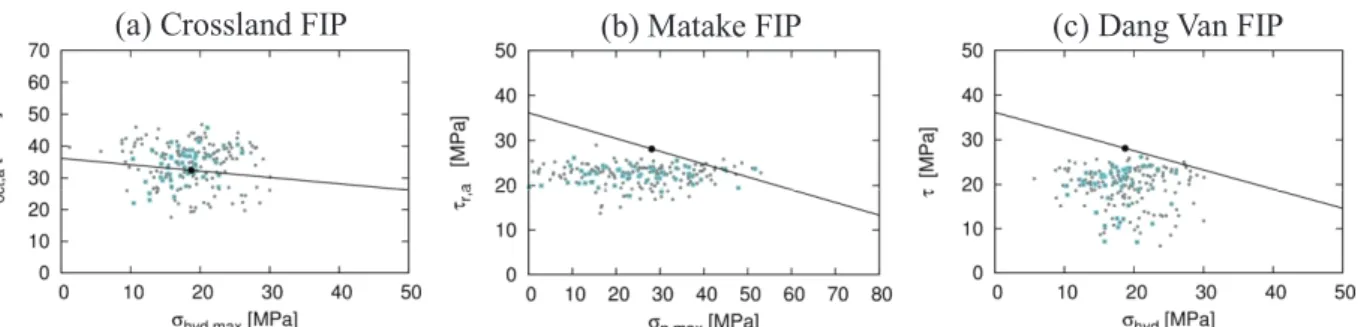
i are given in Table 2.A comparison between the mesoscopic FIPs predictions and the macroscopic (original) criteria is shown in Figure 2. This comparison shows the existence of grains at the surface (highlighted in light blue) or in the entire volume element from which the FIP exceeded the macroscopic threshold. The macroscopic threshold is not applicable at the grain scale. This is especially true for the Crossland criterion where most of the grains are above the threshold. For other criteria, only a small number of grains exceeded the macroscopic threshold. A statistical analysis of the microstructure-sensitivity of the different FIPs will be presented in the next section. This statistical analysis will determine a new mesoscopic threshold to take into account the microstructure heterogeneities.
Figure 2. Locus of the 200 FIPs at the grain length scale (gray dots), and macroscopic criterion (black dot) in the case of tension loading (R =−1). The FIPs corresponding to the surface grains are highlighted (in light
blue) and the black straight line is the experimental macroscopic threshold
4. Microstructure sensitivity
The HCF strength is related to the critical grain whose response leads to the maximum value of the FIP. These extreme values are located at the tails of the probability density functions of mesoscopic responses (see Figure 3) and are highly sensitive to the microstructure attributes. To study these critical grains, several statistical approaches are possible. The method selected for this work was based on the extreme value probability. This method involves the statistical analyze of the maximum values of the mesoscopic FIP, corresponding to the various studied volume element, by considering a single value for each aggregate.
Figure 3. Localization of the extreme values in the tails of the Dang Van FIP distribution
The extreme value database was constructed by identifying the maximum value of FIP for each statistical volume element (SVE). The number of SVEs was between 25 and 35: they were obtained by the combination of 7 random morphologies (Figure 4-(a)) and 5 isotropic textures (Figure 4-(b)). This sample size is sufficient to determine the extreme values distribution function. Indeed Przybyla showed that from a number of SVEs greater than 20, the difference between the empirical distribution and the experimental sample becomes negligible [3, 4]. The maximum value of FIP has been determined on the one hand from the FIP concerning all the grains of the SVE and on the other hand by separating only the surface grains of the aggregate.
(a) grain morphologies
MICRO 1 MICRO 2 MICRO 3 MICRO 4
MICRO 5 MICRO 6 MICRO 7
(b) grain orientations
Pole figure {100} Pole figure {110} Pole figure {111}
ORIEN 1 ORIEN 2 ORIEN 3 ORIEN 4 ORIEN 5
5. Generalized extreme values probability
Let us consider a random variable x with the distribution functionFX
( )
x . The n extreme realizations in n samples of the random variable can be defined as:(
n)
n X X X
Y =max 1, 2,..., (1)
The distribution function of Y is defined as: n
( )
y P(
Y y)
P(
X y X y X y)
FY n n
n ≡ ≤ = 1≤ , 2≤ ,..., ≤ (2)
According to the Fisher-Tippet theorem, if there exist two real normalizing sequences
( )
an n≥1,( )
bn n≥1and a non-degenerated distribution (not reduced to a point) G so that:(
a x b)
G( )
x F x a b Y P n n n n n n n→
+∞ → + = ≤ − (3)G is necessarily one of the three types of distributions: Fréchet, Weibull or Gumbel.
Jenkinson [13] combined the three limit distributions in a single parametric form called Generalized Extreme Value (GEV) distribution depending on a single parameter ξ:
( )
(
)
( )
(
− −)
= > + ∀ ≠ + − = − 0 exp exp 0 1 / , 0 1 exp 1ξ
ξ
ξ
ξ
ξ ξ si x x x si x x G (4)The
ξ
parameter is called extreme index. Its sign indicates the type of asymptotic distribution: Weibull (ξ
<0 ), Gumbel (ξ
=0) or Fréchet (ξ
>0). The variable(
Yn−bn)
an is called normalized maximum of the random variable x.The parameters an and bn are also called shapefactors of the distribution.
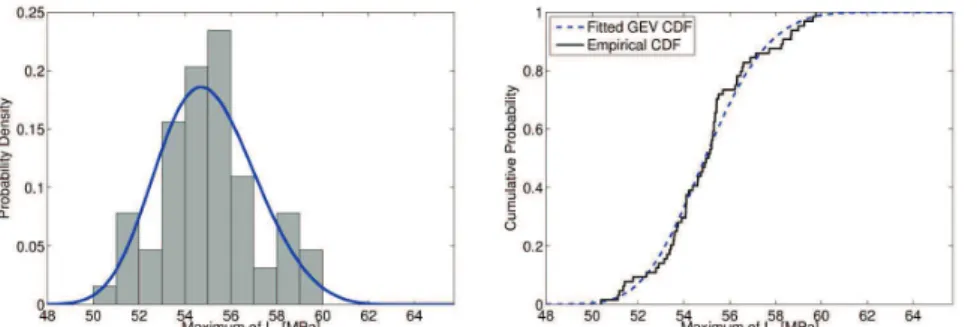
Figure 5. Probability density and cumulative probability determined using the maximum likelihood method from the extreme values of Crossland FIP for tensile loading (R =−1)
n
b ) and extreme index ξ are determined using the maximum likelihood method with a confidence interval of 99%. Figure 5 shows a comparison between the determined distributions and the samples for the Crossland FIP. The identified GEV density function and distribution function showed a good correlation with the probability density and the cumulative probability determined from the extreme values of FIPs database.
6. Results and discussions
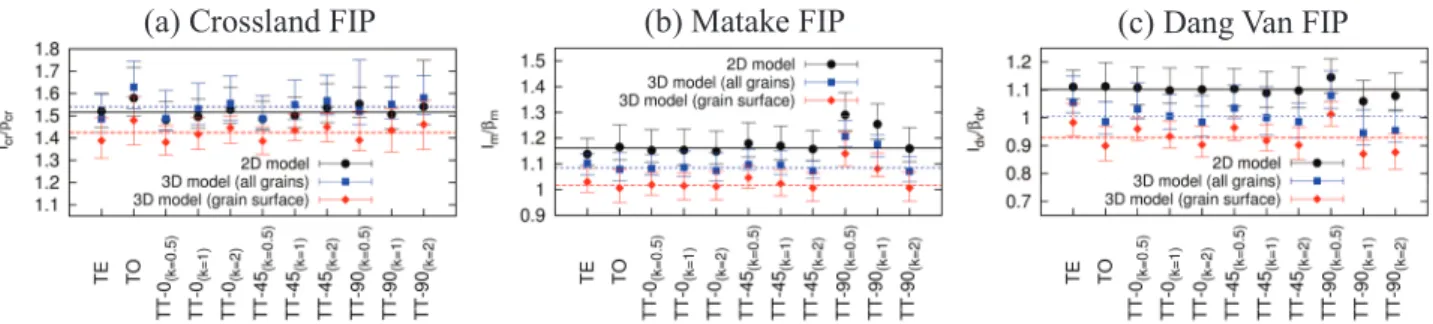
Figure 6 represents the mesoscopic thresholds (medians and also the values of 0.1 and 0.9 quantiles) for each loading condition. The mesoscopic thresholds are statistically determined from the FIPs at the grain scale considering the local stress state. This local stress state is computed by a finite element (FE) simulation. A comparison between the mesoscopic thresholds obtained by considering a 3D FE model (described above) and a 2D FE model [14] is presented in this figure.
The mesoscopic thresholds are normalized by the macroscopic threshold to analyze the effect of microstructure variability. Referring to figure 6, for all studied loading conditions and studied FIPs, the normalized mesoscopic thresholds were always larger than 1 in the case of the local stress state computed by 2D FE model [14]. When the local stress state is determined by a 3D model, the mesoscopic threshold determined from all aggregate grains decreases for Matake and Dang Van criteria, and increases slightly in the case of Crossland criterion. This threshold is higher for Crossland criterion and is close to 1 for Matake criterion and especially for Dang Van criterion. The mesoscopic threshold determined by considering only the surface grains becomes lower than the macroscopic threshold for Dang Van criterion. This is not valid for the other two criteria. This comparison highlights the ability of the Dang Van criterion to reflect the microstructural heterogeneities compared to the two other criteria.
On the other hand, the mesoscopic thresholds, defined as the medians of the extreme value distribution of the studied FIPs depend on the loading case. This gap depends on the studied FIP: it is low in the case of the Crossland and Dang Van FIPs (Figure 6-(a) and (c)) and important in the case of the Matake FIP (Figure 6-(b)). For this last FIP, the change in mesoscopic thresholds was observed especially for the biaxial loading with a phase shift of 90°. This difference can be justified by considering that the macroscopic loading levels applied to the polycrystalline aggregate were determined by reference to the Crossland criterion.
Figure 6. Evolution of the median (a probability of 0.50) of the extreme value distributions of (a) Crossland, (b) Matake and (c) Dang Van FIPs, as a function of loading conditions determined by 2D (in black), and 3D
(in blue and red) FE model. The two limits of the interval correspond to a probability of 0.10 and 0.90.
Finally, the mesoscopic threshold, common to all the loading cases was determined as the average of the thresholds associated to each loading conditions. This mesoscopic average threshold is shown in Figure 6 by the dashed horizontal lines passing through all intervals bounded by the values of 0.1 and 0.9 quantiles in the case of Crossland and Van Dang FIPs. For Matake FIP, this was also true except for the case of biaxial loadings with a phase shift of 90° due to the reasons mentioned above.
(a) Crossland (b) Matake (c) Dang Van
Figure 7. Predictions from (a) Crossland, (b) Matake and (c) Dang Van at the macroscopic length scale (black line) and the mesoscopic length scale considering all grains (gray dots) and surface grains (gray dots).
The mesoscopic threshold of different FIPs is the average (over the different loading conditions) of the medians of the extreme value distributions. Keeping the same value for the
α
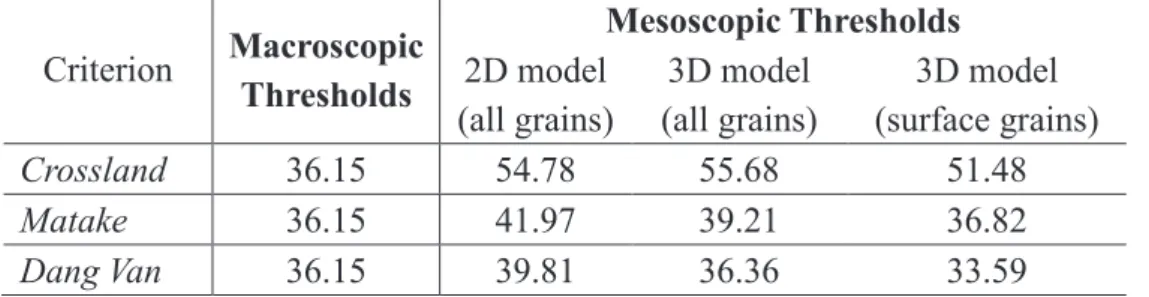
i parameter, the new criterion containing microstructural heterogeneities contribution at the mesoscopic length scale is plotted in Figure 7. This Figure illustrates for each criterion two mesoscopic thresholds : the first was determined from all the grains of the aggregate (red line) and the second was computed by considering only the surface grains. When the mesoscopic threshold is close to the macroscopic one (black line), the microstructure heterogeneities are taken into account by the original criterion. This is especially the case of Dang Van criterion, when the mesoscopic threshold determined for all the aggregate grains is equal to the macroscopic thresholds, and to a lesser extent the case of Matake criterion (Table 3). For the Crossland criterion, the distance between the two straight lines is important in the case of thresholds determined from all the grains and from the surface grains (table 3). This comparison proves that critical plane type approaches can capture the microstructure heterogeneity despite simplifying assumptions [11].Table 3. Values of macroscopic thresholds and mesoscopic thresholds obtained by 2D and 3D FE modeling
Criterion Macroscopic Thresholds Mesoscopic Thresholds 2D model (all grains) 3D model (all grains) 3D model (surface grains) Crossland 36.15 54.78 55.68 51.48 Matake 36.15 41.97 39.21 36.82 Dang Van 36.15 39.81 36.36 33.59
7. Conclusion
From polycrystalline modeling of pure copper coupled with a statistical study of the critical grains, we analyzed the mesoscopic responses of the multiaxial fatigue criteria, widely studied in the literature (Crossland, Matake and Dang Van). This statistical study allows us to introduce microstructural heterogeneities effect in the variability of the fatigue strength.
The comparison between the mesoscopic predictions of these criteria and the macroscopic (original) ones shows that they are not conservative at the grain scale. Indeed the identification of macroscopic parameters of these criteria (
α
i andβ
i) does not take into account the variability due to the microstructure. The solution would be to readjust these parameters on the most critical grain computed from FE calculations. These critical grains are located in the tails of the aggregate response distributions. One of the most used methods to statistically study these critical grains is the extreme value probability. The statistical moment’s determination of the different distributions allowed us to define a new mesoscopic threshold for the studied criteria.These thresholds are the average of the medians of the extreme value distributions related to the different loading conditions. These thresholds are different or similar to the macroscopic thresholds depending on the considered criterion. For Dang Van, the mesoscopic threshold is equal to the macroscopic value of the fatigue indicator parameter. At the opposite, for Crossland, the ratio between meso and macro thresholds is greater than 1.4. Matake criterion has a ratio of around 1.1. Finally, except for the biaxial loading with a phase shift of 90° where FIP median values are very different from one criterion to another, the mesoscopic thresholds is almost the same for all the loading conditions. Thus, these new mesoscopic thresholds can therefore be determined by applying a single loading case.
References
[1] H.V. Atkinson and G. Shi. Prog. in Mater. Sci., 48: 457-520, 2003. [2] M. Liao. Eng. Frac. Mech., 76: 668-680, 2009.
[3] C. P. Przybyla, R. Prasannavenkatesan, N. Salajegheh, and D. L. Mc-Dowell. Int. J. of Fatigue, 32(3): 512-525, 2010.
[4] C. P. Przybyla and D. L. McDowell. Int. J. of Plasticity, 26(3): 372-394, 2010. [5] L. Meric and G. Cailletaud. J. of Eng. Mater. and Tech., 113(1): 171-182, 1991.
[6] C. Gérard, F. N’Guyen, N. Osipov, G. Cailletaud, M. Bornert, and D. Caldemaison. Comput. Mater. Sci., 46(3): 755-760, 2009.
[7] C. Robert, N. Saintier, T. Palin-Luc, and F. Morel, Méca. et Indus., 209-214, 2011. [8] C. Robert, N. Saintier, T. Palin-Luc, and F. Morel, Mech. of Mater., 55: 112-129, 2012. [9] B. Crossland. Proceedings of the Inter.Conf. on Fatig. of Met., 138-149, London 1956. [10] T. Matake. Bulletin of the JSME, 141:257–263, 1977.
[11] K. Dang Van, B. Griveau, and O. Message. Mech. Eng. Publi. London, 479-496, 1989. [12] P. Lukás and L. Kunz. Int. J. of Fatigue, 11(1): 55-58, 1989.
[13] A.F. Jenkinson. Quaterly Journal of the Royal Meteorological Society, 81, 1955.
[14] A. Hor, N. Saintier, C. Robert, T. Palin-Luc and F. Morel, 19TH European Conference on Fracture (ECF19), kazan (Russia), 2012.