HAL Id: hal-02626097
https://hal.archives-ouvertes.fr/hal-02626097
Submitted on 26 May 2020
HAL is a multi-disciplinary open access
archive for the deposit and dissemination of sci-entific research documents, whether they are pub-lished or not. The documents may come from teaching and research institutions in France or abroad, or from public or private research centers.
L’archive ouverte pluridisciplinaire HAL, est destinée au dépôt et à la diffusion de documents scientifiques de niveau recherche, publiés ou non, émanant des établissements d’enseignement et de recherche français ou étrangers, des laboratoires publics ou privés.
Bioenergetic condition of anchovy and sardine in the
Bay of Biscay and English Channel
Paul Gatti, Louise Cominassi, Erwan Duhamel, Patrick Grellier, Herve Le
Delliou, Sophie Le Mestre, Pierre Petitgas, Manuella Rabiller, Jérôme Spitz,
Martin Huret
To cite this version:
Paul Gatti, Louise Cominassi, Erwan Duhamel, Patrick Grellier, Herve Le Delliou, et al.. Bioenergetic condition of anchovy and sardine in the Bay of Biscay and English Channel. Progress in Oceanography, Elsevier, 2018, 166, pp.129-138. �10.1016/j.pocean.2017.12.006�. �hal-02626097�
1
Please note that this is an author-produced PDF of an article accepted for publication following peer review. The definitive publisher-authenticated version is available on the publisher Web site.
Progress in Oceanography
September 2018, Volume 166, Pages 129-138 http://dx.doi.org/10.1016/j.pocean.2017.12.006 http://archimer.ifremer.fr/doc/00416/52754/ © 2017 Elsevier Ltd. All rights reserved.
Archimer
http://archimer.ifremer.fr
Bioenergetic condition of anchovy and sardine in the Bay of
Biscay and English Channel
Gatti Paul 1, *, Cominassi Louise 1, Duhamel Erwan 2, Grellier Patrick 3, Le Delliou Herve 4, Le Mestre Sophie 1, Petitgas Pierre 3, Rabiller Manuella 3, Spitz Jérôme 5, Huret Martin 1
1
Laboratoire de Biologie Halieutique, Unité de Sciences et Technologies Halieutiques, Centre Ifremer Bretagne, ZI de la Pointe du Diable – CS 10070, 29280 Plouzané, France
2
Laboratoire de Technologie et Biologie Halieutique, Unité de Sciences et Technologies Halieutiques, Station Ifremer de Lorient, 8 rue François Toullec, 56100 Lorient, France
3 Unité Écologie et Modèles pour l’Halieutique, Ifremer Nantes, Rue de l’Ile d’Yeu, BP 21105, 44300
Nantes Cedex 3, France
4
Laboratoire Adaptation, Reproduction et Nutrition de poissons, Unité Physiologie Fonctionnelle des Organismes Marins, Centre Ifremer Bretagne, ZI de la Pointe du Diable – CS 10070, 29280 Plouzané, France
5
Observatoire PELAGIS, UMS 3462, Université de La Rochelle/CNRS, 5 allées de l'Océan 17000 La Rochelle, France
* Corresponding author : Paul Gatti, email address : Paul.Gatti@ifremer.fr
Abstract :
There is a growing interest in monitoring body condition of marine organisms in the context of the ecosystem approach to fisheries and global change. Fish condition is under the influence of environmental variability on seasonal scale, but also on longer timescales. It represents a good indicator of habitat quality or individual fitness, and is also a relevant parameter to evaluate energy transfer through the trophic chain. However, the sources of variability in fish condition need to be accurately understood and the significance of existing indices has to be correctly assessed. Here, we measured the energy density, a precise and global indicator of fish bioenergetic condition, for anchovy (Engraulis
encrasicolus) and sardine (Sardina pilchardus) in the Bay of Biscay and the English Channel, based on
an extensive sampling design in 2014. First, we investigated the well-documented relationship between percent dry mass and energy density, and showed that such relationship is species specific. Second, we observed distinct patterns in bioenergetic condition between anchovy and sardine. Both species display similar minimum values at size or age but maximum are significantly higher for sardine, reflecting a higher energy storage capacity that scales more strongly with size. Third, we confirmed the large seasonal variability in energy density of both species. In the Bay of Biscay, energy density values for anchovy and sardine (age 1+) are 5.7 and 5.9 kJ.g-1 (wet weight) in spring and 6.8 and 7.9 kJ.g-1 in autumn, respectively. Our results revealed that fish from the English Channel display significantly higher energy density values in autumn (9.8 kJ.g-1 for anchovy and 10.5 kJ.g-1 for sardine) than those from the Bay of Biscay. When combined with size and weight at age it appears clearly that, after age 1, fish from the northern region display larger growth and energy reserves. This likely results from a higher zooplankton productivity in the English Channel or/and a selection pressure towards faster growing and faster reserve building individuals, to be able to survive a longer winter than in the Bay of Biscay.
2
Please note that this is an author-produced PDF of an article accepted for publication following peer review. The definitive publisher-authenticated version is available on the publisher Web site.
Finally, we described a dome shaped evolution of energy density with body size in case of sardine. Increase with size has been well documented but not the decrease at largest sizes. Several mechanisms may explain such a pattern, i.e. increasing investment in spawning, shift in diet or a metabolic trade-off between temperature and food availability, with regard to maintenance requirements.
Highlights
► Exploration of energy density sources of variability: species, season, region, size. ► Relationships between dry mass content and ED are strong but species specific. ► Larger length, mass and ED at age in the English Channel than in the Bay of Biscay. ► Sardine display larger energy reserves than anchovy. ► Larger reserves are likely in link with larger spawning or maintenance costs. ► A strong scaling of ED with size with a dome shape pattern for sardine. ► Decrease of ED with size is discussed in link with feeding and spawning behaviours.
Keywords : Energy density, calorimetry, small pelagic fish, Engraulis encrasicolus, Sardina pilchardus,
than in the Bay of Biscay. Finally, we described a dome shaped evolution of energy density with body size in case of sardine. Increase with size has been well documented but not the decrease at largest sizes. Several mechanisms may explain such a pattern, i.e. increasing investment in spawning, shift in diet or a metabolic trade-off between temperature and food availability, with regard to maintenance requirements.
Keywords: Energy density, calorimetry, small pelagic fish, Engraulis encrasicolus, Sardina
pilchardus, Northeast Atlantic
1. Introduction
Fish condition is increasingly assessed in the context of fisheries and stock assessments as an indicator of the state of fish stocks in addition to biomass indices (Brosset et al., 2015b; Hartman and Brandt, 1995; McPherson et al., 2010; Rosa et al., 2010; Spitz and Jouma’a, 2013; Van der Lingen and Hutchings, 2005). Condition indices have displayed significant relationships with total egg production (Marshall et al., 1999) or even recruitment (Boyd et al., 1998; Marshall et al., 2000; Marshall and Frank, 1999).
There are numerous ways to assess the condition of fish. Morphological condition indices, such as the Fulton index, are the most widespread as they can easily be implemented from size at age data (McPherson et al., 2010), but more precise indicators based on qualitative (Van der Lingen and Hutchings, 2005) or quantitative assessment of lipid content (Brosset et al., 2015a) are also increasingly applied, especially for small pelagic fish. Condition indices are often defined as a measure of stored energy (McPherson et al., 2010). McPherson et al. (2010) argued that condition indices should be well defined and validated before using them to monitor fish condition, as some are “only surrogates of physiological status”. Fish proximate composition is based mainly on water, protein, lipid and ash content (Elliott, 1976).
Energy density (ED) is the amount of energy per unit of mass. As ash and water have null energetic potential, ED measured on the whole body mass is simply a weighted average of protein and lipid energy densities. Lipid is the storage compound for fish (Black and Love, 1986; Cargnelli and Gross, 1997) and the main driver of fish ED variability (Anthony et al., 2000; Rosa et al., 2010; Spitz et al., 2010), while proteins are the main compound of body structure thus defining the basal value of ED. The effects of numerous factors affecting ED as a bioenergetic index have been reported, e.g. species, season, area, food availability, spawning phenology, size or ontogeny (Anthony et al., 2000; Pedersen and Hislop, 2001; Rosa et al., 2010; Spitz and Jouma’a, 2013). Thus, the whole body ED is a proper assessment of the amount of energy reserves and integrates daily to seasonal time scale processes as a balance between energetic expenses and gains from food.
Small pelagic fish, as forage fish species, play a key role in energy transfer (Cury et al., 2000; Spitz et al., 2017). Thus, monitoring small pelagic fish condition provides highly relevant information on the state of the whole pelagic ecosystem, as this reflects their own fitness in relation with prey availability or habitat quality, as well as their own quality as prey for numerous predators from larger fishes up to marine birds and mammals (Anthony et al., 2000; Payne et al., 1999; Rand et al., 1994; Spitz and Jouma’a, 2013). Indeed, predators are known to be sensitive to the species composition of the available preys with respect to prey quality (Österblom et al., 2008; Spitz et al., 2012; Trites and Donnelly, 2003). Similarly, anchovy and sardine prey on a variety of zooplankton organisms which “cannot be considered as a homogeneous resource in terms of quality” (Dessier et al., 2017). The energetic content of zooplankton is also very variable among species, size class, area and season (Barroeta et al., 2017; Dessier et al., 2017). Energetic condition indices such as ED are also of large interest for bioenergetic modelling (Gatti et al., 2017; Hartman and Brandt, 1995; Pecquerie et al., 2009) and for food web modelling (Albo-Puigserver et al., 2017). Furthermore, small pelagic
fish condition, e.g. lipid content, is routinely monitored as a parameter of particular interest for human consumption (Albrecht-Ruiz and Salas-Maldonado, 2015; Hale, 1984; Marin et al., 2010; Simat and Bogdanovic, 2012) and fish meal production.
In the Bay of Biscay, small schooling energy-rich fish such as anchovy and sardine are the key resources for a variety of predators (Spitz et al., 2017). In the Bay of Biscay and in the English Channel, anchovy and sardine fisheries have displayed large interannual fluctuations over the last three decades. Sardine landings in the Bay of Biscay are increasing since 2000 and reached 28216 tons in 2015 (ICES, 2016). The anchovy stock recovered in 2010, after a collapse in 2005 (ICES, 2012), and landings reached 28253 tons in 2015 (ICES, 2016). Anchovy landings in the English Channel remained under 25 tons per year between 1984 and 1996 but increased between 1997 and 2013 and reached 1754 tons in 2015 (ICES, 2016). Sardine landings in the subarea VII, are mainly achieved in the English Channel or close to it (ICES Subareas VIId, e and f) and reached 9314 tons in 2015 (ICES, 2016).
In the Bay of Biscay, ED of small pelagic fish, and in particular anchovy and sardine, has already been partially assessed. Dubreuil and Petitgas (2009) described variations of ED of anchovy with size class and season, and explored the relationship between ED and dry mass content. Spitz and Jouma’a (2013) studied variation in ED in the guild of small pelagic species observed in the Bay of Biscay and also showed effects of size class and season. As far as we know, there are no data on ED for anchovy and sardine in the English Channel. In this paper, we aim at updating previous studies and to investigate further the sources of variability in ED. Based on a large sampling effort in 2014 over the Bay of Biscay - English Channel area and subsequent ED measurements on numerous individual samples, we propose to analyse the effect of species, size, age, season and region for anchovy and sardine.
2. Material and methods
2.1 Sampling design
Juveniles and adults of anchovy and sardine were caught in 2014 during three fishery surveys, namely PELGAS (Doray et al., 2014) and EVHOE (Duhamel et al., 2014) in the Bay of Biscay and CAMANOC (Travers-Trolet and Verin, 2014) in the English Channel. PELGAS (April 24th to June 5th) and EVHOE (October 17th to November 16th) are designed for the assessment of small pelagic species in spring and of demersal species in autumn, respectively. CAMANOC (September 16th to October 10th) was designed to assess demersal species in the English Channel ecosystem. Fish were caught using a pelagic trawl during PELGAS and bottom trawl during CAMANOC and EVHOE, but the latter surveys still provided samples opportunistically in most of the size ranges of both species. There is no survey in spring in the English Channel. The abundance and spatial distribution of anchovy and sardine in the English Channel in spring remain poorly known. Together, these three surveys provided samples from two regions and two contrasted seasons for the Bay of Biscay. Contrasted fish conditions are anticipated between spring that follows winter with low temperature and food availability, and autumn that follows a warm and productive period. A total of 164 anchovies and 209 sardine samples from 2014 were processed (Table 1). The onboard sampling was opportunistic and driven by the availability of the two targeted species, as well as the occurrence of wide ranges of fish size in each trawl haul. Sampling locations covered most of the areas and were representative of spatial distributions of these species (Figure 1).
Table 1. Sampling design: survey, area, season, number of samples and sampled size ranges in brackets (cm)
Survey Area Season - Months Anchovy Sardine
PELGAS Bay of Biscay Spring
April -June
77 (9.0-18.0)
81 (12.0-24.0)
EVHOE Bay of Biscay Autumn
October-November
59 (7.0-17)
60 (8.5-23.5)
CAMANOC English Channel Autumn (early)
September-October 28 (8.5-18.5) 68 (8.0-25.0) Total 164 209
Figure 1. Sampling locations in the Bay of Biscay and English Channel, for anchovy (left) and sardine (right) and for surveys PELGAS (circle), CAMANOC (cross) and EVHOE (triangle).
2.2 Sample processing
ED, i.e. the amount of energy per unit mass, was measured following the protocols of Dubreuil and Petitgas (2009) and Spitz and Jouma’a (2013). Fish length and wet weight were
recorded to the nearest 0.5 cm and 1 g, respectively, on board or latter in laboratory. Fish were then individually frozen (-20°C) until lab processing. The time lag between sampling and freezing did not exceed half an hour. In the laboratory, fish were unfrozen and otoliths extracted for latter age reading (in years) by experienced readers, following the ICES guidelines (ICES, 2011, 2009). In order to avoid water loss during sample processing and thus ensure accurate estimation of water content the abdominal cavity was not opened; which prevented any macroscopic determination of sex or sexual maturity. The whole fish was then grinded and freeze-dried during more than 48 hours. Dry mass was recorded. The dry mass content (DM %) was computed simply as the ratio between dry and wet masses. Fish were again grinded to obtain a fine homogeneous dry powder. Two subsamples of fish powder were placed in an adiabatic bomb calorimeter (IKA C-4000 adiabatic bomb calorimeter, IKA-WerkeGmbh & Co. KG) for energy measurements. If the coefficient of variation between the two measurements exceeded 3%, a third measurement was made and finally a mean among the several subsamples was calculated and assigned to each individual fish.
2.3 Statistical Analysis
We first explored the well documented relationship between ED and DM, initially introduced by Hartman and Brandt (1995) but also more recently analysed in the Adriatic Sea for anchovy by Tirelli et al. (2006). Regressions were fitted with linear and log-log models. A posteriori test showed that residuals were normally distributed (not shown). Covariance analysis (ANCOVA) was used to determine whether the relationship between DM and ED differs among anchovy and sardine. In case of linear regressions, we also compared coefficients estimates for clupeiform species from Hartman and Brandt (1995) with our estimates. For anchovy, we compared coefficient estimates between our linear model and the model published by Tirelli et al. (2006) for the Adriatic Sea using Student tests. Distributions of linear regression coefficients were built by randomly drawing estimates 10.000 times in
normal distributions parameterised following mean and standard deviation estimates (of linear regression coefficients). Resulting distributions were then compared to the values extracted from the literature using the Student test. In the present study a p-value threshold of 5% was considered to be significant to reject the null hypothesis.
ED and more generally condition is known to be influenced by a variety of factors, e.g. species, season, area, size or ontogeny. We thus described qualitatively the growth patterns (in both size and wet weight) and the evolution of ED with age observed for anchovy and sardine during our three surveys. We then analysed the pattern of ED with size using quantitative tools by the mean of generalised additive models (GAM) using the R library
mgcv (Wood, 2011). Instead of age, which was not integrated in the model due to the scarcity
of oldest fishes in our samples (see Figure 3) and the strong relationship between size and age, we considered the size. An analysis of model residuals did not demonstrate any age effect (not shown). The factorial design is not complete, but provides a description at two seasons in the Bay of Biscay, i.e. spring and autumn, and in early autumn in the English Channel. To account for the effects of region and season we thus considered the survey. The combined effect of size and survey was introduced in the GAM models fitted for each species. Analysis of residual distribution demonstrated that data were normally distributed (not shown). As each survey corresponds to a specific combination of season and area, we expected a specific evolution of ED with size according to the survey. The following equation: , in R computing language, describes the structure of the model. The first effect is the average ED value ( ) for each survey on the whole size range. The second effect, i.e. , is the smoothed survey specific variation of ED with size around the previous average (i.e. the first effect in the model). The GAM model was thus built to integrate the factor survey and the effect of length smoothed by each modality of survey. This first set of models enabled to describe the
scaling of ED with size for each species. To further compare this specific scaling of ED for anchovy and sardine, we considered in a second set of models a “standardised length” instead of total length to filter out the effect of the specific growth patterns. This standardised length is simply the ratio between the total length and the 95% upper quantiles of total length distributions for each species, i.e. 17.0 and 23.0 cm for anchovy and sardine, respectively.
3. Results
3.1 Energy density against dry mass content
Energy density (ED) increases with dry mass content (DM) for both species (Fig. 2), and more sharply in the case of sardine. Linear and log-log regressions were fitted to describe the relationship between DM and ED. According to ANCOVA analysis, considering a specific intercept for each species significantly improved (at a 5% threshold) the fit of the relationship in comparison with a common intercept for both species (df = 1, F = 22.56 and 22.81 for linear and log-log models, respectively). A specific slope also improved significantly the fit of the relationship (df = 1, F = 53.11 and 18.18). Intercepts and slopes in linear and log-log relationship between ED and DM are thus specific for each species. In case of ANCOVA tests for linear regressions, R² were 0.922, 0.927 and 0.936 for common intercept and slope, specific intercepts and common slope, and specific intercepts and slopes models, respectively. In case of log-log regressions, R² were 0.930, 0.934 and 0.937 for common intercept and slope, specific intercepts and common slope, and specific intercepts and slopes models, respectively.
Figure 2. Energy density (kJ.g-1 wet mass) against dry mass content (the ratio of wet and dry masses in %). Data, linear ( ) and log-log ( .) model predictions are plotted with crosses, continuous and dotted lines, respectively. The linear model of Tirelli et al. (2006) fitted for Adriatic anchovy is represented by a continuous grey line (left plot).
All coefficients are significant (Table 2). R2 are high, ranging from 0.89 to 0.94, and even higher for sardine. Student tests were used to compare coefficients of the linear model from Hartman and Brandt (1995) ( ), showing significant differences for both intercepts (df = 9999, t = 343.01 and 1475.04 for anchovy and sardine, respectively) and slopes (df = 9999, t = 52.13 and 1343.49). Student tests were also used to compare coefficients of the linear model for anchovy from the present study and those from Tirelli et al. (2006) ( , and showed significant differences for both intercept (df = 9999, t = 33.80) and slope (df = 9999, t = 136.34). Sardine displays a steeper
slope (Table 2) than anchovy, meaning that for the same increase of DM the gain of energy per unit mass is slightly higher for sardine (see Figure 2).
Table 2. Coefficients of regression models between energy density (kJ.g-1 wet mass) and dry mass content (i.e. the ratio between dry and wet masses %).
Species Nb R2 Coef. Estimates Std. error
Linear Anchovy 164 0.894 intercept -3.403 0.254 slope 0.333 0.009 Sardine 209 0.940 intercept -5.85 0.226 slope 0.428 0.008 Log-log Anchovy 164 0.907 intercept -3.302 0.127 slope 1.523 0.038 Sardine 209 0.942 intercept -3.995 0.101 slope 1.740 0.030
3.2 Variation of length, weight and energy density with age
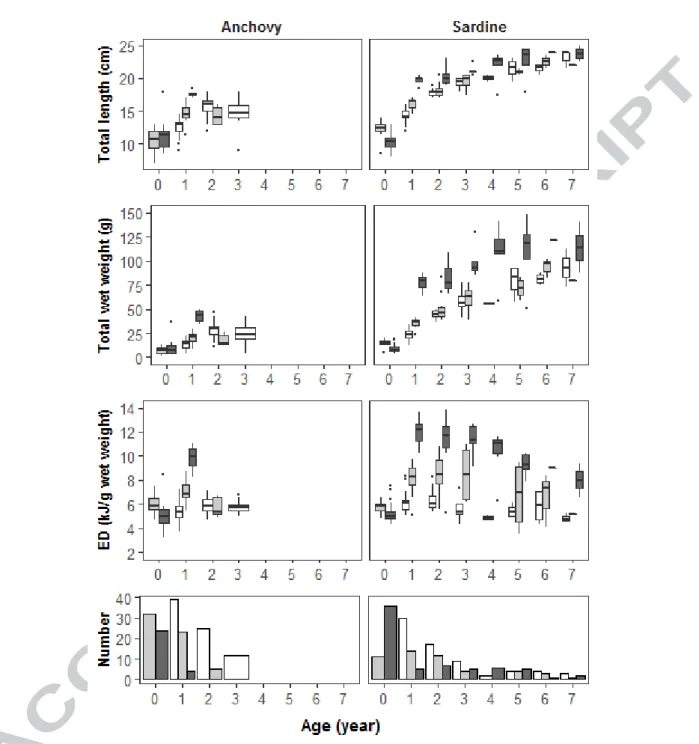
The evolution of size, wet weight and ED with age is presented in Fig. 3. Sardines from the English Channel are larger than those from the Bay of Biscay from age 1. Anchovies from the English Channel are larger than those from the Bay of Biscay only at age 1. For both species in the Bay of Biscay, individuals display distinct sizes between spring and autumn only at age 1. Patterns in wet weight are very similar to patterns observed in total length.
For sardine, ED values observed in autumn in the English Channel are consistently higher than in the Bay of Biscay for both seasons, except at age 0 which is likely related to smaller sizes in the English Channel at that age. The pattern are the same for anchovy at age 0 and 1, and we lack older individuals from the Channel in the dataset to conclude on older ages. When considering sardine in the Bay of Biscay, ED values are higher in autumn than in spring from age 1. Whatever the season, sardine average ED values show an increase until ages 2 or 3 and a regular decrease later on. This latter pattern is maybe less clear in the Bay of
Biscay in spring, and should be considered with caution due to the scarcity of oldest ages in the dataset.
Finally, for age 1 and 2 sardine displays higher ED values in autumn than anchovy, both in the Bay of Biscay and in the English Channel, but similar values in spring in the Bay of Biscay.
Figure 3. Variation of length (first panel from top), wet weight (second panel) and energy density (in wet weight, third panel) at age, of anchovy (left) and sardine (right) observed in the Bay of Biscay in spring (survey PELGAS, white), in the Bay of Biscay in autumn (survey EVHOE, lightgrey) and in the English Channel in autumn (survey CAMANOC, darkgrey). The boxplots display the percentiles 5 and 95% (end of vertical lines), 25 and 75% percentiles (bottom and top side of the box) and finally the median (bold central line). The fourth and last panel displays the number of samples by combination of species, survey and age.
3.3 Evolution of energy density with length, area and season
Figures 4 and 5 display the evolution of ED with total length observed during each survey for anchovy and sardine, respectively. For both species in the Bay of Biscay, whatever the fish size, ED values are lower in spring than in autumn. Also, interestingly the range values in autumn is higher than in spring, minimum values in autumn being close to averaged values in spring for both species. In autumn in the Bay of Biscay, sardine ED values are lower than in the English Channel.
Figure 4. Observed and predicted ED values by the GAM against total length for anchovy. The top left panel displays all data and fit per survey (combined modality of season and
area). Data and fitted values for the Bay of Biscay in spring (circle), the Bay of Biscay in autumn (triangle) and the English Channel in autumn (cross). Other panels display the model fit for each combination, with average predictions (continuous lines) and average +/- 2 standard errors of the fit (dashed lines).
Figure 5. Observed and predicted ED values by the GAM against total length for sardine. The top left panel displays all data and fit per survey. Data and fitted values for the Bay of Biscay in spring (circle), the Bay of Biscay in autumn (triangle) and the English Channel in autumn (cross). Other panels display the model fit for each combination, with average predictions (continuous lines) and average +/- 2 standard errors of the fit (dashed lines), as well as model predictions for anchovy (grey lines).
To quantitatively describe the evolution of ED with size according to species and season GAM models were fitted and model predictions are displayed on Figure 4 and 5. The
explained variance by generalised additive models are 0.64 and 0.71 for anchovy and sardine, respectively (Table 3). Most effects are highly significant, apart from the length effect for sardine in spring in the Bay of Biscay. Estimates confirm previous observations that ED is higher on average for sardine than anchovy for each combination of area and season, i.e. by 0.6, 1.3 and 4.4 kJ.g-1 for the Bay of Biscay in spring, in autumn and in the English Channel in autumn, respectively (see Table 3). In the Bay of Biscay the seasonal difference in ED is 1.5 and 2.1 kJ.g-1 for anchovy and sardine, respectively. Lower ED estimates for anchovy in the English Channel than in the Bay of Biscay are likely due to the length distribution of samples from the English Channel, mostly representatives of the smaller sizes.
Table 3. GAM summaries: estimates, associated standard errors and significance (p-value). BoB, EC, Sp and Au refer to Bay of Biscay, English Channel, Spring and Autumn, respectively.
Anchovy Sardine
Effect Estimate Std. error P-value Estimate Std. error P-value
Average effects
BoB.Sp 20.46 0.15 <2.2e-16 21.05 0.27 <2.2e-16
BoB.Au 21.94 0.15 <2.2e-16 23.20 0.28 <2.2e-16
EC.Au 21.21 0.24 <2.2e-16 25.65 0.41 <2.2e-16
Smoothed length effects
BoB.Sp 4.98e-3 0.47
BoB.Au 2.73e-11 4.94.e-11
EC.Au <2.2e-11 <2.2e-16
R2 0.636 0.709 Number of samples BoB.Sp 77 81 BoB.Au 59 60 EC.Au 28 68
For anchovy in the Bay of Biscay, according to GAM predictions, ED increases up to approximately 15-16 cm in total length for both season and then seems to stabilise (Figure 4). In the English Channel, with the lack of anchovy in the size range 14-17 cm, only a steep increase in ED with length can be described. For sardine in autumn ED increases with size up to 18 and 19 cm for the Bay of Biscay and the English Channel, respectively, then decreases
strongly (Figure 5). For sardine in spring in the Bay of Biscay we still observe two phases, a first increase followed by a decrease, although the pattern is very flat and the effect of size is not significant at that season. In spring in the Bay of Biscay (Figure 5), both species display very similar values on a common size range, i.e. between 12 and 18 cm. In autumn, predicted values for the smallest sizes are also very close but diverge strongly as size increases.
The second set of GAM models including the “standardised length” instead of the total length displays the same pattern of significance and the same values for the categorical (i.e. survey) effects (not shown). Data and model fits are displayed on Figure 6. The standardised length being the ratio between total length and the 95% upper quantile of the total length distribution of each species, this explains the occurrence of values slightly exceeding 1 for this metric. The standardised length translates the fraction of growth achieved by one individual. As expected, the patterns are really similar to those observed with the previous set of GAM models, e.g. the dome shaped increase of ED for sardine in autumn or the increase until a threshold for anchovy in the Bay of Biscay (in both spring and autumn). In addition, this representation highlights that for autumn surveys sardine displays higher ED values than anchovy at the same standardised length and also reaches its maximal ED potential earlier with respect to its “maximum size”.
Figure 6. Observed and predicted ED values by the GAM against standardised length for anchovy (grey crosses and grey lines) and sardine (black circles and black lines). Data and fits for the Bay of Biscay in spring, the Bay of Biscay in autumn and the English Channel in autumn are plotted on the first, second and third panel respectively. Model fits for each combination are displayed by average predictions (continuous lines) and average +/- 2 standard errors of the fit (dashed lines).
4. Discussion
Our results quantify how different factors affect the energetic condition of anchovy and sardine, obviously species and season but also region and body size, the latter in a surprisingly non monotonic allometric way as highlighted for sardine. A large number of samples were processed to draw these results. All samples have been caught in 2014, thus an extended dataset over more years would be required to further support observed patterns and refine analysis. However, the dataset containing fish individuals over a large range of size and age, up to 8 annual cohorts for sardine, this is unlikely that the main patterns described here would disagree with observations from an extended dataset.
4.1 Energy density against dry mass content
The linear and log-log relationships between energy density (ED) and percent dry mass content (DM) displayed strong fit, i.e. with R2 values being consistently above 0.89. These relationships are generally strong for numerous species (Hartman and Brandt, 1995). These authors showed that even gathering numerous species in a single relationship can still lead to a strong fit in case of a log-log model. This is likely due to the effect of size which would override interspecific differences when gathering wide body size ranges across numerous species. But the coefficient estimates from our study, in case of linear models, displayed significant differences with previous works from Hartman and Brandt (1995). In addition, as we found distinct relationships between both related species through linear and log-log models, we argue that this relationship is very strong but should remain species specific.
In the case of anchovy we obtained a different relationship from that of Tirelli et al. (2006), which suggests that such model are species specific but also area specific. But this has to be confirmed with an extended dataset, i.e. with more years, and is likely to be drawn from distinct length and ED ranges in both datasets.
We explored the relationship between ED and DM with both linear and log-log models, which provided similar fits. Wuenschel et al (2006) suggested that linear relationships between ED (or lipid) and DM are strongly affected by ontogeny and should be stage specific. Zenitani and Kono (2012) also described an exponential allometry between lipid content (both phospholipids and triglycerides) and body size for sardine larvae from Eastern Japan. Log-log shape would allow the description of an exponentially increasing pattern (of lipid content per unit of mass) and thus could better deal with an increase in ED with body size and ontogenetic effects occurring between larvae, juveniles and fully grown adults. Log-log models should thus be preferred, as highlighted by slightly better fits.
4.2 Species and season
Clupeiform are among the most energy rich forage fish species in the Bay of Biscay, among this family sardine displays the highest ED values and variability (Spitz and Jouma’a, 2013). Spitz and Jouma’a (2013) reported that ED is on average equal to 5.5 and 5.8 kJ.g-1
wet weight in spring and to 6.4 and 8.8 kJ.g-1 in autumn, for anchovy and sardine, respectively. Our results are in agreement with these values. Rosa et al. (2010) showed that ED of sardine off Portugal displays a minimum in March/April and a peak in September/October. Spring and autumn ED thus exhibit minimum and maximum seasonal values for these species. Despite of a potential lag in the seasonal cycle of plankton productivity and temperature between the English Channel, the Bay of Biscay and Portugal, as well as mesoscale processes affecting the local productivity, we also likely captured these extreme values, or were close to them, according to our sampling design in our temperate regions.
GAM models highlighted similar minima of energetic condition for both species. Rosa et al. (2010) showed that for sardine, minima in ED values in February/March were consistent across years irrespectively of previous energetic or environmental conditions. Considering
that in spring anchovy and sardine display similar minima of absolute ED values, both species thus emerge from overwintering with a similar low or basal energetic condition after exhaustion of the lipid reserves.
Our results evidenced species specific effects on ED, with higher seasonal variations and steeper increase with both body size and DM in the case of sardine. This first suggests a higher storage capacity for sardine, i.e. it is able to store more energy (i.e. more lipid) per unit of mass. The second set of GAM models also suggests that ontogenetic scaling of storage capacity is faster in the case of sardine. The larger seasonaldifference and variability in ED could also indicate larger energetic expenses between autumn and the following winter. The seasonal variability in bioenergetic condition is resulting from a combination of the seasonal cycle in plankton productivity (food availability) and of the spawning phenology (Pedersen and Hislop, 2001; Rosa et al., 2010). Anchovy is known to spawn in spring/summer in the Bay of Biscay (Huret et al., 2017; Motos, 1996) whereas sardine is expected to spawn in autumn and end of winter - spring with a limited spawning activity in winter (Coombs et al., 2006; Stratoudakis et al., 2007). Sardine is thus likely to cumulate more energy during productive months (from spring to autumn) allowing larger spawning expenses over the autumn to spring season. Also, as a larger and heavier fish than anchovy, sardine is likely to face larger maintenance costs, thus requiring larger reserves to overwinter. In addition to specific energetic expenses, distinct assimilation efficiencies or diet could lead to distinct energetic conditions (which is further discussed in the last section hereafter).
4.3 Region
In autumn, except at age 0, fishes from the English Channel display larger length and wet weight at age than fishes from the Bay of Biscay. Smaller sizes at age 0 likely result from differences in birth dates and survey timing, collected juveniles in the English Channel being
younger. This regional difference is less obvious for anchovy as the dataset contains only few old specimens given its very short lifespan.
Larger length, wet weight and ED at age could be due to a higher zooplankton productivity or more generally more favourable environmental conditions in the English Channel. Silva et al. (2008) showed a decrease in sardine growth pattern from the English Channel to Morocco following a latitudinal trend in temperature and zooplankton productivity. Populations at northern latitudes generally display larger growth performance, which can be explained by size related overwintering survival of juveniles involving a strong selection pressure toward faster growing individuals (Conover, 1992; Conover and Present, 1990). Larger individuals of a species are expected to better endure winter starvation as they display larger energy reserve (Cargnelli and Gross, 1997). Silva et al. (2006) displayed a similar pattern in length at first maturity of sardine across the Atlantic European coast with minimal length at maturity increasing with latitude starting from 11.0 cm in the South of Portugal until 14.5 cm in the north of the Bay of Biscay (France). This could be a consequence of the latitudinal growth pattern or could also highlight a delayed spawning onset. Delayed spawning could favour energetic allocation in growth to quickly reach larger sizes and sufficient energy storage capacity to overwinter. Moreover in the case of sardine, Coombs et al. (2006) and Stratoudakis et al. (2007) described a latitudinal gradient of spawning phenology in European waters associated with the temperature gradient. As the seasonal cycle of sardine ED is largely driven by spawning expenses (Rosa et al., 2010), the ED differences between the Bay of Biscay and the English Channel in autumn could partly result from distinct spawning periods.
Instead of regional differences in growth patterns, a size related migration to the North was hypothesised by Furnestin (1943) and Silva et al. (2008) in the case of sardine, based on the decrease in abundance of young and small individual with latitude. However we did catch and
analyse juveniles of sardine and anchovy in the English Channel (age 0) below 10 cm in length, most of them in coastal western areas or in the Bay of Seine to the east. It seems unlikely that such small fishes actively migrated from the Bay of Biscay. Also, in a pluridisciplinary study, Petitgas et al. (2012) showed that the English Channel was likely sharing a same population within the North Sea, rather than with the Bay of Biscay. We still lack reliable information to conclude on any population structure between the Bay of Biscay and the English Channel for both species, but we expect that distinct environments (both temperature and zooplankton abundance and phenology) may lead to distinct growth, spawning and bioenergetic strategies.
4.4 Size and age
Effects of age and size are strongly and naturally interlinked through growth. Our data displayed very similar patterns of ED with both size and age. Moreover, the analysis of GAM residuals did not reveal any effect of age (not shown), suggesting the absence of cohort effect in our dataset. We showed that energetic condition of sardine, in both the Bay of Biscay and the English Channel, strongly increased between age 0 and 1, then reached an optimum between age 2 or 3 and finally decreased thereafter. Results of Brosset et al. (2015b) highlighted a similar pattern for these species in the Gulf of Lion with a the relative condition index. These authors also argued that this decrease in condition at oldest ages is more dramatic in years of unfavourable environmental condition, in particular food availability or quality.
The effect of size on ED has been reported for many fish species (Anthony et al., 2000), energy reserves being positively correlated with size (Cargnelli and Gross, 1997). Pedersen and Hislop (2001) noticed that the effect of size is not always linear. Tirelli et al. (2006) described, for anchovy in the Adriatic Sea, a linear relationship between ED and size until 9.0
cm and a more variable pattern for larger sizes. Indeed, in our cases this effect is not a simple allometric relationship as ED first shows an increase with size until an optima for both species and then a steep decrease in the case of sardine. The increase in ED for juveniles and young adults is likely due to a relative decrease in water content and a concurrent increase of energy reserves, i.e. lipid content (Wuenschel et al., 2006).
The decrease in energetic condition for large and old fish seems a bit counter intuitive as one could expect an asymptotic trend similar to a Von Bertalanffy model. This pattern can be attributed to some decrease in energy acquisition or increase in energetic expenses, or a combination of both. Decrease in energetic gain could be either attributed to some change in diet or to a decrease in digestion or assimilation efficiency, while an increase in energetic expenses could be related to an increase in metabolic rate (e.g. respiration or cellular maintenance) or energy allocation to reproduction.
Anchovy and sardine are planktivorous species feeding mainly on copepods (Bachiller and Irigoien, 2015; Plounevez and Champalbert, 1999). Bode et al. (2003) showed that the sardine diet in Northern Spain greater than 18 cm progressively shifts to smaller prey items, both smaller zooplankton organisms and phytoplankton cells, as a result of an increased filter feeding mode. Smaller zooplankton items are likely to be less energy rich and especially phytoplankton cells, which are generally described to poorly contribute as a carbon input in the diet of sardine (Costalago et al., 2014; Nikolioudakis et al., 2012). Our results showed optimum values in ED around this size for the Bay of Biscay and at a slightly larger size for the English Channel, i.e. around 19 cm. Also, these slight differences in optimal size for energetic condition could be related to the latitudinal growth pattern described by Silva et al. (2008), who showed that sardine from the English Channel have a greater length at age of 2 cm than fish from the Portugal or Northern Spain.
The largest energetic expenses for fish are generally described as maintenance (Kooijman, 2013) and spawning (Jørgensen et al., 2016; McBride et al., 2015), two processes highly correlated with size. Rosa et al (2010) showed that the seasonal cycle of sardine ED is largely driven by spawning expenses. Larger fish are expected to invest more in spawning as they display wider period of active spawning (Nunes et al., 2011), thus energetic investment in spawning is likely to significantly scale with length. As sardine spawns in both spring and autumn, lower autumnal ED values for larger individuals could thus be attributed to an earlier start of “autumn spawning”, leading to an earlier decrease of energy reserves, or a later recovery of reserves associated to the previous “spring spawning”.
We previously discussed a potential trade-off between food availability and temperature in sustaining maintenance requirements which is depending on fish size. The more favourable environmental condition in the English Channel, in comparison with the Bay of Biscay, may be able not only to support faster growth and higher cumulated energy reserves in autumn, but also result in a better trade-off in the environmental conditions allowing maximum energy reserves at bigger size. The decrease in ED at largest sizes in the English Channel could also be related to the increase in length at first maturity with latitude in the north-eastern Atlantic for sardine described by Silva et al (2006), that would delay the large energetic expenses associated with reproduction.
5. Conclusion
We first confirmed the validity of regression between energy density and dry mass content for anchovy and sardine, two small pelagic fish species of economic importance, and we argue that this relationship is species specific. Second, we explored the latitudinal and seasonal variation of ED for both species. In looking for a reliable index of fish (bioenergetic)
condition, we thus encourage a preliminary assessment of its seasonal evolution. Sardine and anchovy show similar energy density values in spring reflecting a minimum energetic threshold. Maximum values of energy density, observed in autumn at the end of the productive season, are more variable across individuals and thus more likely to integrate spawning and environmental condition histories. Thus assessing fish condition should preferentially be based on autumn surveys. We encourage further work to cautiously consider the associated effects of size and season when planning experimental design. We finally highlighted the surprising, strong and dome shaped effect of size on the bioenergetic condition of sardine. We discussed the decrease pattern of energy density for larger and older fishes with reported patterns of spawning phenology, feeding behaviour or a trade-off between metabolic requirements and food availability. We are unable at this stage to conclude on any of these hypothesis or combination of them, which would indeed require additional individual information on maturity stages and stress responses.
Acknowledgments
The authors wish to thank both reviewers for their relevant advice and comments that helped in significantly improving this paper. The authors also wish to thank surveys’ chiefs namely Michele Salaun, Mathieu Doray and Morgane Travers-Trollet, as well as technicians involved in the sampling at sea during surveys. This work was supported by a PhD grant from the project SEAMAN, founded by the ANR (French National Research Agency) and EU FP7 ERA-NET SEASERA, as well as the Captain project founded by FFP (France Filière Pêche).
References
Albo-Puigserver, M., Muñoz, A., Navarro, J., Coll, M., Pethybridge, H., Sánchez, S., Palomera, I., 2017. Ecological energetics of forage fish from the Mediterranean Sea: Seasonal dynamics and interspecific differences. Deep Sea Res. Part II Top. Stud. Oceanogr., Future of oceanic animals in a changing ocean 140, 74–82. https://doi.org/10.1016/j.dsr2.2017.03.002
Albrecht-Ruiz, M., Salas-Maldonado, A., 2015. Chemical Composition of Light and Dark Muscle of Peruvian Anchovy (Engraulis ringens) and Its Seasonal Variation. J. Aquat. Food Prod. Technol. 24, 191–196. https://doi.org/10.1080/10498850.2012.762705 Anthony, J.A., Roby, D.D., Turco, K.R., 2000. Lipid content and energy density of forage
fishes from the northern Gulf of Alaska. J. Exp. Mar. Biol. Ecol. 248, 53–78. https://doi.org/10.1016/S0022-0981(00)00159-3
Bachiller, E., Irigoien, X., 2015. Trophodynamics and diet overlap of small pelagic fish species in the Bay of Biscay. Mar. Ecol. Prog. Ser. 534, 179–198. https://doi.org/10.3354/meps11375
Barroeta, Z., Olivar, M.P., Palomera, I., 2017. Energy density of zooplankton and fish larvae in the southern Catalan Sea (NW Mediterranean). J. Sea Res. 124, 1–9. https://doi.org/10.1016/j.seares.2017.04.008
Black, D., Love, R.M., 1986. The sequential mobilisation and restoration of energy reserves in tissues of Atlantic cod during starvation and refeeding. J. Comp. Physiol. B 156, 469–479.
Bode, A., Carrera, P., Lens, S., 2003. The pelagic foodweb in the upwelling ecosystem of Galicia (NW Spain) during spring: natural abundance of stable carbon and nitrogen
isotopes. ICES J. Mar. Sci. J. Cons. 60, 11–22.
https://doi.org/10.1006/jmsc.2002.1326
Boyd, A.J., Shannon, L., Schulein, F., Taunton-Clark, J., 1998. Food, transport and anchovy recruitment in the southern Benguela upwelling system of South Africa. Glob. Local Chang. Upwelling Syst. 195–209.
Brosset, P., Fromentin, J.-M., Menard, F., Pernet, F., Bourdeix, J.-H., Bigot, J.-L., Van Beveren, E., Roda, M.A.P., Choy, S., Saraux, C., 2015a. Measurement and analysis of small pelagic fish condition: A suitable method for rapid evaluation in the field. J. Exp. Mar. Biol. Ecol. 462, 90–97. https://doi.org/10.1016/j.jembe.2014.10.016
Brosset, P., Ménard, F., Fromentin, J., Bonhommeau, S., Ulses, C., Bourdeix, J., Bigot, J., Beveren, E.V., Roos, D., Saraux, C., 2015b. Influence of environmental variability and age on the body condition of small pelagic fish in the Gulf of Lions. Mar. Ecol. Prog. Ser. 529, 219–231. https://doi.org/10.3354/meps11275
Cargnelli, L.M., Gross, M.R., 1997. Notes: Fish Energetics: Larger Individuals Emerge from
Winter in Better Condition. Trans. Am. Fish. Soc. 126, 153–156.
https://doi.org/10.1577/1548-8659(1997)126<0153:NFELIE>2.3.CO;2
Conover, D.O., 1992. Seasonality and the scheduling of life history at different latitudes. J. Fish Biol. 41, 161–178. https://doi.org/10.1111/j.1095-8649.1992.tb03876.x
Conover, D.O., Present, T.M.C., 1990. Countergradient variation in growth rate: compensation for length of the growing season among Atlantic silversides from different latitudes. Oecologia 83, 316–324. https://doi.org/10.1007/BF00317554 Coombs, S.H., Smyth, T.J., Conway, D.V.P., Halliday, N.C., Bernal, M., Stratoudakis, Y.,
Alvarez, P., 2006. Spawning season and temperature relationships for sardine (Sardina pilchardus) in the eastern North Atlantic. J. Mar. Biol. Assoc. U. K. 86, 1245–1252. https://doi.org/10.1017/S0025315406014251
Costalago, D., Palomera, I., Tirelli, V., 2014. Seasonal comparison of the diets of juvenile European anchovy Engraulis encrasicolus and sardine Sardina pilchardus in the Gulf of Lions. J. Sea Res. 89, 64–72. https://doi.org/10.1016/j.seares.2014.02.008
Cury, P., Bakun, A., Crawford, R.J.M., Jarre, A., Quiñones, R.A., Shannon, L.J., Verheye, H.M., 2000. Small pelagics in upwelling systems: patterns of interaction and structural changes in “wasp-waist” ecosystems. ICES J. Mar. Sci. J. Cons. 57, 603–618. https://doi.org/10.1006/jmsc.2000.0712
Dessier, A., Dupuy, C., Kerric, A., Mornet, F., Authier, M., Bustamante, P., Spitz, J., 2017. Variability of energy density among mesozooplankton community: New insights in
functional diversity to forage fish. Prog. Oceanogr.
https://doi.org/10.1016/j.pocean.2017.10.009
Doray, M., Duhamel, E., Huret, M., Petitgas, P., 2014. PELGAS 2014 cruise, RV Thalassa. Dubreuil, J., Petitgas, P., 2009. Energy density of anchovy Engraulis encrasicolus in the Bay
of Biscay. J. Fish Biol. 74, 521–534.
https://doi.org/10.1111/j.1095-8649.2008.02143.x
Duhamel, E., Salaun, M., Pawlowski, L., 2014. EVHOE 2014 cruise, RV Thalassa.
Elliott, J., 1976. Body composition of brown trout (Salmo trutta L.) in relation to temperature and ration size. J. Anim. Ecol. 273–289.
Furnestin, J., 1943. Contribution à l’étude biologique de la sardine atlantique (Sardina pilchardus WALBAUM). Rev. Trav. Inst. Pêch. Marit. 13.
Gatti, P., Petitgas, P., Huret, M., 2017. Comparing biological traits of anchovy and sardine in the Bay of Biscay: A modelling approach with the Dynamic Energy Budget. Ecol. Model. 348, 93–109. https://doi.org/10.1016/j.ecolmodel.2016.12.018
Hale, M.B., 1984. Proximate chemical composition and fatty acids of three small coastal pelagic species. Mar Fish Rev 46, 19–21.
Hartman, K., Brandt, S., 1995. Estimating Energy Density of Fish. Trans. Am. Fish. Soc. 124, 347–355. https://doi.org/10.1577/1548-8659(1995)124<0347:EEDOF>2.3.CO;2 Huret, M., Bourriau, P., Doray, M., Gohin, F., Petitgas, P., 2017. Survey timing vs. ecosystem
scheduling: Degree-days to underpin observed interannual variability in marine ecosystems. Prog. Oceanogr. https://doi.org/10.1016/j.pocean.2017.07.007
ICES, 2016. Report of the Working Group on Southern Horse Mackerel, Anchovy and Sardine (WGHANSA), 24-29 June 2016, Lorient, France. ICES CM 2016/ACOM:17. 531 pp.
ICES, 2012. Report of the Working Group on Southern Horse Mackerel, Anchovy and Sardine (WGHANSA) (No. ICES CM 2012/ACOM:16). Azores (Horta), Portugal. ICES, 2011. Report of the Workshop on Age Reading of European Atlantic Sardine
(WKARAS) , 14-18 February 2011, Lisbon, Portugal. ICES CM 2011/ACOM:42. 91 pp.
ICES, 2009. Report of the Workshop on Age reading of European anchovy (WKARA), 9-13 November 2009, Sicily, Italy. ICES CM 2009/ACOM:43. 122 pp.
Jørgensen, C., Enberg, K., Mangel, M., 2016. Modelling and interpreting fish bioenergetics: a role for behaviour, life-history traits and survival trade-offs. J. Fish Biol. 88, 389–402. https://doi.org/10.1111/jfb.12834
Kooijman, S. a. L.M., 2013. Waste to hurry: dynamic energy budgets explain the need of
wasting to fully exploit blooming resources. Oikos 122, 348–357.
https://doi.org/10.1111/j.1600-0706.2012.00098.x
Marin, M., Polak, T., Gasperlin, L., Zlender, B., 2010. Variations in the fatty acid composition and nutritional value of Adriatic sardine (Sardina pilchardus Walb.) through the fishing season. Acta Agric. Slov. Slov.
Marshall, C.T., Frank, K.T., 1999. The effect of interannual variation in growth and condition
on haddock recruitment. Can. J. Fish. Aquat. Sci. 56, 347–355.
https://doi.org/10.1139/f99-019
Marshall, C.T., Yaragina, N.A., Ådlandsvik, B., Dolgov, A.V., 2000. Reconstructing the stock-recruit relationship for Northeast Arctic cod using a bioenergetic index of
reproductive potential. Can. J. Fish. Aquat. Sci. 57, 2433–2442.
https://doi.org/10.1139/f00-222
Marshall, C.T., Yaragina, N.A., Lambert, Y., Kjesbu, O.S., 1999. Total lipid energy as a proxy for total egg production by fish stocks. Nature 402, 288–290. https://doi.org/10.1038/46272
McBride, R.S., Somarakis, S., Fitzhugh, G.R., Albert, A., Yaragina, N.A., Wuenschel, M.J., Alonso-Fernández, A., Basilone, G., 2015. Energy acquisition and allocation to egg production in relation to fish reproductive strategies. Fish Fish. 16, 23–57. https://doi.org/10.1111/faf.12043
McPherson, L.R., Slotte, A., Kvamme, C., Meier, S., Marshall, C.T., 2010. Inconsistencies in measurement of fish condition: a comparison of four indices of fat reserves for Atlantic herring (Clupea harengus). ICES J. Mar. Sci. J. Cons. fsq148. https://doi.org/10.1093/icesjms/fsq148
Motos, L., 1996. Reproductive biology and fecundity of the Bay of Biscay anchovy population (Engraulis encrasicholus L.). Sci. Mar. 60, 195–207.
Nikolioudakis, N., Isari, S., Pitta, P., Somarakis, S., 2012. Diet of sardine Sardina pilchardus: an ‘end-to-end’ field study. Mar. Ecol. Prog. Ser. 453, 173–188. https://doi.org/10.3354/meps09656
Nunes, C., Silva, A., Marques, V., Ganias, K., 2011. Integrating fish size, condition, and population demography in the estimation of Atlantic sardine annual fecundity. Cienc. Mar. 37, 565–584.
Österblom, H., Olsson, O., Blenckner, T., Furness, R.W., 2008. Junk-food in marine ecosystems. Oikos 117, 967–977. https://doi.org/10.1111/j.0030-1299.2008.16501.x Payne, S.A., Johnson, B.A., Otto, R.S., 1999. Proximate composition of some north-eastern
Pacific forage fish species. Fish. Oceanogr. 8, 159–177.
https://doi.org/10.1046/j.1365-2419.1999.00097.x
Pecquerie, L., Petitgas, P., Kooijman, S.A.L.M., 2009. Modeling fish growth and reproduction in the context of the Dynamic Energy Budget theory to predict environmental impact on anchovy spawning duration. J. Sea Res. 62, 93–105. https://doi.org/10.1016/j.seares.2009.06.002
Pedersen, J., Hislop, J.R.G., 2001. Seasonal variations in the energy density of fishes in the
North Sea. J. Fish Biol. 59, 380–389.
https://doi.org/10.1111/j.1095-8649.2001.tb00137.x
Petitgas, P., Alheit, J., Peck, M.A., Raab, K., Irigoien, X., Huret, M., van der Kooij, J., Pohlmann, T., Wagner, C., Zarraonaindia, I., Dickey-Collas, M., 2012. Anchovy population expansion in the North Sea. Mar. Ecol. Prog. Ser. 444, 1–13. https://doi.org/10.3354/meps09451
Plounevez, S., Champalbert, G., 1999. Feeding behaviour and trophic environment of Engraulis encrasicolus (L.) in the Bay of Biscay. Estuar. Coast. Shelf Sci. 49, 177– 191. https://doi.org/10.1006/ecss.1999.0497
Rand, P., Lantry, B., Ogorman, R., Owens, R., Stewart, D., 1994. Energy Density and Size of Pelagic Prey Fishes in Lake-Ontario, 1978-1990 - Implications for Salmonine Energetics. Trans. Am. Fish. Soc. 123, 519–534. https://doi.org/10.1577/1548-8659(1994)123<0519:EDASOP>2.3.CO;2
Rosa, R., Gonzalez, L., Broitman, B.R., Garrido, S., Santos, A.M.P., Nunes, M.L., 2010. Bioenergetics of small pelagic fishes in upwelling systems: relationship between fish condition, coastal ecosystem dynamics and fisheries. Mar. Ecol. Prog. Ser. 410, 205– 218. https://doi.org/10.3354/meps08635
Silva, A., Carrera, P., Massé, J., Uriarte, A., Santos, M.B., Oliveira, P.B., Soares, E., Porteiro, C., Stratoudakis, Y., 2008. Geographic variability of sardine growth across the northeastern Atlantic and the Mediterranean Sea. Fish. Res. 90, 56–69. https://doi.org/10.1016/j.fishres.2007.09.011
Silva, A., Santos, M.B., Caneco, B., Pestana, G., Porteiro, C., Carrera, P., Stratoudakis, Y., 2006. Temporal and geographic variability of sardine maturity at length in the northeastern Atlantic and the western Mediterranean. ICES J. Mar. Sci. J. Cons. 63, 663–676. https://doi.org/10.1016/j.icesjms.2006.01.005
Simat, V., Bogdanovic, T., 2012. Seasonal changes in proximate composition of anchovy (Engraulis encrasicolus, L.) from the central Adriatic. Acta Adriat. 53, 125–132. Spitz, J., Jouma’a, J., 2013. Variability in energy density of forage fishes from the Bay of
Biscay (north-east Atlantic Ocean): reliability of functional grouping based on prey quality: variability in energy density of forage fishes. J. Fish Biol. 82, 2147–2152. https://doi.org/10.1111/jfb.12142
Spitz, J., Mourocq, E., Schoen, V., Ridoux, V., 2010. Proximate composition and energy content of forage species from the Bay of Biscay: high- or low-quality food? Ices J. Mar. Sci. 67, 909–915. https://doi.org/10.1093/icesjms/fsq008
Spitz, J., Ridoux, V., Trites, A.W., Laran, S., Authier, M., 2017. Prey consumption by cetaceans reveals the importance of energy-rich food webs in the Bay of Biscay. Prog. Oceanogr. https://doi.org/10.1016/j.pocean.2017.09.013
Spitz, J., Trites, A.W., Becquet, V., Brind’Amour, A., Cherel, Y., Galois, R., Ridoux, V., 2012. Cost of Living Dictates what Whales, Dolphins and Porpoises Eat: The Importance of Prey Quality on Predator Foraging Strategies. PLOS ONE 7, e50096. https://doi.org/10.1371/journal.pone.0050096
Stratoudakis, Y., Coombs, S., Lanzós, A.L. de, Halliday, N., Costas, G., Caneco, B., Franco, C., Conway, D., Santos, M.B., Silva, A., Bernal, M., 2007. Sardine (Sardina pilchardus) spawning seasonality in European waters of the northeast Atlantic. Mar. Biol. 152, 201–212. https://doi.org/10.1007/s00227-007-0674-4
Tirelli, V., Borme, D., Tulli, F., Cigar, M., Umani, S.F., Brandt, S.B., 2006. Energy density of anchovy Engraulis encrasicolus L. in the Adriatic Sea. J. Fish Biol. 68, 982–989. https://doi.org/10.1111/j.1095-8694.2005.00987.x
Travers-Trolet, M., Verin, Y., 2014. CAMANOC cruise, RV Thalassa.
Trites, A.W., Donnelly, C.P., 2003. The decline of Steller sea lions Eumetopias jubatus in Alaska: a review of the nutritional stress hypothesis. Mammal Rev. 33, 3–28. https://doi.org/10.1046/j.1365-2907.2003.00009.x
Van der Lingen, C., Hutchings, L., 2005. Estimating the lipid content of pelagic fish in the southern Benguela by visual assessment of their mesenteric fat. Afr. J. Mar. Sci. 27, 45–53.
Wood, S.N., 2011. Fast stable restricted maximum likelihood and marginal likelihood estimation of semiparametric generalized linear models. J. R. Stat. Soc. Ser. B Stat. Methodol. 73, 3–36. https://doi.org/10.1111/j.1467-9868.2010.00749.x
Wuenschel, M.J., Jugovich, A.R., Hare, J.A., 2006. Estimating the energy density of fish: The
importance of ontogeny. Trans. Am. Fish. Soc. 135, 379–385.
Zenitani, H., Kono, N., 2012. Daily growth rate model of Japanese anchovy larvae Engraulis japonicus in Hiuchi-nada Sea, central Seto Inland Sea. Fish. Sci. 78, 1001–1011. https://doi.org/10.1007/s12562-012-0532-2