HAL Id: hal-01622078
https://hal.archives-ouvertes.fr/hal-01622078
Submitted on 24 Oct 2017
HAL is a multi-disciplinary open access
archive for the deposit and dissemination of
sci-entific research documents, whether they are
pub-lished or not. The documents may come from
teaching and research institutions in France or
abroad, or from public or private research centers.
L’archive ouverte pluridisciplinaire HAL, est
destinée au dépôt et à la diffusion de documents
scientifiques de niveau recherche, publiés ou non,
émanant des établissements d’enseignement et de
recherche français ou étrangers, des laboratoires
publics ou privés.
magmatic segment of the Tanzanian Rift, East Africa
M. Plasman, Christel Tiberi, C. Ebinger, Stephanie Gautier, J. Albaric,
Sophie Peyrat, J. Deverchere, B. Le Gall, P. Tarits, S. Roecker, et al.
To cite this version:
M. Plasman, Christel Tiberi, C. Ebinger, Stephanie Gautier, J. Albaric, et al..
Lithospheric
low-velocity zones associated with a magmatic segment of the Tanzanian Rift, East Africa.
Geophysical Journal International, Oxford University Press (OUP), 2017, 210 (1), pp.465-481.
�10.1093/gji/ggx177�. �hal-01622078�
Geophysical Journal International
Geophys. J. Int. (2017)210, 465–481 doi: 10.1093/gji/ggx177
Advance Access publication 2017 May 1 GJI Seismology
Lithospheric low-velocity zones associated with a magmatic segment
of the Tanzanian Rift, East Africa
M. Plasman,
1C. Tiberi,
2C. Ebinger,
3S. Gautier,
2J. Albaric,
4S. Peyrat,
2J. D´everch`ere,
1B. Le Gall,
1P. Tarits,
1S. Roecker,
5F. Wambura,
6A. Muzuka,
7G. Mulibo,
6K. Mtelela,
6M. Msabi,
6G. Kianji,
8S. Hautot,
9J. Perrot
1and R. Gama
61IUEM, UMR G´eosciences Oc´ean, Plouzan´e, France. E-mail:matthieu.plasman@gmail.com 2G´eosciences Montpellier, UMR5243, Universit´e de Montpellier, Montpellier Cedex 5, France 3University of Rochester, Rochester, NY, USA
4Universit´e de Franche-Comt´e, Besanc¸on, France 5Rensselaer Polytechnic Institute, Troy, NY, USA 6University of Dar es Salaam, Dar es Salaam, Tanzania 7Nelson Mandela Institute, Arusha, Tanzania
8University of Uppsala, Uppsala, Sweden 9IMAGIR sarl, Brest, France
Accepted 2017 April 28. Received 2017 March 28; in original form 2016 October 27
S U M M A R Y
Rifting in a cratonic lithosphere is strongly controlled by several interacting processes including crust/mantle rheology, magmatism, inherited structure and stress regime. In order to better understand how these physical parameters interact, a 2 yr long seismological experiment has been carried out in the North Tanzanian Divergence (NTD), at the southern tip of the eastern magmatic branch of the East African rift, where the southward-propagating continental rift is at its earliest stage. We analyse teleseismic data from 38 broad-band stations ca. 25 km spaced and present here results from their receiver function (RF) analysis. The crustal thickness and Vp/Vs ratio are retrieved over a ca. 200× 200 km2 area encompassing the South Kenya magmatic rift, the NTD and the Ngorongoro-Kilimanjaro transverse volcanic chain. Cratonic nature of the lithosphere is clearly evinced through thick (up to ca. 40 km) homogeneous crust beneath the rift shoulders. Where rifting is present, Moho rises up to 27 km depth and the crust is strongly layered with clear velocity contrasts in the RF signal. The Vp/Vs ratio reaches its highest values (ca. 1.9) beneath volcanic edifices location and thinner crust, advocating for melting within the crust. We also clearly identify two major low-velocity zones (LVZs) within the NTD, one in the lower crust and the second in the upper part of the mantle. The first one starts at 15–18 km depth and correlates well with recent tomographic models. This LVZ does not always coexist with high Vp/Vs ratio, pleading for a supplementary source of velocity decrease, such as temperature or composition. At a greater depth of ca. 60 km, a mid-lithospheric discontinuity roughly mimics the step-like and symmetrically outward-dipping geometry of the Moho but with a more slanting direction (NE–SW) compared to the NS rift. By comparison with synthetic RF, we estimate the associated velocity reduction to be 8–9 per cent. We relate this interface to melt ponding, possibly favouring here deformation process such as grain-boundary sliding (EAGBS) due to lithospheric strain. Its geometry might have been controlled by inherited lithospheric fabrics and heterogeneous upper mantle structure. We evidence that crustal and mantle magmatic processes represent first order mechanisms to ease and locate the deformation during the first stage of a cratonic lithospheric breakup.
Key words: Time-series analysis; Continental tectonics: extensional; Africa; Crustal imag-ing.
1 I N T R O D U C T I O N
Breaking up a continental lithosphere still remains a complex and debated process. The strength of cratonic lithosphere is higher than
the tectonic driving forces, implying that magmatism and pre-existing heterogeneities are important in strain localization dur-ing early riftdur-ing stage (e.g. Bott 1992; Ebinger & Sleep 1998; Buck2004; Koptev et al.2015). The seismically and volcanically
C
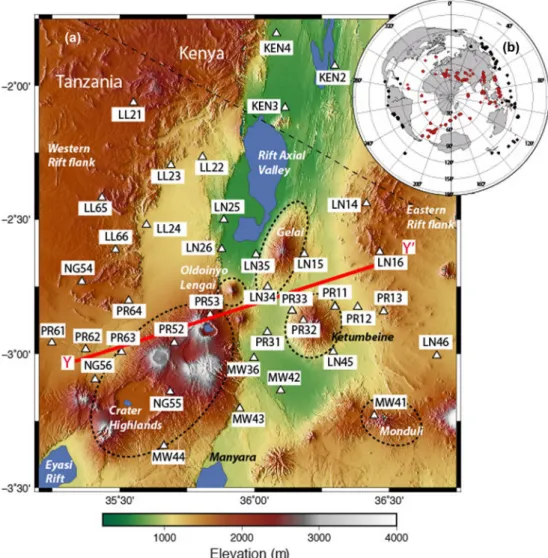
Figure 1. Structural map of the North Tanzanian Divergence with the main magmatic features (dark areas) and tectonic faults (black front lines: MBF, Manyara border fault; NMF, Natron border fault; ODO, Ol Doinyo Ogol). The red rectangle delimits the area of this study (see Fig.2a for more details). Volcanoes: B., Burko; Em., Embagai; Es., Essimingor; G., Gelai; H., Hanang; K., Kerimasi; Ke., Ketumbeine; Ki., Kibo; Kw., Kwaraha; L., Lemagrut; M., Monduli; Ma., Mawenzi; Me., Meru; Ng., Ngorongoro; Ol., Oldoinyo Lengai; OS., Ol Donyo Sambu; P., Pello. (modified from Le Gall et al.2008).
active East African rift (EAR) system includes sectors where rifting initiates in thick, strong cratonic lithosphere (e.g. Ritsema et al.
1998; Petit & Ebinger2000; Vauchez et al.2005). The rift runs over almost 3000 km, from Afar to offshore Mozambique, tran-secting Archaean to Palaeozoic orogenic belts and Permo-Triassic to Paleogene rift zones (Fig.1). The rift evolution is influenced by one or two mantle plumes emplaced prior or synchronously to the rifting process (Ebinger & Sleep1998; Rogers et al.2000). Their signature is imaged seismically (e.g. Ritsema et al.1999) and de-tected through elevated He3/He4 ratios (Hilton et al.1999; Pik et al.
2008). The youngest stage of continental break-up occurs in North Tanzania, ahead of the eastern branch where the rift interacts with a strong cratonic lithosphere (Le Gall et al.2008). This region pro-vides unprecedented opportunities to evaluate models of continental lithospheric rift initiation and magmatic modification processes.
In order to shed light on the processes involved in continental breakup, we focus our analysis on the North Tanzanian Divergence (NTD) where the eastern branch of the EAR splits into three distinct arms : the Eyasi-Wembere, Manyara and Pangani rift (Fig.1). This
area is the location of a major change both in the structural expres-sion of the rift (Dawson1992; Foster et al.1997; Le Gall et al.
2008) and in magmatic behaviour (Nonnotte et al.2008; Muirhead
et al.2015; Lee et al.2016). Imaging lithospheric structures is one major step to understand the interactions between mantle rheology, magmatism, tectonics and inherited structures in this rifted area. Previous studies focused in this specific region were either local tomography restricted to the crustal structures (Albaric et al.2014), or teleseismic analyses on a too large scale to reach a sufficient lateral resolution for detailed lithospheric discontinuities (Ritsema
et al.1998; Priestley & McKenzie2006).
We have conducted a temporary seismological experiment for 2 yr in the NTD area in order to record passive seismicity (CoLiBrEA & CRAFTI projects). We took advantage of this new and original data set to present new images of the 3D architecture of the crust and uppermost mantle in the NTD.
Here we present a receiver function (RF) analysis applied on the 38 seismological stations deployed over a ca. 200× 200 km2
Figure 2. Inset a: location and names of the 38 seismological stations in the NTD in 2013 and 2014 over a topographic map of the region (SRTM3). The main structural features discussed in the text are indicated, and the YY’ profile shows the orientation of the block diagram (Fig.15). Inset b: azimuthal distribution of P (red) and PP (black) events used for the receiver functions.
its ability to image crustal and/or mantle interfaces (e.g. Langston
1977). Based on the conversion of seismic phases (Ps) on interfaces lying at depth beneath the seismic recorder, this approach provides either a velocity profile or a layer thickness coupled with a Vp/Vs ratio. We first performed an H–k stacking inversion in order to retrieve the overall crustal thickness and Vp/Vs variations. This allows us to identify the location of rifting within the crust, and to investigate the crustal composition variation due to magmatism. Second, we used forward models to explore in more details crustal and mantle structures. Our results are then discussed in terms of magmatism, anisotropy and crustal/mantle modification during a continental breakup.
2 G E O L O G I C A L S E T T I N G
The eastern branch of the EAR formed along the eastern side of the deeply rooted Archaean Tanzanian craton (Fig.1). Rifting initiated at ca. 25 My in the Turkana region, but faulting and magmatism in the Magadi-Natron-Manyara area initiated less than 7 My ago (Baker 1986; Mana et al.2012), where they appear to have been co-eval (Foster et al.1997; Le Gall et al.2008). Rifting initiated in Pan-African lithospheric domains which imparted a strong N-S
fabric to crustal rocks (Smith & Mosley1993; Le Gall et al.2008). The NE-trending Eyasi-Wembere rift arm cross-cuts the east of the suture of the Pan-African-Archaean boundary and continues further SW across the deeply rooted craton. From geodetic data, direction of plate separation in East Africa are estimated at 4 mm yr−1in an approximately E-W direction (Saria et al.2014).
Crust and mantle xenolith data indicate that Archaean mantle lithosphere underlies thin-skinned thrusts of the Pan-African oro-gen and that much of the Natron-Manyara rift zone formed above Archaean mantle lithosphere (Vauchez et al.2005; Aulbach et al.
2008; Baptiste et al. 2015). Last et al. (1997) and Dugda et al. (2005) provide constraints on crustal structures south and north of our study area, respectively. Last et al. (1997) found no change in crustal thickness crossing the Archaean-Proterozoic boundary through the central Manyara rift. Dugda et al. (2005) find slightly thicker crust in the Pan-African belt (39–42 km) than beneath the Tanzania craton (37–38 km). Their Vp/Vs ratios estimates (1.7– 1.78) are indicative of little crustal modification outside the rift zone. Crustal velocities and thicknesses are well constrained in the Magadi rift zone by the KRISP project refraction line that shows significant crustal variation (ca. 10 km) beneath the central rift val-ley (Birt et al.1997). Recorded seismicity occurs throughout the region, with relatively deep lower crustal earthquakes beneath the
Manyara basin (Albaric et al.2009; Mulibo & Nyblade2009; Craig
et al.2011; Albaric et al.2014), and beneath the Natron basin (Lee
et al.2016,Weinstein et al., submitted).
Our study mainly focuses on the lithospheric structure beneath the N–S trending Magadi, Natron, and Manyara basins and sur-rounding uplifted flanks (Fig.1). The western flank of the Manyara basin is cross-cut by NE-trending faults and eruptive centres of the seismically active ‘Crater Highlands’ area which includes a num-ber of Pliocene-Recent eruptive centres (Dawson1992; Muirhead
et al.2015), at the western extremity of the Ngorongoro-Kilimanjaro transverse volcanic axis (Nonnotte et al.2008; Mana et al.2015) (Fig.1). Mana et al. (2015) document a northeastward migration of magmatism from the Eyasi area from about 5.9 My to 0.5 My, with a main pulse of activity occurring at about 2.3 My. Ol Doinyo Lengai (Fig.1) is an active carbonatitic volcano lying in the rift valley near the tip of the Manyara border fault. A sequence of damaging earthquakes, dike intrusion, and eruption at Ol Doinyo Lengai volcano in 2007 documents ongoing activity (Baer et al.
2008; Calais et al.2008). The source of the dike that intruded the flank of Gelai volcano in the central Natron basin was assumed to be from an active magma chamber beneath Gelai, but the youngest lava flows here have been dated at ∼1 My (Mana et al. 2015; Muirhead et al.2015). Prior to this study, it was unclear whether magma chambers do occur beneath volcanoes.
3 R E C E I V E R F U N C T I O N A N A LY S I S 3.1 Data processing
To investigate the crustal and upper mantle structure below the NTD, we analysed data recorded during the CoLiBrEA and CRAFTI twin multidisciplinary projects (French ANR and US NSF projects, re-spectively). A temporary seismic network of 38 broad-band stations was deployed from January 2013 to December 2014 in the Magadi-Natron-Manyara rift basins and their flanks (Fig. 2a). Each site consisted of a Reftek recorder connected to a STS2, Trillium 120, Trillium Compact, 3T or 40T sensor. The equipment was connected to a GPS antenna and power was supplied by a battery reloaded by solar panels. We selected events with magnitude greater than 5.5 to ensure a good signal-to-noise ratio. Both P- and PP-events were used to provide a wide range of back azimuths by selecting events with epicentral distances between 30◦–90◦(P) and 90◦–180◦ (PP) (Fig.2b).
We first rotated the three-component seismograms from the geo-graphical system (ZNE) into radial, transverse and vertical compo-nents (ZRT) and then applied a Butterworth band-pass filter between 0.08 and 0.8 Hz. The radial and transverse RFs were computed from an iterative time-domain deconvolution on a 50 s time window (10 s before P or PP arrival time and 40 s after) with a Gaussian width of 2.5 s (Ligorr´ıa & Ammon1999). The radial RFs were selected based on a least squares misfit criterion. The recovered radial com-ponent should at least reproduce 90 per cent of the initial one. This threshold dropped to 80 per cent for stations with a lack of records (instrumental problems) in order to ensure a sufficient num-ber of data to widen the back azimuthal coverage (PR12 and PR13, Fig.2a). Following this procedure, we obtained between 17 and 107 individual RFs per station (Table 1). The RFs present a high signal-to-noise ratio and a clear Ps conversion phase at the Moho at about 5 s after the first P peak taken as the time origin for the RFs (Fig.3). The first multiple (PpPs) is clearly observed at ca. 15 s, and some intermediate phases are also present either before or after 5 s.
Figure 3. Radial receiver function at station LN15 organized by increasing backazimuth. The approximate arrival time for P to S conversion at the Moho (Ps) and its first multiple (PpPs) are indicated by the black arrows. Time arrivals for an Intracrustal negative phase conversion (Px) and for a mantle one (Pxx) are marked by grey arrows.
The clarity and strong amplitude of the Ps and PpPs conversion phases justify to apply the now classically used (H-k) stacking in-version to determine first order Moho depth and Vp/Vs ratio (Zhu & Kanamori2000). However, this method fails to characterize dipping or anisotropic interfaces and second order conversions with weaker multiples. Our Rfs present both intracrustal and mantle conversion phases (Fig.3, Px and Pxx, respectively), the latter showing an az-imuthal dependency. We constrained those second order features with direct modelling, allowing for velocity inversions, anisotropy and dipping interfaces (Frederiksen & Bostock2000).
3.2 Inversion
In receiver function analysis there is an inherent trade-off between crustal thickness (H) and Vp/Vs ratio (k). The stacking grid search technique in the H-k domain reduces this trade-off by combining the P to S conversion (Ps) with its two multiples (Zhu & Kanamori
2000). For each station Ps theoretical arrival times, its first (PpPs) and second multiples (PpSs+PsPs) are calculated for all (H,k) cou-ples in a given range. The RF signal amplitudes at these times are stacked and the maximum of this function corresponds to the most coherent (H,k) combination. This method assumes purely horizontal interfaces, isotropic medium and an average crustal P-wave velocity (Zhu & Kanamori2000). In our case, we extracted the mean crustal
P-wave velocity for each station from Albaric et al. (2014) velocity model (Table1). We defined H and k to initially range between [20– 50 km] and [1.6–2.0], respectively. These boundaries correspond to common values found in these types of rift (e.g. Dugda et al.2005). Finally we controlled the impact of each phase (Ps and its two main multiples) on the results in the objective function compu-tation by setting a weight for each ones. Most RFs show a very
Table 1. Moho depth and Vp/Vs ratio (k) results from the H-k stacking method for all seismic stations. The mean crustal P-wave velocity used for each station is taken from Albaric et al. (2014). We have an average of 67 events processed per station (46 P-RF and 21 PP-RF), with a mean Moho depth of 35.9 km and an average Vp/Vs of 1.77. The reported error is deduced from the bootstrap algorithm and corresponds to the maximum value of either Evp or Eb (see the text for explanation). Stations also proceeded with a direct modelling are followed with a star (Frederiksen & Bostock2000).
Location Station Longitude Latitude Number Vp Moho depth Vp/Vs Error in Error in
name (E) (N) of RF (km s−1) (km) ratio depth (km) Vp/Vs
Eastern LN14* 36.41543 −2.43945 82 6.68 37.0 1.74 1.7 0.011 edge LN16* 36.46476 −2.62067 81 6.71 40.9 1.64 1.7 0.014 LN46* 36.6767 −3.0070 102 6.64 36.8 1.71 1.6 0.019 PR13* 36.47917 −2.84255 17 6.67 36.8 1.71 3.1 0.040 Western LL21* 35.551 −2.06273 49 6.2 33.16 1.73 1.7 0.026 edge LL22 35.5989 −2.5195 42 6.70 36.57 1.73 2.5 0.031 LL23 35.69 −2.2969 101 6.43 34.5 1.71 1.6 0.009 LL24 35.8072 −2.2662 53 6.67 34.4 1.74 1.4 0.025 LL65* 35.43399 −2.41797 82 6.67 35.6 1.75 1.5 0.025 LL66* 35.48424 −2.61226 80 6.70 38.3 1.68 1.6 0.010 NG54* 35.35953 −2.73156 97 6.68 37.3 1.7 1.5 0.017 PR61* 35.24780 −2.95860 95 6.66 39.4 1.71 1.8 0.009 PR64* 35.53311 −2.80144 60 6.67 39.2 1.67 1.8 0.013 Crater MW44 35.6638 −3.3437 72 6.64 40.3 1.71 1.7 0.013 Highlands NG55 35.6870 −3.1418 71 6.64 37.6 1.86 1.9 0.036 NG56 35.4086 −3.0960 107 6.63 40.3 1.88 3.5 0.067 PR52 35.70235 −2.95929 42 6.61 31.7 1.90 4.7 0.121 PR53 35.83537 −2.85378 37 6.58 35.7 1.73 3.0 0.062 PR62* 35.37356 −2.98336 101 6.66 36.6 1.81 1.8 0.038 PR63* 35.50668 −2.99326 89 6.64 38.8 1.83 1.7 0.014 Rift KEN2 36.2873 −1.9184 48 6.4 28.0 1.79 6.8 0.061 valley KEN3 36.11898 −2.0932 51 6.42 30.0 1.83 1.4 0.048 KEN4* 36.05358 −1.7840 45 6.41 37.1 1.67 1.7 0.034 LN15* 36.18465 −2.62788 76 6.63 35.4 1.76 1.5 0.038 LN25 35.8864 −2.50062 78 6.64 36.0 1.67 1.5 0.023 LN26 35.87848 −2.61038 66 6.62 29.3 1.94 3.7 0.066 LN34 36.0485 −2.75104 87 6.60 34.3 1.74 1.6 0.143 LN35 36.00595 −2.63044 80 6.67 37.1 1.67 1.5 0.026 LN45 36.2921 −2.9927 58 6.63 35.7 1.76 1.6 0.019 MW36 35.9981 −3.0158 52 6.64 33.7 1.88 1.3 0.031 MW41 36.4448 −3.2305 58 6.64 31.8 1.97 2.3 0.059 MW42 36.1011 −3.04 45 6.45 33.6 1.85 1.4 0.016 MW43 35.9459 −3.2046 42 6.45 36.2 1.70 2.0 0.049 PR11* 36.29912 −2.82314 71 6.66 37.9 1.66 1.5 0.069 PR12 36.38330 −2.82528 30 6.67 36.2 1.72 2.2 0.040 PR31 36.04759 −2.919 85 6.61 34.3 1.87 1.5 0.027 PR32 36.18132 −2.87539 47 6.60 35.7 1.79 1.6 0.017 PR33 36.13952 −2.83913 63 6.60 35.7 1.75 1.6 0.010
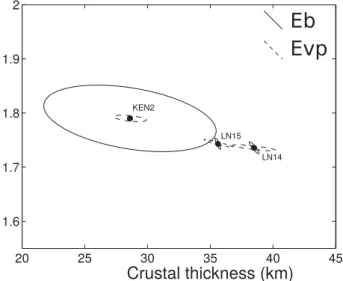
clear Ps Moho conversion around 4-5 s with a notable first multiple around 15-16 s (Fig.3), allowing for a reduction of possible (H.k) couple. The second multiple (at∼20 s) is hardly notable in our case, certainly due to destructive interference with other multiple layers. After several tests, we finally chose 0.6, 0.3 and 0.1 to be our preferred weighting factors for the 3 phases. We then identified the best couple (H,k) from the stacking functions (Fig.4) and es-timated the associated error from the bootstrap method (Efron & Tibshirani 1994). This error computation allows to quantify the widening of the objective function due to an azimuthal dependency, a complex geometry interface or noisy data. Following Tiberi et al. (2007), two errors were computed: one to account for the scattering of the data set (Eb) and the second to consider the crustal P-wave velocity uncertainty (Evp). For Eb error, we computed a standard deviation and the 95 per cent ellipse error from 200 subsets of data processed with the H-k stacking method (Fig.5). For velocity
un-certainty, we randomly chose 200 crustal Vp values between 6 and 7 km s−1and reprocessed the whole data set for those values. The final error reported in Table1is the maximum value of either Eb or Evp.
3.3 Forward modelling
Zhu & Kanamori (2000) method cannot account for dipping inter-faces, anisotropic layers and often fails to characterize intracrustal or mantle interfaces due to their weaker multiples. One third of our stations still presents intracrustal and mantle conversions, as well as a strong back-azimuthal variation for the mantle phase (see for example LN15 Fig.3). In order to investigate more precisely the lithospheric structure, we used the forward technique proposed by Frederiksen & Bostock (2000) that offers the opportunity to account
Figure 4. Crustal thickness (H) versus Vp/Vs ratio diagrams from the H–k stacking method for three stations (KEN2, LN14 and LN15, see Fig.2a for location). White points represent the maximum of the stacking function. The colour bar represents the amplitude of each stacking function.
Figure 5. Eb (plain line) and Evp (dashed line) error ellipses for KEN2, LN14 and LN15 obtained from the bootstrap analysis (see Fig.4for the H–k stacking method results). Eb is the error accounting for data scattering and Evp reflects the P-wave velocity uncertainty.
for several interfaces, as well as anisotropy and dipping interfaces when suspected. We applied this technique on stations with clear intracrustal and/or mantle conversions (Table1). We computed both the radial and transverse components of the RFs to maximize the information about the intracrustal and mantle interfaces (e.g. Jones & Phinney1998). We constrained the starting model with Moho and Vp/Vs estimates from our H–k stacking. Then we progressively added complexity by introducing additional layers, dipping inter-faces and/or anisotropy. The resulting radial and transverse RFs are then visually compared to the observed ones.
4 R E S U L T S 4.1 General features
We first applied the grid search stacking method of Zhu & Kanamori (2000) to our complete receiver function set (Table1). The average errors on Moho depth and Vp/Vs ratio are ±2 km and ±0.03, respectively. The largest values are observed for stations exhibiting Ps azimuthal variation. This is the case for KEN2 site (Fig.2a and Table1) which combines this feature with a small number of events and thus presents the largest error in crustal thickness (∼7 km, Fig.5). The results are visually summarised in Fig.6.
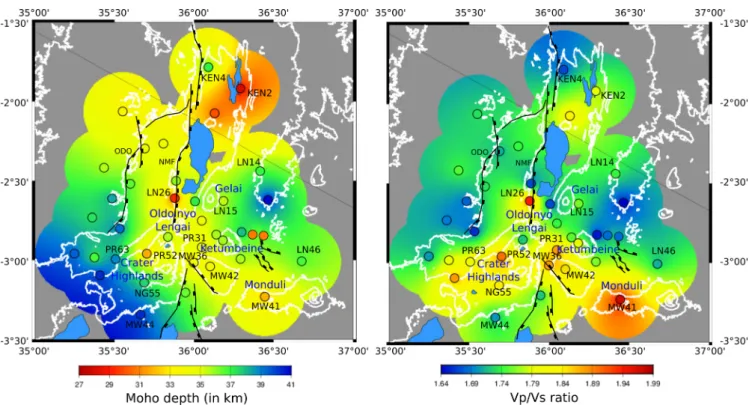
The computed Moho depth in the NTD ranges between 28 and 41 km with the highest values located beneath the shoulders of the rift. With a mean value of 37 km (±1.3 km) for Moho depth beneath the rift shoulders (Eastern and Western edges, Fig.6and Table1), our results depict slightly lower values than those from Last et al. (1997) and Juli`a et al. (2005), which show a mean Moho interface at 38-42 km depth, at a broader scale. Since our study area is more restricted and our network samples many different geological units, we thus claim for more details and lateral variability in our results. For the western flank, the crustal thickness decreases from south (∼38 km near Ngorongoro) to north (∼34.8 km), but remains thicker on average than the eastern flank (36±1.7 km). Both flanks are associated with the lowest Vp/Vs ratio (1.66 to 1.73).
In contrast with the two flanks, a thinner crust is observed in the rift axial valley (∼34 ±2 km) associated with a higher Vp/Vs (1.75–1.81). The highest Vp/Vs values (>1.85) are spatially asso-ciated with stations closed to volcanic structures: LN26 (Ol Doinyo Lengai), MW41 (Monduli), PR31, MW36 and MW42 (Ketum-beine) (Figs 2a and6). The NTD Vp/Vs values are close to the ones estimated in the Albertine rift (Gummert et al.2015) but never overtake the extreme values in Main Ethiopian rift (Stuart et al.
2006).
4.2 3D local Moho features
On the eastern edge, stations LN14, LN16, LN46, PR13 present a clear Ps peak at 5 s which weakens or even disappears for a restricted back azimuth range (for example LN14 on Fig.7). This is associated with a very weak signal on the transverse component and no periodic behaviour. This pattern is thus unlikely produced by crustal anisotropy or a dipping Moho. Alternatively, we assign the absence of Moho signature to a very local structure. Events coming from these azimuths (between N100◦E and N200◦E) may have travelled through either a low-velocity upper mantle or a fast lower crust which both possibly reduce the impedance at the Moho in a re-stricted area. Events coming from other back azimuths show a clear Ps conversion with no or only weak intracrustal signal, suggesting a rather homogeneous crust (see for example LN14 in Fig.7).
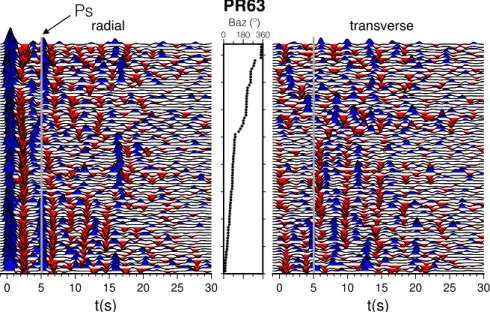
Stations located on the Crater Highlands (PR52, PR53, PR62, PR63, PR64, NG56, NG55, Fig.2a) exhibit a clear disturbance in the Moho Ps conversion with a back azimuth dependency (Fig.8). The conversion weakens or even splits for some events and is also present on the transverse component. This pattern is restricted to the volcanic edifices, and is coupled with little variation in crustal thickness over the area (Fig.6). In order to detect any correlation with geological features, we have reported the piercing points for
Figure 6. Crustal model of Moho depth (left) and Vp/Vs ratio (right). Small circles represent the seismic stations (see Fig.2a for names). The background values of the map are interpolated through∼25 km radius circle around each station. The radius of the circle corresponds to the mean distance between each station and its piercing points computed at its Moho depth. Areas without data are grey tint. White lines represent topographic contours. We add the main volcanic and tectonic (black lines) structures and name of some of the stations on which we focus during the study (NMF, Natron master fault; ODO, Ol Doinyo Ogol).
Figure 7. Left: observed radial RFs for LN14 organized by increasing backazimuth (Baz). Converted phases at the Moho (Ps, positive) and at the mantle discontinuity (Pxx, negative) are labelled. Right: corresponding synthetic radial RFs computed with Frederiksen & Bostock (2000) method. The model is composed of a 39 km thick crust (Vp= 6.68 km s−1, Vp/Vs= 1.74), an upper mantle layer (30 km thick, Vp = 8.1 km s−1, Vp/Vs= 1.8), and an LVZ with Vp= 7.4 km s−1, Vp/Vs= 1.8, a dip angle of 30◦and a strike of N40◦.
the concerned stations at the Moho depth over the Vp/Vs ratio map (Fig.9a). RFs with a disturbed Ps conversion (double or wider peak, disappearance, ...) significantly differ in location from those with a clear Moho signal and correspond to higher Vp/Vs ratio areas (>1.80, Fig.9b). On a roughly East-West profile, the Ps disturbance is also associated with the occurrence of a negative Px conver-sion within the crust (Fig.9c). Those patterns typically reflect 3-D variations of the Moho geometry and crustal structures, most likely related to the Crater Highlands and volcanic edifices inner system.
4.3 Intracrustal interfaces
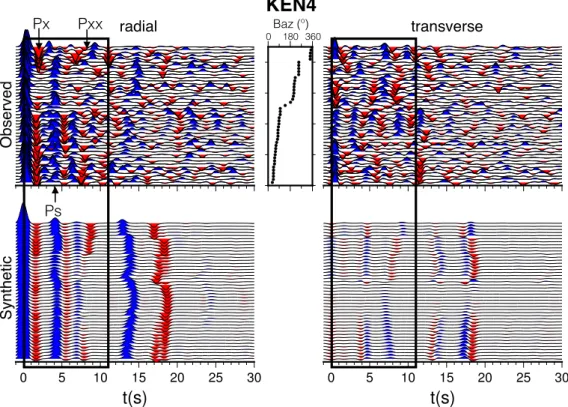
A distinct signal waveform that discriminates the stations is the presence or absence of intracrustal converted phases (before∼5 s and noted Px, Fig.3). For example, LN14 does not exhibit any strong converted phases within the crust (Fig.7) whereas KEN4 presents a clear negative peak around 3 s (Fig.10). The sedimentary layer in North Tanzania and South Kenya basins is estimated to be ca. 3.5 km thick (Birt et al.1997; Ebinger et al.1997) and cannot be
Figure 8. Observed radial (left) and transverse (right) RFs for station PR63, located near the Ngorongoro volcano. The RFs are organized by increasing back azimuth (Baz). The grey line indicates the location of the Ps phase around 5 s.
(a) (b) (c)
Figure 9. Insert a : seismic piercing points at Moho depth superimposed on the Vp/Vs map zoomed in the Crater Highlands area (Fig.6). The red points are piercing points with a clear and regular Moho signature in the RFs, while white points are piercing points associated with disturbed Ps peak within the RFs. Insert b: distribution of Vp/Vs ratio according to the quality of the Ps peak (clear on top, disturbed at bottom). Insert c: stacked RFs for stations located on the Crater Highlands along the XX’ profile (insert a).
responsible for such feature. In order to explain the strong negative conversion Px observed (Fig.3), one would expect at least 10 km of sediment thickness (Guo et al.2015). It can rather be related to the upper bound of a low-velocity zone (LVZ) near 15 km depth as it is confirmed by modelling receiver functions for simple crustal models (Fig.10). The velocity decrease can reach∼7 per cent and ∼16 per cent for P- and S-wave, respectively. A similar LVZ in the lower crust is deduced from receiver function analysis in the western branch of REA (W¨olbern et al.2010).
We map in Fig.11the stations with (1) a clear low-velocity lower crust (red circles), (2) a weak intracrustal phase (orange), and (3) no intracrustal signature (white). The stations exhibiting this in-tracrustal interface are restricted to the central part of the network and worthy correspond to the location of the low-velocity pattern obtained with a joint ambient noise and arrival time tomography (Roecker et al., submitted). The geometry and contours of this layer are complex and are echoed by a backazimuth dependency for some stations. Particularly, KEN4, LL22 and LN26, located on
the edge of the rift basins, all display a fading of this intracrustal negative conversion at ∼2 s for western events (Fig. 10). This characteristic reflects the difference in crustal structure between the flank (Proterozoic basement terranes) and the axis of the rift. Some stations also exhibit a backazimuth dependency for this inter-face that can come either from a dip or anisotropy (KEN3, LN15, LN35, PR52, PR62, MW43, MW44, NG56). However, the uneven back azimuth distribution, potential interaction with other conver-sions and poor mutual characteristic between the stations prevent us from discriminating between those two factors by simple direct models.
Stations MW41, MW42, MW43, PR31 and PR32 (Fig.2a) all present an increasing complexity of the crustal signal with mul-tiple Px conversions and quite high amplitudes on the transverse component (Fig.12). Direct models for those stations did not lead to a constrained and faithful unique solution due to the high num-bers of unknown (9 per layer). This pattern simply enhances the conspicuous complexity and layering of the crust within the axial
Figure 10. Top: observed radial (left) and transverse (right) RFs for KEN4 organized by increasing backazimuth (baz). Bottom : corresponding synthetic radial (left) and transverse (right) RFs modelled with Frederiksen & Bostock (2000) method. The model includes a 15 km thick upper crust (Vp= 7.0 km s−1, Vp/Vs= 1.70), a 19 km thick LVZ (Vp = 6.5 km s−1, Vp/Vs= 1.91, anisotropy = 8 per cent), an upper mantle layer (Vp = 8.1 km s−1, Vp/Vs= 1.80) and a dipping low velocity mantle zone at 69 km depth dipping N20◦with a strike of N220◦(Vp= 7.4 km s−1, Vp/Vs= 1.85).
valley. We confidently relate these coherent successive Px peaks to either volcanic features in the neighbourhood of the Ketum-beine (PR32 and PR31), and Monduli (MW41) volcanoes, or the presence of Pliocene-recent sedimentary infill along the rift axis (MW42, MW43).
4.4 Uppermost mantle interface
Most of the stations show a negative phase conversion ca. 7 s after the first P peak. This conversion (noted Pxx see Fig.3) is clear even in the absence of intracrustal signal, discarding potential in-tracrustal multiples (Fig.7). This negative signal is in agreement with an upper mantle interface displaying a decreasing velocity with depth. We have proceeded to simple direct modelling following the Frederiksen & Bostock (2000) technique to characterize this inter-face for stations where the peak is clearly expressed (Table1).
For stations located on the western edge of the rift (LL21, LL65, LL66, NG56, PR61, PR63, PR64, KEN4, Fig.2a), the arrival time of the negative peak after the Moho Ps conversion is back azimuth-dependent with a 2π period (Fig. 10). The associated interface corresponds to a plane dipping 20◦–30◦to the west–northwest. The depth of this dipping interface varies between 50 and 75 km, but is systematically associated with a decrease of 6 to 9 per cent in P-and S-wave velocity, respectively. A quite similar inclined structure is imaged at the eastern stations (LN14, LN16, LN46, PR11, PR13, Fig.2a), but with an opposite dipping angle (20◦–30◦to the East). We reported those orientations (strike and dip) over the Vp/Vs map (Fig.13).
We are fully aware that these models are non-unique, however the dip and the strike of the interface plane are based on the back
az-imuth dependency and we confidently constrain the value between ±10◦. A horizontal mantle interface failed to reproduce the radial
observed stacked RFs, whereas a dipping interface better fits the widening of the phase at 7 s (Fig.14). Moreover the dip, strike and depth of this interface are consistent from one station to another. For PR63 and PR61 for example, the geometry of the dipping interface (30◦to the West) is coherent with a depth of∼48 km under PR63 and 19 km deeper for PR61 (∼67 km, Fig.13). Finally, the presence of a low-velocity mantle beneath the region is consistent with pre-vious seismological results that demonstrated a marked decrease of surface waves velocity between∼60 and 100 km depth (Fishwick & Bastow2011; Weeraratne et al.2003; O’Donnell et al.2013).
5 D I S C U S S I O N
The main structural features of the NTD area, deduced from our RF analysis, are synthesized on the schematic lithospheric-scale block diagram in Fig.15(see Fig2a for the position), and consist as follows:
(i) A relatively deep Moho ranging from 28 to 41 km depth. The thinnest crust is localized in the axial rift valley and corresponds to the most complex and layered signal in the RFs. The thickest crust is observed below the Crater Highlands and beneath Proterozoic mobile belt, where RFs depict a rather homogeneous crustal signal (Fig.6).
(ii) From East to West, an asymmetric Moho interface with the steepest slope westwards beneath PR63 (Fig.8).
(iii) A clear low-velocity lower crust in the central part of the network, the top of which lies at 15–18 km depth (Fig. 11). It
Figure 11. Comparison between intracrustal LVZ in RFs (circles) and local S-wave velocity variations (background). Red circles indicate stations with a clear low-velocity lower crust signature on their RF signal, orange ones represent moderate or weak low-velocity signature and white circles are stations with no intracrustal signature in their RFs. The background map is the S-wave velocity variations obtained at 20 km depth from a joint surface/body wave inversion (S. Roecker, submitted).
Figure 13. Map of the mid-lithospheric discontinuity delimiting a low velocity underlying mantle deduced from direct modelling (Frederiksen & Bostock
2000). Black triangles represent stations with no detectable mantle interface signature and grey circles represent stations with a mantle interface signature in their RFs, for which no satisfying interface geometry was found due to too global complex signal. Stations for which the geometry of the mantle interface was successfully modelled are represented with brown circles (colour scale representative of the interface depth). The dip angle value is written next to the corresponding station. Background colour map depicts crustal Vp/Vs ratio with topographic contours (white lines).
does not seem to correlate directly with volcanic edifices at the surface and exhibits a complex 3-D geometry.
(iv) Presence of crustal anisotropy in the rift valley and beneath the volcanic edifices.
(v) A low-velocity mantle layer from 60–70 km depth underlying a normal upper mantle. The asymmetrically dipping attitude of this interface is particularly clear in the eastern and western parts of the region, with an SE and NW dip, respectively (Fig.13).
We will now discussed their meaning in terms of rifting processes in a cratonic lithosphere, tectonic and magmatic mechanisms for the NTD.
5.1 Vp/Vs variations in terms of crustal composition
The Vp/Vs ratio is commonly used to estimate the bulk composi-tion of the crust (e.g. Domenico1984; Christensen1996). It usually ranges between 1.6 and 2.0 and is sensitive to rock composition, es-pecially to quartz and feldspar/plagioclase percentage. Vp/Vs ratio usually exhibits low values for felsic composition rocks (1.71 for granite, 1.78 for granodiorite) and increases for mafic rocks (1.84 for gabbro) (Holbrook et al.1992; Zhao et al.2010). The presence
of fluids and partial melt are also known to control Vp/Vs ratios, the latter increasing with higher contents (Watanabe1993).
In our study, the lowest ratios (1.66 to 1.73) are localized beneath the rift flank and coincides with the Archaean crust West of the Crater highlands. They are consistent with previously determined value of∼1.74 (Last et al.1997; Mollel et al.2008). There is no significant difference between eastern and western flanks, both of them exhibiting values consistent with the presence of cratonic and Proterozoic belt rocks (gneiss or granitoid composition, Harvey
2005).
The stations located in the rift valley and Crater Highlands present higher Vp/Vs values (between 1.75 and 1.81) that coincide with lo-cations of either volcanic edifices, Quaternary sediments and/or interbedded mafic lavas and volcanoclastics (Figs1and6). In the study area, magmatic fluids (e.g. partial melting), water contents and rock composition may equally affect the Vp/Vs values. More-over it is important to note that our H–k stacking value is only a crustal average and can thus result from different layers interaction, particularly for stations with an intricate crustal signal (e.g. Fig.10). Direct modelling requires an even higher Vp/Vs ratio restricted in the crustal LVZ for some of the central stations (up to 1.91, Table2). This result strongly supports the presence of partial melt within the lower crust in the rift valley.
Figure 14. Comparison between observed (continuous black line) and syn-thetic stacked RF for stations LN14 (upper panel) and NG54 (lower panel). Black dashed line is for the stacked RF signal obtained with a horizon-tal mantle interface, whereas the red dashed line is for a dipping interface (LN14: dip 30◦ strike N40◦; NG54: dip 25◦ strike N200◦). Black arrow indicates the mantle Pxx converted phase.
Those high Vp/Vs values can however be artefacts from anisotropy or complex structures within the crust (Hammond et al.
2014). We strongly suspect anisotropy to be present beneath some of the stations (e.g. MW44 presents strong energy on the transverse component with clear both polarity and amplitudeπ-periodicity). However it is difficult to quantify in such a complex setting the effect of anisotropy, dipping interfaces, lateral heterogeneities or
multiple layering on the Vp/Vs values. We thus consider our results as an upper bound for the Vp/Vs ratio which can be compared with values obtained from independent other methods (i.e. Roecker et al, submitted). Even if overestimated, our Vp/Vs ratios in the Rift valley are indicative of a lower degree of partial melt compared to more mature rifts, which is consistent with an earlier stage of conti-nental breakup (e.g. the Main Central Rift in Ethiopia, Stuart et al.
2006; Hammond et al.2011; Keir et al.2011; Reed et al.2014).
5.2 Breaking up a thick crust
Results from H-k stacking analyse show that the Moho evolves from 35–40 km deep beneath the rift flanks up to 28 km in the Rift valley. This crustal thinning is asymmetric, with a steeper slope for its western part (Fig.15). This steepest gradient coincides with the location of the deeply buried eastern edge of the Tanzanian craton and with the fault-like structure bounding both the Ngorongoro vol-canic zone and the Natron half-graben (NNE–SSW-oriented Natron master fault and Ol Doinyo Ogol). We relate this to the Tanzanian Craton influence, which may create a sharper rheological boundary compared to the heterogeneous Proterozoic mobile belt (Le Gall
et al.2008). This thinning is comparable in amount to the∼10 km observed in the Main Ethiopian and Kenya rifts (Keller et al.1994; Stuart et al.2006), but does not seem associated to underplating here. Our Ps Moho conversion phases are undoubtedly sharper and do not reflect any gradual velocity contrast contrariwise to the Main Ethiopian Rift, for example (Stuart et al.2006).
We associate the high values of Vp/Vs ratio and the presence of an LVZ in the lower crust to the effect of magmatism, which will ease the breaking up of the lithosphere by intruding partial
Figure 15. Simplified structural scheme of an ENE-WSW profile (YY’ in Fig.2) of the North Tanzanian Divergence deduced from the receiver functions analysis.
Table 2. Conversion depths and Vp/Vs ration for the crustal low-velocity zone for the most representative stations ob-tained from Frederiksen & Bostock (2000) direct modelling.
Station Depth (km) Vp/Vs KEN4 15 1.91 LN15 17 1.85 PR11 15 1.86 PR63 18 1.97 PR62 18 1.76
melt in the crust (Buck2004). If magmatism does not express here by means of mafic underplating, it modifies the crust through two different schemes in the NTD: local connections between mantle and crustal material, and through a broaden lower crust LVZ. First, we interpret the correlation between highest Vp/Vs ratios over the whole Crater Highlands (e.g.∼1.9 for PR52) and disturbed Ps Moho conversions (Fig. 9) as possible connection or coupling between crust and mantle material. This coupling is less obvious for basaltic shield volcanoes within the axial valley (Gelai and Kitumbeine), where the most disturbed RFs only come from events piercing a region S–SE of Gelai. This region coincides with a strong negative velocity anomaly recently identified in the lower crust (Roecker
et al., submitted). The intense and persistent seismicity 8–10 km
deep organized in an elliptical (map view) zone between Gelai and Oldoinyo Lengai volcanoes has been interpreted as a magma chamber and sill complex feeding the 2007 Lengai eruption (Baer
et al.2008). But our new results indicate a much deeper magma body and feeding than was first inferred from models of InSAR (Calais et al.2008; Biggs et al.2009,2013).
The weaker correlation between high Vp/Vs ratio and disturbed Ps phase recorded in the axial rift valley may also result from a number of combined factors. First, we used a standard 1-D model (IASP91, Kennett & Engdahl1991) to calculate the piercing points. The highly heterogeneous crust within the axial valley may lead to mislocated points (Albaric et al.2014, Roecker et al., submitted, Fig.11). Second, our Vp/Vs estimate results from a computation over the whole RFs, regardless of ray azimuth. Vp/Vs lateral varia-tions for a given station is then limited and may not include all the complexity of the axial valley signal. Lastly, this poor correlation can reflect smaller wavelength structures not detected by our ray distribution and affecting the RFs with less consistency. The lateral influence of the ray over the Fresnel zone has not been taken into account here, and can be responsible for the observed discrepancy. Conversely, the crust and mantle connection beneath the Crater Highlands seems to be wide enough to consistently affect the RF signal over a broader area.
Magmatism further modifies the crust by way of a clear LVZ in the lower crust starting at 15–18 km depth we retrieve beneath the rift axial valley. This decrease of velocity (∼9 per cent for P wave and ∼15 per cent for S wave) is consistent with the latest crustal tomographic models in the area (Fig. 11, Albaric et al.,
2014, Roecker et al., submitted). Stations located between the Crater Highlands and central rift valley (LN25, LN26, PR53, MW36 and MW43) coincide yet with normal to high S-wave velocities (Fig.11). A detailed backazimuthal inspection of those RFs shows that the low-velocity Px phase is only present for events passing through either Ngorongoro or Gelai volcanic areas. Events not coming from those backazimuths depict only little or no intracrustal signatures, highlighting the strong 3-D structure of this layer. Our network distribution permits to reveal the complex 3-D geometry of this LVZ, localized in the Natron rift segment and around the Crater
Highlands (Fig.11) but which does not extend to the Tanzanian Craton (Juli`a et al.2005). From our RF analysis, we may further argue that the Natron master fault acts like a barrier and prevent this LVZ to go further West. As proposed at a wider scale by Ebinger & Sleep (1998) the spatial distribution of this LVZ may be controlled by inherited crustal structures and crustal thickness variations that might have both acted as a guide or a barrier for the low-velocity pattern.
Previous seismological studies in Tanzania at a broader scale show a similar low velocity layer starting at∼20 km (Last et al.
1997; Juli`a et al.2005). At the scale of the East African Rift, some segments display similar features (Keranen et al.2009; Tuluka2010; W¨olbern et al.2010; Gummert et al.2015), and more generally low-velocity crustal zones are observed for similar depth in other rifts, such as the Rhine graben (Fuchs et al.1987), Southern Tibet (Cogan et al.1998; Jiang et al.2014) and the Baikal Rift (Mord-vinova et al. 2007; Basuyau & Tiberi 2011). In most cases, this pattern is attributed to multiple deep processes or features such as partial melting, magmatic chambers, aqueous fluids or even crustal delamination (e.g. Wallner & Schmeling2011). Simple direct mod-elling we performed using Frederiksen & Bostock (2000) tech-nique pleads for high Vp/Vs value (∼1.9) restricted within this LVZ (Table2). We thus interpret this LVZ to be the location for partial melting with a lesser amount than for more mature rift.
5.3 Anisotropic behaviour
Recent seismicity studies (Weinstein et al., submitted), active CO2
degassing along border faults (Lee et al.2016), and the 2007 dike intrusion (Calais et al. 2008; Biggs et al. 2009) attest to fluid-filled crustal cracks within the study area, that are likely able to produce anisotropic behaviour recordable by our network (Gerst & Savage2004; Keir et al.2011; Hammond et al.2014). If some of our stations present backazimuthal dependency clearly imputable to anisotropic crustal structures (e.g. MW44), the transverse com-ponent of our RFs is most of the time hardly attributable to only one causing factor (e.g. MW41 on Fig.12). Dipping interfaces can mix with anisotropy to produce a complex signal on the transverse component (e.g. Jones & Phinney1998; Wirth & Long2012). Our H–k stacking and the simple direct models we performed cannot un-equivocally distinguish between those factors, given the complexity and numbers of interfaces involved in the observed RF signal. A thoroughly analyse of the signal through more sophisticated meth-ods taking into account phase back-azimuthal variations or polarity change on the transverse component might resolve these ambigui-ties (Shiomi & Park2008; Bianchi et al.2010; Park & Levin2016). Moreover, when present, the transverse component does not system-atically show a common behaviour over the whole network, hence being indicative or either different axis of anisotropy, or variation in the dip of the interfaces.
5.4 Upper mantle structure
The modification of the lithosphere by rifting is not restricted to the solely crust, but considerably affects the upper mantle too, as we identified a clear velocity decrease of∼9 per cent at ca. 60 km depth (Fig.13). Its strong and clear signature on either side of the rift valley advocates for a continuous and high-velocity contrast, even if its presence is not firmly assessed for the very central part of the rift, due to strong interference and multiple phases in the RF signal. We relate this lithospheric LVZ to the velocity decrease recorded at
Figure 16. Alternative scenarii to explain the source of the mid-lithospheric discontinuity observed at ca. 60–80 km depth. (a) An ascending lithosphere results in a metasomatized mantle restricted by the presence of inherited lithospheric fabrics in the upper part. (b) Accumulated melt at mid-lithospheric depth can explain up to 10 per cent of velocity reduction. (c) Elastically accommodating grain boundary sliding (EABGS) process can take place in the upper part of the mantle, where conditions required for such a process are gathered in a rifting area.
a more regional scale by surface wave tomography at about 70 km associated to a locally high Vp/Vs ratio (1.9) in the volcanic areas (e.g. Weeraratne et al.2003; O’Donnell et al.2013,2016). Our denser array and the quality of our data bring new insight on this LVZ, in particular on its dipping geometry and depth variation at the scale of the whole NTD. Several processes can be invoked to explain this mantle LVZ beneath the NTD (Fig.16):
(i) seismic anisotropy, due to either mantle flow (Bagley & Nyblade2013), lattice-preferred orientation (Tommasi et al.1999) or oriented melting cracks (Holtzman & Kendall2010) can produce a local change in velocity. Our RF analysis can hardly be conclu-sive for the presence of azimuthal anisotropy within the lithosphere, and particularly in this LVZ. Recent SKS analyses emphasize the presence of mantle anisotropy (Albaric et al.2014; Ebinger et al.
2016), but it barely explains 9 per cent of velocity reduction within the mantle in all directions. We thus plead for the contribution of another main factor.
(ii) a metasomatic alteration of the mantle : This LVZ could evi-dence the boundary between a metasomatized and a more ’normal’ mantle in agreement with Mattsson et al. (2013) who showed that the volcanic rocks around the Natron lake and the Engaruka area originate from a metasomatized lithosphere (Fig.16a). Additional evidence are supplied by mantle xenoliths from Pello Hill and Eledoi areas (south of Gelai volcano) that recorded metasomatism-induced hydration (Baptiste et al.2015). W¨olbern et al. (2012) invoke a mineralogical alteration of the lower lithosphere by means of meta-somatism to explain a similar LVZ at about 70-90 km beneath the Albertine Rift (Western EAR Branch). Ascending asthenospheric melts can produce this alteration of the lithosphere. Inherited struc-tures (craton, Proterozoic fabric) may have restricted the ascent of the asthenosphere and explain the trend and dip of the interface (Fig.13).
(iii) the presence of a partial melting front (Fig.16b). Melilititic and nephelinitic rocks from the Natron lake area show degrees of partial melting consistent with melting zones as deep as 60– 75 and 75–90 km (Mattsson et al.2013). A melt fraction of 3– 6 per cent can reduce seismic velocity by 5–10 per cent in the upper mantle (Olugboji et al.2013), depending on melting body geometry (Faul et al.1994; Takei2002). Moreover, accumulated melt at mid-lithosphere could feed the LVZ observed at low crustal depth and can be related to the intricate axial valley structure complexity observed in the RFs. However, no evidence for underplating is found within the RFs, which all show very clear Ps conversion at the Moho depth, and a normal upper mantle velocity below this interface, by contrast to patterns typically observed in more mature magmatic rift zones (Stuart et al.2006). In order to fit the observed sharp seismic
signature on the RFs, additional processes (viscosity, permeability) are requested to maintain a large melt fraction in a thick layer to produce a recordable seismic signal as observed (Olugboji et al.
2013).
(iv) elastically accommodated grain-boundary sliding (EAGBS, Fig. 16c) provides an alternative explanation for a velocity drop at mid lithospheric depth (Karato 2012; Karato et al.2015). At moderate temperatures, grain boundaries weaken and lead to the re-duction of the elastic modulus for polycrystalline aggregates (Zener
1941; Kˆe1947). The induced velocity decrease and its location in depth will depend on water content, geotherm and grain size. Olug-boji et al. (2013) show that the reduction of velocity produced by EAGBS is recordable by P-receiver functions, depending on the sharpness of the velocity contrast created. This process has already been proposed to explain mid-lithospheric discontinuities (MLD Faul & Jackson 2005; Selway et al. 2014) but gradually leads to diffusion creep processes with increasing temperature (Lee
et al.2011). EAGBS is then usually restricted to uppermost mantle depth, even if the presence of a secondary phase of low viscos-ity (e.g. melt) makes the EAGBS predominant at higher tempera-ture (Jackson et al.2006). The velocity drop caused by EAGBS is poorly constrained (Faul & Jackson2005) and can reach 5 per cent but is sharper when associated to a water content change (e.g. wet mantle Karato 2012). The acute signature observed on our RFs is coherent with a metasomatism-induced hydration (Baptiste
et al.2015) which could enhance the EAGBS effect on seismic signal.
Finally, this structure may have a deeper origin and could reflect the interaction between Proterozoic inherited structures and flow from the lower mantle. As proposed by Bagley & Nyblade (2013), lower mantle flow could have strongly influenced the Afro-Arabian rift, and its NE–NNE orientation probably control the tectonic defor-mation observed at the surface. These flows seem to not necessary correspond to the principal African plume but maybe more to a deflection of this one, preferentially channelled along the east side of the Tanzanian craton (Koptev et al.2015).
6 C O N C L U S I O N
Analysis of receiver functions recorded by a broad-band seismic network in the North Tanzanian Divergence area, eastern branch of the East African rift, provides constraint on the accommodation of strain in a cratonic rifting lithosphere. Moho geometry evidences an asymmetric crustal thinning of about 10 km localized beneath the axial rift valley. The Vp/Vs ratio variations indicate strong modifi-cation of crustal composition. The strong correlation between high
Vp/Vs ratio and major volcanic edifices advocates for the presence of magma/fluids within the crust associated with magmatic events. Beneath the rift axial valley, those variations are also controlled by the complex crustal structure and nature of the crust. A first LVZ is detected in the lower crust (15–35 km depth) and results from a combined effect of partial melting for areas where Vp/Vs ratio is high, temperature and rock composition variations. A second low-velocity layer is identified at mid-lithospheric depth (∼60 km) and presents a decrease of up to 9 per cent in velocity. Its geometry and distribution is not restricted to the rift axial valley and can be the product of a melt accumulation within the upper mantle, the raising deflection of asthenospheric and metasomatized material. Alterna-tively, deformation processes like grain boundary sliding may take place in this thick rifting lithosphere and explain this velocity drop. For both LVZ, we assume Archaean and/or Proterozoic inherited structures to constrain their geometry and extension. No obvious link between the two LVZs at depth has been clearly demonstrated from receiver function analysis alone.
A C K N O W L E D G E M E N T S
The seismic instruments were provided by the Incorporated Re-search Institutions for Seismology (IRIS) through the PASSCAL Instrument Center at New Mexico Tech. Data collected will be avail-able through the IRIS Data Management Center. The facilities of the IRIS Consortium are supported by the National Science Foundation under Cooperative Agreement EAR-1261681 and the DOE National Nuclear Security Administration. We are very grateful for the assis-tance of RPI graduate student Anastasia Rodzianko, Rochester un-dergraduate students Eli Witkin, Catherine Lambert, Avery Palardy and Geosciences Montpellier graduate student Nathalie Rasendra in seismic installations and servicing. Work was conducted with approval by the Commission for Science and Technology (Tanzania) and the National Council for Science and Technology (Kenya). We are grateful for logistical support from Tanzania Na-tional Parks Commission and to the Ngorongoro NaNa-tional Park. We could not have achieved this work without logistical assistance from primary and secondary school teachers throughout the region, the Masai clans in Kenya and Tanzania, driver-guides from Fortes Tours, the Ngorongoro conservation area, Tanapa and the French Ambassy. Then we want to thank Majura Songo and Sindato Moreto and all the people from CoLiBrEA (ANR-12-JS06-0004) and Crafti (EAR-1261681) projects. We want to deeply thank Prof. J. Park, the editor and one anonymous reviewer for their constructive remarks, which have greatly improved the manuscript.
R E F E R E N C E S
Albaric, J., D´everch`ere, J., Petit, C., Perrot, J. & Le Gall, B., 2009. Crustal rheology and depth distribution of earthquakes: insights from the central and southern East African Rift System, Tectonophysics, 468(1), 28–41. Albaric, J., D´everch`ere, J., Perrot, J., Jakovlev, A. & Deschamps, A., 2014.
Deep crustal earthquakes in North Tanzania, East Africa: Interplay be-tween tectonic and magmatic processes in an incipient rift, Geochem. Geophys. Geosyst., 15(2), 374–394.
Aulbach, S., Rudnick, R. & McDonough, W., 2008. Lithospheric mantle sources within the East African Rift, Tanzania, Geochim. Cosmochim. Acta Supplement, 72, 37.
Baer, G., Hamiel, Y., Shamir, G. & Nof, R., 2008. Evolution of a magma-driven earthquake swarm and triggering of the nearby Oldoinyo Lengai eruption, as resolved by insar, ground observations and elastic modeling, East African Rift, 2007, Earth planet. Sci. Lett., 272(1), 339–352.
Bagley, B. & Nyblade, A.A., 2013. Seismic anisotropy in eastern Africa, mantle flow, and the African superplume, Geophys. Res. Lett., 40(8), 1500–1505.
Baker, B., 1986. Tectonics and volcanism of the southern Kenya Rift Valley and its influence on rift sedimentation, Geol. Soc. Lond. Spec. Publ., 25(1), 45–57.
Baptiste, V., Tommasi, A., Vauchez, A., Demouchy, S. & Rudnick, R.L., 2015. Deformation, hydration, and anisotropy of the lithospheric mantle in an active rift: Constraints from mantle xenoliths from the North Tanzanian Divergence of the East African Rift, Tectonophysics, 639, 34–55. Basuyau, C. & Tiberi, C., 2011. Imaging lithospheric interfaces and 3D
structures using receiver functions, gravity, and tomography in a common inversion scheme, Comput. Geosci., 37(9), 1381–1390.
Bianchi, I., Park, J., Piana Agostinetti, N. & Levin, V., 2010. Mapping seismic anisotropy using harmonic decomposition of receiver functions: An application to northern apennines, italy, J. geophys. Res., 115(B12), B12317, doi:10.1029/2009JB00700761.
Biggs, J., Amelung, F., Gourmelen, N., Dixon, T.H. & Kim, S.-W., 2009. Insar observations of 2007 Tanzania rifting episode reveal mixed fault and dyke extension in an immature continental rift, Geophys. J. Int., 179(1), 549–558.
Biggs, J., Chivers, M. & Hutchinson, M.C., 2013. Surface deformation and stress interactions during the 2007–2010 sequence of earthquake, dyke intrusion and eruption in northern Tanzania, Geophys. J., 195, 16–26. Birt, C., Maguire, P., Khan, M., Thybo, H., Keller, G.R. & Patel, J., 1997. The
influence of pre-existing structures on the evolution of the southern Kenya Rift Valleyevidence from seismic and gravity studies, Tectonophysics, 278(1), 211–242.
Bott, M., 1992. Modelling the loading stresses associated with active conti-nental rift systems, Tectonophysics, 215(1), 99–115.
Buck, W.R., 2004. Consequences of asthenospheric variability on continen-tal rifting, in Rheology and Deformation of the Lithosphere at Continencontinen-tal Margins, vol. 62, pp. 1–30, eds Karner, G.D., Taylor, B., Driscoll, N.W.
& Kohlstedt, D.L., Columbia University Press.
Calais, E. et al., 2008. Strain accommodation by slow slip and dyking in a youthful continental rift, East Africa, Nature, 456(7223), 783–787. Christensen, N.I., 1996. Poisson’s ratio and crustal seismology, J. geophys.
Res., 101(B2), 3139–3156.
Cogan, M.J. et al., 1998. Shallow structure of the Yadong-Gulu rift, southern Tibet, from refraction analysis of Project INDEPTH common midpoint data, Tectonics, 17(1), 46–61.
Craig, T., Jackson, J., Priestley, K. & McKenzie, D., 2011. Earthquake dis-tribution patterns in Africa: their relationship to variations in lithospheric and geological structure, and their rheological implications, Geophys. J. Int., 185(1), 403–434.
Dawson, J., 1992. Neogene tectonics and volcanicity in the North Tanza-nia sector of the Gregory Rift Valley: contrasts with the kenya sector, Tectonophysics, 204(1), 81–92.
Domenico, S.N., 1984. Rock lithology and porosity determination from shear and compressional wave velocity, Geophysics, 49(8), 1188–1195. Dugda, M.T., Nyblade, A.A., Julia, J., Langston, C.A., Ammon, C.J. &
Simiyu, S., 2005. Crustal structure in Ethiopia and Kenya from receiver function analysis: Implications for rift development in eastern Africa, J. geophys. Res., 110( B1).
Ebinger, C., Djomani, Y.P., Mbede, E., Foster, A. & Dawson, J., 1997. Rifting archaean lithosphere: the eyasi-manyara-natron rifts, east africa, J. Geol. Soc., 154(6), 947–960.
Ebinger, C., Tiberi, C., Currie, C., van Wijk, J. & Albaric, J., 2016. Rifting an archaean craton: Insights from seismic anisotropy patterns in E. Africa, in AGU Fall Meeting, T21F-01.
Ebinger, C.J. & Sleep, N., 1998. Cenozoic magmatism throughout east Africa resulting from impact of a single plume, Nature, 395(6704), 788–791.
Efron, B. & Tibshirani, R.J., 1994. An Introduction to the Bootstrap, CRC press.
Faul, U.H. & Jackson, I., 2005. The seismological signature of temperature and grain size variations in the upper mantle, Earth planet. Sci. Lett., 234(1), 119–134.
Faul, U.H., Toomey, D.R. & Waff, H.S., 1994. Intergranular basaltic melt is distributed in thin, elogated inclusions, Geophys. Res. Lett., 21(1), 29–32.
Fishwick, S. & Bastow, I.D., 2011. Towards a better understanding of African topography: a review of passive-source seismic studies of the African crust and upper mantle, Geol. Soc. Lond. Spec. Publ., 357(1), 343–371. Foster, A., Ebinger, C., Mbede, E. & Rex, D., 1997. Tectonic development
of the northern Tanzanian sector of the East African Rift System, J. Geol. Soc., 154(4), 689–700.
Frederiksen, A. & Bostock, M., 2000. Modelling teleseismic waves in dip-ping anisotropic structures, Geophys. J. Int., 141(2), 401–412.
Fuchs, K., Bonjer, K.-P., Gajewski, D., L¨uschen, E., Prodehl, C., Sandmeier, K.-J., Wenzel, F. & Wilhelm, H., 1987. Crustal evolution of the Rhine-graben area. 1. exploring the lower crust in the RhineRhine-graben rift by unified geophysical experiments, Tectonophysics, 141(1–3), 261–275. Gerst, A. & Savage, M.K., 2004. Seismic anisotropy beneath ruapehu
vol-cano: a possible eruption forecasting tool, Science, 306(5701), 1543– 1547.
Gummert, M., Lindenfeld, M., W¨olbern, I., R¨umpker, G., Celestin, K. & Batte, A., 2015. Crustal structure and high-resolution moho topography across the rwenzori region (albertine rift) from p-receiver functions, Geol. Soc. Lond. Spec. Publ., 420, SP420–4.
Guo, Z. et al., 2015. High resolution 3-d crustal structure beneath{NE} china from joint inversion of ambient noise and receiver functions using {NECESSArray} data, Earth planet. Sci. Lett., 416, 1–11.
Hammond, J., Kendall, J.-M., Stuart, G., Keir, D., Ebinger, C., Ayele, A. & Belachew, M., 2011. The nature of the crust beneath the Afar triple junction: Evidence from receiver functions, Geochem. Geophys. Geosyst., 12(12), Q12004, doi:10.1029/2011GC003738.
Hammond, J., Kendall, J.-M., Wookey, J., Stuart, G., Keir, D. & Ayele, A., 2014. Differentiating flow, melt, or fossil seismic anisotropy beneath Ethiopia, Geochem. Geophys. Geosyst., 15(5), 1878–1894.
Harvey, P.K., 2005. Petrophysical properties of crystalline rocks, Geological Society of London.
Hilton, D.R., Gr¨onvold, K., Macpherson, C.G. & Castillo, P.R., 1999. Ex-treme 3 he/4 he ratios in northwest Iceland: constraining the common component in mantle plumes, Earth planet. Sci. Lett., 173(1), 53–60. Holbrook, W.S., Mooney, W.D. & Christensen, N.I., 1992. The seismic
velocity structure of the deep continental crust, Cont. Lower Crust, 23, 1–43.
Holtzman, B.K. & Kendall, J., 2010. Organized melt, seismic anisotropy, and plate boundary lubrication, Geochem. Geophys. Geosyst., 11(12), Q0AB06, doi:10.1029/2010GC003296.
Jackson, I., Faul, U., Fitz Gerald, J. & Morris, S., 2006. contrasting vis-coelastic behavior of melt-free and melt-bearing olivine: Implications for the nature of grain-boundary sliding, Mater. Sci. Eng. A, 442, 170–174. Jiang, M., Ai, Y., Zhou, S. & Chen, Y.J., 2014. Distribution of the low
velocity bulk in the middle-to-lower crust of southern Tibet: implications for formation of the north–south trending rift zones, Earthq. Sci., 27(2), 149–157.
Jones, C.H. & Phinney, R.A., 1998. Seismic structure of the lithosphere from teleseismic converted arrivals observed at small arrays in the southern Sierra Nevada and vicinity, California, J. geophys. Res., 103(B5), 10 065–10 090.
Juli`a, J., Ammon, C.J. & Nyblade, A.A., 2005. Evidence for mafic lower crust in Tanzania, East Africa, from joint inversion of receiver functions and Rayleigh wave dispersion velocities, Geophys. J. Int., 162(2), 555–569. Karato, S.-i., 2012. On the origin of the asthenosphere, Earth planet. Sci.
Lett., 321–322, 95–103.
Karato, S.-i., Olugboji, T. & Park, J., 2015. Mechanisms and geologic signifi-cance of the mid-lithosphere discontinuity in the continents, Nat. Geosci., 8, 509–514.
Kˆe, T.-s., 1947. Experimental evidence of the viscous behavior of grain boundaries in metals, Phys. Rev., 71(8), 533–546.
Keir, D., Belachew, M., Ebinger, C., Kendall, J.-M., Hammond, J., Stuart, G., Ayele, A. & Rowland, J., 2011. Mapping the evolving strain field during continental breakup from crustal anisotropy in the Afar depression, Nat. Commun., 2, 285.
Keller, G. et al., 1994. The East African rift system in the light of KRISP 90, Tectonophysics, 236, 465–483.
Kennett, B. & Engdahl, E., 1991. Traveltimes for global earthquake location and phase identification, Geophys. J. Int., 105(2), 429–465.
Keranen, K.M., Klemperer, S.L., Julia, J., Lawrence, J.F. & Nyblade, A.A., 2009. Low lower crustal velocity across Ethiopia: Is the main Ethiopian Rift a narrow rift in a hot craton?, Geochemistry, Geophysics, Geosystems, 10(5), Q0AB01, doi:10.1029/2008GC002293.
Koptev, A., Calais, E., Burov, E., Leroy, S. & Gerya, T., 2015. Dual continen-tal rift systems generated by plume-lithosphere interaction, Nat. Geosci., 8(5), 388–392.
Langston, C.A., 1977. The effect of planar dipping structure on source and receiver responses for constant ray parameter, Bull. seism. Soc. Am., 67(4), 1029–1050.
Last, R.J., Nyblade, A.A., Langston, C.A. & Owens, T.J., 1997. Crustal structure of the East African Plateau from receiver functions and Rayleigh wave phase velocities, J. geophys. Res., 102(B11), 24 469–24 483. Lee, H., Muirhead, J.D., Fischer, T.P., Ebinger, C.J., Kattenhorn, S.A., Sharp,
Z.D. & Kianji, G., 2016. Massive and prolonged deep carbon emissions associated with continental rifting, Nat. Geosci., 9, 145–149.
Lee, L., Morris, S. J.S. & Wilkening, J., 2011. Stress concentrations, dif-fusionally accomodated grain boundary sliding and the viscoelasticity of polycrystals, Proc. R. Soc. Lond. A, 467(2130), 1624–1644.
Le Gall, B., Nonnotte, P., Rolet, J., Benoit, M., Guillou, H., Mousseau-Nonnotte, M., Albaric, J. & Deverch`ere, J., 2008. Rift propagation at craton margin.: Distribution of faulting and volcanism in the North Tan-zanian Divergence (East Africa) during Neogene times, Tectonophysics, 448(1), 1–19.
Ligorr´ıa, J.P. & Ammon, C.J., 1999. Iterative deconvolution and receiver-function estimation, Bull. seism. Soc. Am., 89(5), 1395–1400.
Mana, S., Furman, T., Carr, M., Mollel, G., Mortlock, R., Feigenson, M., Turrin, B. & Swisher, C., 2012. Geochronology and geochemistry of the Essimingor volcano: melting of metasomatized lithospheric mantle beneath the North Tanzanian Divergence zone (East African rift), Lithos, 155, 310–325.
Mana, S., Furman, T., Turrin, B.D., Feigenson, M.D. & Swisher, C.C., 2015. Magmatic activity across the East African North Tanzanian Divergence Zone, J. Geol. Soc., 172, 368–389.
Mattsson, H.B., Nandedkar, R.H. & Ulmer, P., 2013. Petrogenesis of the melilititic and nephelinitic rock suites in the Lake Natron–Engaruka monogenetic volcanic field, northern Tanzania, Lithos, 179, 175– 192.
Mollel, G.F., Swisher, C.C., Feigenson, M.D. & Carr, M.J., 2008. Geo-chemical evolution of Ngorongoro Caldera, Northern Tanzania: Implica-tions for crust–magma interaction, Earth planet. Sci. Lett., 271(1), 337– 347.
Mordvinova, V., Deschamps, A., Dugarmaa, T., Dverchre, J., Ulziibat, M., Sankov, V., Artemev, A. & Perrot, J., 2007. Velocity structure of the lithosphere on the 2003 Mongolian-Baikal transect from SV waves, Izv. Phys. Solid Earth, 43(2), 119–129.
Muirhead, J.D., Kattenhorn, S.A. & Le Corvec, N., 2015. Varying styles of magmatic strain accommodation across the East African Rift, Geochem. Geophys. Geosyst., 16(8), 2775–2795.
Mulibo, G. & Nyblade, A., 2009. The 1994–1995 Manyara and Kwamtoro earthquake swarms: Variation in the depth extent of seismicity in Northern Tanzania, South Afr. J. Geol., 112(3–4), 387–404.
Nonnotte, P., Guillou, H., Le Gall, B., Benoit, M., Cotten, J. & Scaillet, S., 2008. New k–ar age determinations of Kilimanjaro volcano in the North Tanzanian diverging rift, East Africa, J. Volcanol. Geotherm. Res., 173(1), 99–112.
O’Donnell, J., Adams, A., Nyblade, A., Mulibo, G. & Tugume, F., 2013. The uppermost mantle shear wave velocity structure of eastern Africa from rayleigh wave tomography: constraints on rift evolution, Geophys. J. Int., 194(2), 961–978.
O’Donnell, J., Selway, K., Nyblade, A., Brazier, R., El Tahir, N. & Durrheim, R., 2016. Thick lithosphere, deep crustal earthquakes and no melt: a triple challenge to understanding extension in the western branch of the East African Rift, Geophys. J. Int., 204(2), 985–998.