HAL Id: cea-02614120
https://hal-cea.archives-ouvertes.fr/cea-02614120
Submitted on 20 May 2020HAL is a multi-disciplinary open access archive for the deposit and dissemination of sci-entific research documents, whether they are pub-lished or not. The documents may come from teaching and research institutions in France or abroad, or from public or private research centers.
L’archive ouverte pluridisciplinaire HAL, est destinée au dépôt et à la diffusion de documents scientifiques de niveau recherche, publiés ou non, émanant des établissements d’enseignement et de recherche français ou étrangers, des laboratoires publics ou privés.
Interpretation of GEDEON-1 and GEDEON-2
gadolinium depletion experimental analysis with the
DARWIN2.3 package
T. Nicol, D. Bernard
To cite this version:
T. Nicol, D. Bernard. Interpretation of GEDEON-1 and GEDEON-2 gadolinium depletion experi-mental analysis with the DARWIN2.3 package. ICNC 2019 -11th International conference on Nuclear Criticality Safety, Sep 2019, Paris, France. �cea-02614120�
ICNC 2019 - 11th International conference on Nuclear Criticality Safety
September 15-20, 2019 – Paris, France
1
Interpretation of GEDEON-1 and GEDEON-2 gadolinium depletion
experimental analysis with the DARWIN2.3 package
Tangi NICOL (1)*, David BERNARD (1) (1)
CEA, DEN, DER, SPRC, Cadarache, F-13108 SAINT-PAUL-LEZ-DURANCE, FRANCE * tangi.nicol@cea.fr
ABSTRACT
In the eighties a two phases experimental program, called GEDEON, was designed at CEA for the validation of gadolinium depletion calculation in a 13 x 13 LWR assembly (3.25% 235U enrichment). In the first experiment, gadolinium pins are enriched with 3.5% of 235U and contained 5% in mass of natural gadolinium. In the second experiment gadolinium support pins are made of depleted uranium (0.2% 235U) and contain 8% in mass of natural gadolinium. DARWIN is an evolution code package developed at CEA in cooperation with industrial companies (EDF, Framatome, Orano) in order to compute physical quantities of radioactivity related to various application fields such as nuclear fuel cycle. This paper presents the first interpretation, with DARWIN2.3 package, of those two experiments with the aim of gadolinium depletion experimental validation of DARWIN. Interpretations are performed using the European evaluation file JEFF-3.1.1 and a 281 group energy mesh. Results show quite good agreements between calculations and measurements, in respect with experimental and calculation uncertainties, especially for 155Gd and 157Gd isotopes depletion.
KEY WORDS
Gadolinium depletion, burnable poison, DARWIN.
1. INTRODUCTION
Burnable poisons incorporated in UO2 fuel rods, such as gadolinium oxide (Gd2O3), give an opportunity to
increase the length of nuclear reactor fuel cycle by allowing the use of higher fuel enrichment. Assemblies incorporating such poisoned fuel rods (up to 8% of Gd2O3) are included in some French core management.
Moreover, such assemblies containing gadolinium loaded pins are planned to be used in the first core of the new EPRTM GEN-3 reactor. Gadolinium depletion, which is faster than fuel depletion, may introduce an
increase of the assembly reactivity. To be able to correctly estimate the occurrence of such reactivity peak, as well as its intensity, it is necessary to have an accurate evaluation of the gadolinium isotopes neutron capture behavior. The latter requires a rigorous experimental validation of gadolinium isotopes depletion calculation. The GEDEON two phases experimental program was held in the frame of qualification studies of neutron calculation of assemblies containing pins loaded with gadolinium oxide as burnable poison [1] [2] [3]. Those experiments took place at the MELUSINE research reactor located at CEA/Grenoble, from November 1982 to February 1984, and from May 1985 to March 1988. The aim of GEDEON-1 [2] was the qualification of
155Gd and 157Gd depletion in isolated gadolinium pins, up to an assembly burnup of 10 GWj/t. GEDEON-2
[3] was designed to qualify, up to an assembly burnup of 13 GWj/t, the azimuthal effects of adjacent gadolinium rods and the presence of water holes in front or in the angle of such gadolinium rods. Both experiments, GEDEON-1 and GEDEON-2, were performed on a 13x13 PWR assembly (UO2 enriched with
3.25% 235U) containing several UO
2-Gd2O3 pins. In the first experiment assembly, irradiated up to a burnup
of 10 GWj/t, gadolinium pins were also made with UO2 enriched with 3.25% of 235U and contained 5% of
natural gadolinium. In the second experiment assembly, irradiated up to a burnup of 13 GWj/t, gadolinium pins were made of depleted uranium (0.2% of 235U) and contained 8% of natural gadolinium.
2
Those two experiments have been previously interpreted with the deterministic code APOLLO2.8 [4], associated with the nuclear data base JEFF-3.1.1 [5], showing a good agreement between measured and calculated gadolinium depletion [2] [3].
This paper describes the first interpretation of those experiments using the last version of the French reference package for fuel cycle studies, DARWIN2.3 [6], with the aim of its experimental validation regarding gadolinium depletion. In addition of gadolinium isotopes depletion analyses, calculation of major actinides concentrations (uranium isotopes in GEDEON-1 and -2, and plutonium isotopes in GEDEON-1), was also compared with measurements. The latters were also measured in a so called monitor pins (located near the centre of the assembly), and in UO2 pin adjacent to the gadolinium one. Since neodymium fission
products (148Nd, 150Nd, 145Nd and 146Nd) are considered directly proportional to the number of fissions, their
concentrations, in the monitor pin, were used to calibrate calculation assemblies’ power during irradiation. Analyses of the adjacent UO2 give an indication on the flux depletion around the gadolinium pins.
This paper presents the experimental data of GEDEON-1 and GEDEON-2 experiments, the DARWIN2.3 package and the calculation hypothesis. Then comparisons between calculation and measurement are presented and discussed.
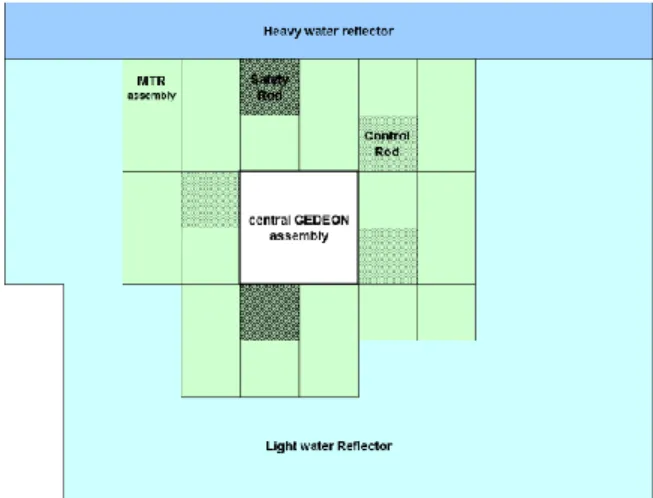
2. EXPERIMENTAL DATA a. MELUSINE reactor
MELUSINE was an 8 MWth experimental reactor located at CEA Grenoble, and was dismantled in 2002. Experimental assembly was placed in the centre of the MELUSINE driver core made of MTR assemblies (Material Test Reactor made of highly enriched Uranium–Alloy plates), surrounded by a D2O and H2O
reflector, as shown in Figure 1.
Figure 1: Radial cross section of MELUSINE reactor b. GEDEON experiments
Central assemblies from GEDEON-1 and GEDEON-2 experimental programs are illustrated in Figure 2. They are both based on a regular 13 x 13 square pattern supported by a stainless steel box, AG3 structural elements (tie rods, plates), and surrounded by water.
3
Figure 2 : GEDEON-1 (on the left) and GEDEON-2 (on the right) assemblies
Three and four successive discharges were considered respectively for GEDEON-1 and GEDEON-2 experiments. At each discharge, a set of several pins is removed and replaced in successive quadrants of the assemblies. These removed pins are then chemically analysed by Inductive-Coupling-Plasma and Mass Spectrometry. Moreover, two fissile heights were analysed for most of the rods: 270 mm from the bottom of the active fuel (mid height), and 100 mm in order to obtain a lower burnup. Gadolinium pins from GEDEON-2 assembly are located either near a water hole (face or angle) or another gadolinium pin. Based on usual PWR gadolinium assemblies’ configuration, where most of gadolinium pins are located near a water hole (angle), only analyses of gadolinium pins in such a position in the GEDEON-2 assembly are considered in this study.
For the GEDEON-1 experiment, since no precise history of irradiation is available, irradiation is supposed continuous for each cycle without any cooling time between cycles. For GEDEON-2, irradiation is also supposed continuous for each cycle, and cooling times between cycles are provided. Table I resumes the irradiation time and assembly BU corresponding to each cycle, and the cooling time, when it is available, between cycles and between extraction and analyses of the different UO2 (monitor and adjacent) and
UO2-Gd2O3 (gadolinium) pins.
Table I : Irradiation time (supposed to be continuous), and cooling time associated with each GEDEON-1 and GEDEON-2 irradiation cycle
GEDEON-2 GEDEON-1
Assembly BU (GWd/t)
Time (days)
Cooling time (days)
Assembly BU (GWd/t)
Time (days)
Cooling time (days)
Monitor Adjacent Monitor Adjacent Gado
Cycle 1 ≈ 3.5 171 434 455 ≈ 3.0 134 199 200 203 Inter-cycle 251 Cycle 2 ≈ 7.0 192 385 503 ≈ 6.4 196 150 172 152 Inter-cycle 23 Cycle 3 ≈ 10.0 179 1105 1137 ≈ 8.9 91 412 362 316 Inter-cycle 11 Cycle 4 ≈ 13.0 114 1692 1643
3. CALCULATION TOOL AND MODELS a. The DARWIN2.3 package
The DARWIN package [6] is the French reference calculation package for the fuel cycles of all types of reactors (PWR, BWR, FBR, advanced reactor) and fuels (UOX, MOX, innovative fuels). It has been developed by CEA and its French partners (EDF, Framatome, Orano) to estimate the physical quantities (material balance; decay heat; activity; neutron, alpha, beta and gamma sources and spectra; radiotoxicity)
4
which characterized reactors spent fuels. DARWIN is also used in the back-end cycle for actinide incineration or long-term interim storage studies.
b. Calculation scheme description
The optimized and validated REL2005 scheme for LWR calculation is based on the APOLLO2.8 code developed by the CEA [4]. In the specific case of fuel cycle studies, a consistent scheme CYCLE2008 has been developed and validated using the benefit of the validation program of the REL2005 scheme. It should be noted that the accuracy of the DARWIN results depends mainly on the APOLLO2 assembly calculation. The CYCLE2008, uses the CEA2005 cross-section library in a 281-group-structure Santamarina-Hfaiedh energy mesh [7] (SHEM) processed from the JEFF-3.1.1 evaluation [5]. Neutron energy spectrum is first calculated in a 2-D assembly geometry, using a Pij multicell model. The fuel pellets are split into four rings, and the gadolinium one into 6 rings because of the very high capture cross section of gadolinium. Local spectrum calculation is performed in the SHEM 281-energy-group structure. Space-dependent self-shielding (used only >23 eV, which is the upper limit of the fine mesh in SHEM) is repeated at the recommended burnup steps, optimized consistently with the REL2005 recommendations (0, 4, 8, 12 and every 12 GWd/t), as well as at every change of core parameter (case of detailed cycle monitoring). Then the Method Of Characteristic solvers (MOC) flux calculation is performed using a precise 2-D geometry. Refined burnup steps are used for the depletion calculation based on the MOC flux (in MWd/t : 0, 9.375, 18.75, 37.5, 75, 112.5, 150, 237.5, 325, 412.5, 500, 625, 750, 1000, steps of 250 up to 2000, steps of 500 up to 20000, and then a step every 2000). Additional steps corresponding to the burnup at the end of each cycle are added. Because of convergence issues, the evolution step following the latter is subdivided into three smaller steps. The PEPIN2 depletion module then uses the results provided by APOLLO2, i.e. self-shielded cross sections and multigroup spectra, to produce the collapsed library with burnup-dependent cross sections, required in order to characterize the isotopes described in the depletion chains.
c. Calculation geometry description
Because of self-shielding treatment in APOLLO2, all various pins are considered at the same effective temperature. The pellet cladding is made of zircaloy. For the self-shielding calculation, gadolinium cells and cells around, cells on assembly periphery and the monitor cell are calculated individually. The water around the assembly is homogenized with the stainless steel assembly support and AG3 plates. The whole reflector is considered as light water, without heavy water. The MTR buffer zone is made of UAl plates enriched with 93.5% of 235U. To reduce time calculation, the latter is replaced by an homogeneous medium corresponding
to an average burnt UAl assembly containing traces of majors fission products. Analyzed pins are made of :
- Enriched UO2 with 3.25% 235U for GEDEON-1 and GEDEON-2 (monitor and adjacent pins)
- Gd2O3 with enriched UO2 with 3.25% 235U and 5% of natural gadolinium for GEDEON-1
- Gd2O3 with depleted UO2 with 0.2% 235U and 8% of natural gadolinium for GEDEON-2
Due to experimental conditions, GEDEON-1 assembly is simulated with APOLLO2 with a 1/8 symmetry, see Figure 3. Because of some pins displacement during GEDEON-2 experimental program, as illustrated on the same figure, the whole assembly and core are modeled. Reflector and MTR buffer zone are supposed to be symmetrical.
5
Figure 3. APOLLO2 calculation geometries (GEDEON-1 on the left, GEDEON-2 on the right).
4. ANALYSES INTERPRETATION a. Burnup calibration from monitor fuel pins
Neodymium isotopes, 145Nd, 146Nd, 148Nd and 150Nd, are stable (or at least with a period longer than 1018
years), are mainly produced by fission, and with a negligible capture rate. Furthermore, their cumulated fission rates have very small uncertainties (about 1 to 3%). For all these reasons, they are good burnup indicators, and thus are used to calibrate assembly power through the corresponding irradiation time. Equation (1) gives the expression of the recommended burnup calibration factor.
𝐹 =1 4[ 𝐶148𝑁𝑑 𝐸148𝑁𝑑+ 𝐶150𝑁𝑑 𝐸150𝑁𝑑+ 2 × ( 𝐶145𝑁𝑑+ 𝐶146𝑁𝑑 𝐸145𝑁𝑑+ 𝐸146𝑁𝑑)] (1)
With CX and EX the calculated and measured concentrations of the isotope X.
Preliminary studies of GEDEON-1 experiment, point out some issues with 150Nd analyses [2], especially for
the first cycles. To avoid any bias, this isotope is not considered in the calibration factor for the first cycles of GEDEON-1. Otherwise, all four isotopes were used when measurements were available. When no experimental neodymium isotopes concentrations are available (which is the case for some GEDEON-2 measurements), the 235U isotope concentration is chosen for burnup calibration. All assembly burnup, after
calibration, are presented in Table II.
Table II : GEDEON-1 and -2 assembly burnup corresponding to 100 mm and 270 mm samples height, after neodymium calibration from monitor pins.
GEDEON-1 GEDEON-2
Assembly BU (GWd/t) Cycle 1 Cycle 2 Cycle 3 Cycle 1 Cycle 2 Cycle 3 Cycle 4 100 mm 2.8 5.8 8.1 3.9 6.9 9.3 11.1 270 mm 3.2 7.0 9.6 4.6 7.7 10.7 12.8
Calculation/experiment ratio observed on 145Nd, 146Nd and 148Nd isotopes (< 1%) for monitors pins show that
burnup calibration is correct. As mentioned previously, strong underestimation of 150Nd isotope for the two
first cycles of GEDEON-1 (about 8%), much higher than usually observed in such interpretations, may raise questions about the accuracy of the measurement.
6 b. Calculation/experiment ratio uncertainties Calculation/experiment ratio uncertainties are related to :
- Experimental uncertainty of chemical analyses,
- Initial isotopic composition uncertainty on 235U, 155Gd, 157Gd et Gd
tot, from experimental report
(respectively 0.15%, 0.14%, 0.13%, and 0.4% in relative, at 1σ),
- Temperature uncertainty on fuel (Tcomb ± 50°C, at 1σ) and moderator (Tmod ± 2°C, at 1σ): generally
accepted upper values for the uncertainties of codes solving heat equations,
- Burnup (BU) calibration uncertainty from calculation/experiment ratio of neodymium isotope concentration commonly considered about 2% at 1σ.
The relative calculation/experiment ratio uncertainty associated to each parameters listed above is determined by direct perturbation in APOLLO2 calculation. The relative calculation/experiment ratio variation is then associated to the uncertainty due to the corresponding perturbed parameter. Since all uncertainty sources are considered independent, the total uncertainty on the relative calculation/experiment ratio is obtained by a quadratic sum. The total calculation/experiment ratio uncertainty is mainly due to the 2% BU uncertainty, except for 234U isotope in GEDEON-2 gadolinium pin where the main source of
uncertainty is the experimental uncertainty (>10%). c. Calculation to experiment comparison
The whole calculation/experiment ratios are shown in Erreur ! Source du renvoi introuvable., Figure 5, and Figure 6. Uncertainties are given at 1σ. Measurements of gadolinium isotopes concentration are expressed relatively to the total gadolinium concentration in case of GEDEON-1, or relatively to the 160Gd
isotope concentration in case of GEDEON-2, and then cannot be normalized to 238U isotope as all the other
isotope ratios. Even if 160Gd and Gd
tot concentrations are not significantly varying during irradiation (of
about 1% according to calculations), these normalizations might introduced some bias if the corresponding concentrations are not precisely known.
Figure 4. Uranium isotopes calculation/experiment relative ratio for GEDEON-1 (G1) and GEDEON-2 (G2)
235U isotope is well reproduced by calculation.
234U isotope, which is well reproduced by calculation for GEDEON-1, is overestimated by about 4% ± 1% in
case of GEDEON-2 UO2 pins and underestimated by about 20% ± 20% for GEDEON-2 gadolinium pins.
Nevertheless the observed overestimation in UO2 pins is consistent with some UOX fuel analyses from the
DARWIN experimental validation report [8], and is probably due to lack of knowledge of the exact initial concentration. Indeed, the experimental validation report shows that in the case of well-known initial conditions, this isotope is well reproduced. For the gadolinium pin, the significant calculation/experiment ratio uncertainty is due to the 10% to 30% experimental uncertainty on 234U relative concentration.
7
236U isotope from GEDEON-2 pins seems to be underestimated especially as the burnup is low (7% ± 2% for
UO2 pin, up to 73% ± 3% for gadolinium pin), which may be due to an underestimation of 235U neutron
capture rate. Since DARWIN experimental validation report shows that 236U is well estimated thanks to the
reevaluation of 235U capture cross section in JEFF3.1.1, a 235U neutron capture rate underestimation might be
linked to neutron flux calculation. Another reason may also be, as for 234U, a lack of knowledge of the exact
initial concentration.
Figure 5. Plutonium isotopes calculation/experiment relative ratios for GEDEON-1 (G1) and GEDEON-2 (G2)
No plutonium isotopes measurements have been performed in gadolinium pins from GEDEON-2. On the opposite of the UO2 pins, plutonium isotopes are overestimated by about 4% ± 2% in GEDEON-1
gadolinium pins. This overestimation may be caused by the definition of a too high temperature in the gadolinium pins (decreasing the effective temperature in the fuel induces plutonium overestimation reduction) [2]. This is indeed consistent with the observed decreasing of the plutonium overestimation for highest burnup (gadolinium depletion results in an increasing of the fission rate and then then of the temperature). Plutonium isotopes are mostly underestimated in UO2 pins, especially for the highest atomic
numbers.
239Pu and 240Pu, underestimated between 2% and 4% in case of GEDEON-1, are well estimated in the case of
GEDEON-2 except for pin BU of about 6, 7 and 12 GWj/t. For the first BU value, which corresponds to a monitor pin, the discrepancy between calculations and measurements might be due to BU calibration based on 235U concentration since no neodymium measurements were available. The two other BU values
correspond to pins adjacent to gadolinium. These discrepancies between measurement and calculation are consistent with discrepancies on neodymium isotopes from those same adjacent pins (overestimation of about 3%). While assembly burnup seems to be well calibrated from monitor pin neodymium isotopes, it appears that calculations do not correctly reproduce the burnup in the adjacent pin in the case of GEDEON-2. 241Pu and 242Pu isotopes are mostly underestimated (between 5% and 10%). Nevertheless, due to their
strong sensitivities to burnup calibration, the calculation/experiment ratio uncertainty is also high (of about 5% and 7% respectively for 241Pu and 242Pu).
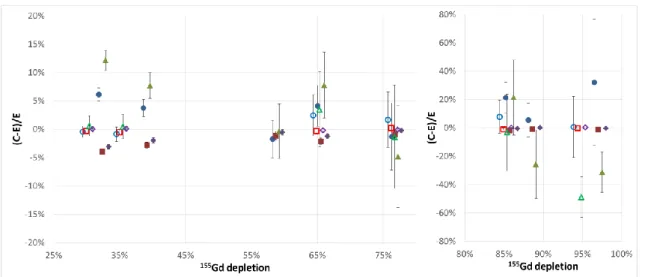
As for the main absorbing gadolinium isotopes, 155Gd and 157Gd, calculations are consistent with
measurement for 1 first cycle. The even gadolinium isotopes are well estimated for all GEDEON-1 cycles, as for the three last cycles of GEDEON-2. For the latter, an underestimation of about 2% to 4% of
156Gd and 158Gd concentrations is observed for the first cycle. This is consistent with overestimation of 155Gd
and 157Gd isotopes concentrations, and probably due to an underestimation of the thermal neutron flux at the
gadolinium pin. The latter might be due to the 2D calculation which does not take into account control rods insertion close to the assembly at beginning of irradiation [3]. For the highest burnup, significant discrepancies between calculation and experiment are observed for odd gadolinium isotopes, but with significant uncertainties (up to 45%). Nevertheless, one can notice that for both experiments, GEDEON-1 and -2, the uncertainty on the calculation/experiment ratio for 157Gd isotope is too low to explain the full
8
Figure 6. Main gadolinium isotopes calculation/experiment relative ratios for GEDEON-1 (G1) and GEDEON-2 (G2)
However, the latter are associated to very small amount of 155Gd and 157Gd gadolinium isotopes. As the latter
becoming smaller and smaller during irradiation, a calculation/experiment ratio is calculated on the relative depletion of these isotopes. The same parameter is also calculated for even isotopes (156Gd and 158Gd). The
calculated depletion (Dc), for the burnup BU, and for the isotope X is expressed as shown in equation:
𝐷𝑐𝑋𝐺𝑑(𝐵𝑈) =
𝐶𝑋𝐺𝑑(𝐵𝑈) − 𝐶𝑋𝐺𝑑(0)
𝐶𝑋𝐺𝑑(0) (2)
As the experimental gadolinium depletion was not measured, then experimental relative concentration at the burnup (BU) has been normalized using equation (3), A being Gdtot or 160Gd for GEDEON-1 and
GEDEON-2 respectively. 𝐷𝐸𝑋𝐺𝑑(𝐵𝑈) = 𝐸𝑋𝐺𝑑(𝐵𝑈) 𝐸𝐴(𝐵𝑈) × 𝐶𝐴(𝐵𝑈) 𝐶𝐴(0) − 𝐸𝑋𝐺𝑑(0) 𝐸𝐴(0) 𝐸𝑋𝐺𝑑(0) 𝐸𝐴(0) (3)
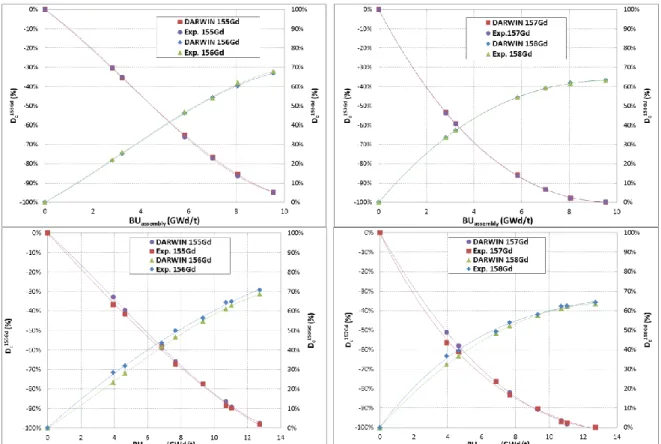
𝐷𝑐𝑋𝐺𝑑 and 𝐷𝐸𝑋𝐺𝑑, for 155Gd, 156Gd, 157Gd and 158Gd isotopes, are represented in Figure 7, as a function of the
assembly burnup.
In case of GEDEON-1, gadolinium depletion is quite well reproduced. In case of GEDEON-2 calculation, depletion of odd isotopes is well estimated, except a highest underestimation for the lowest burnup. Depletion is not very sensitive to capture cross sections (≈ 0.1% / %), this underestimation of the capture rate indicates a possible underestimation of the thermal flux near gadolinium pins at the beginning of irradiation. The latter is consistent with the underestimation of gadolinium even isotope production. For highest burnup, except for the 156Gd depletion underestimate about 2%, calculations are in agreement with experiment.
9
Figure 7. Calculated and measurement depletion/production of main gadolinium isotopes (155Gd, 156Gd, 157Gd and 158Gd), in %, as a function of the assembly burnup (GEDEON-1 on top and
GEDEON-2 at the bottom).
All the results presented in this paper are consistent with previous GEDEON-1 and GEDEON-2 interpretation using APPOLO2.8/JEFF3.1.1 [2] [3].
5. CONCLUSION
This paper summaries the interpretation of GEDEON-1 and GEDEON-2 experiment for gadolinium depletion experimental validation of DARWIN2.3 package. Analyses are performed from a 13 × 13 UO2
assembly containing several gadolinium pins, irradiated in the MELUSINE reactor. At several burnup steps, three pins (one central UO2 for burnup calibration, one UO2 adjacent to a gadolinium pin and one gadolinium
pin) are removed and chemically analyzed. For almost each analyzed pin, two samples are collected (at mid-height and at the bottom of the pin). Isotopes concentrations are expressed relatively to 238U concentration,
except gadolinium isotopes which are normalized to the total gadolinium for GEDEON-1 and 160Gd for
GEDEON-2.
Calculations are performed using DARWIN2.3 package. As the flux in the MTR buffer zone of the MELUSINE core needs to be precisely estimated, a two steps calculation scheme is used:
- JEFF-3.1.1 nuclear data.
- Neutron calculation using APOLLO2.8-4 with two steps calculation, Pij flux and self-shielded cross section calculation followed by method of characteristics (MOC) flux calcualtion, using a 281 group energy mesh,
- Depletion calculation using DARWIN/PEPIN2.4.2,
Uranium isotopes calculations are globally consistent with experiments, the main discrepancies probably coming from lack of knowledge of the precise initial concentration, as well as maybe some underestimation of 235U capture rate at the beginning of the irradiation. Plutonium isotopes are mostly underestimated by
calculation as much as their atomic number is high. For the GEDEON-2 experiment, discrepancies are observed for main plutonium isotopes in adjacent UO2 pins, which is most likely due to incorrect local
burnup calculations, as the same discrepancies are observed on neodymium isotopes. The power profile in the GEDEON-2 assembly may not be correctly calculated. In case of gadolinium pins, the more significant
10
discrepancy observed between calculation and experiment of plutonium isotopes probably come from the use of too high temperature in those pins. For burnup close to the lowest burnup from DARWIN2.3 experimental validation report (last GEDEON cycle), uranium and plutonium calculation/experiment ratio are consistent with value from the report [8].
Globally, even gadolinium isotopes are well calculated, except for the first cycle of GEDEON-2 where the overestimation of odd isotopes reflecting an underestimation of gadolinium capture rate and then of even isotopes production. The significant reduction of 155Gd and 157Gd isotopes concentration during irradiation,
and their sensitivity to the burnup, leads to focus on the depletion of those isotopes.
This work shows the reasonable performances of DARWIN2.3 for gadolinium depletion calculation, except the first cycle of GEDEON-2 first cycle, showing an underestimation of odd gadolinium isotopes depletion (associated with an underestimation of corresponding even isotopes production), probably due to underestimation of thermal neutron flux at gadolinium pin. The mean calculation/experiment depletion ratio of 155Gd and 157Gd is about - 0.1% ± 1.4% and - 0.2 ± 0.5% in case of GEDEON-1, and - 1.3% ± 1.5%
and - 1.1 ± 2.1 % in case of GEDEON-2.
For this interpretation using DARWIN2.3, the CYCLE2008-REP scheme has been adapted to take into account the MELUSINE axial heterogeneity. It may be interesting to consider future interpretation from PWR gadolinium pin at low burnup. The latter may allow the use of the PWR CYCLE2008-REP scheme from DARWIN2.3 package on a pin representative of those usually used in PWR (8-10% Gd and 2-3% 235U
enrichment) confirming the results from GEDEON-1 (5% Gd and 3.25% 235U enrichment) and GEDEON-2
(8% Gd and 0.2% 235U enrichment). Such pin should be measured by SCKCEN research center in the frame
on international collaboration called REGAL (Rod-Extremity and Gadolinia AnaLysis).
ACKNOWLEDGMENTS
The authors wish to thank ORANO and EDF for their partial financial support. REFERENCES
[1] P. Chaucheprat, A. Santamarina, “Qualification of the UO2-Gd 2 O 3 Depletion Calculation through the GEDEON Experiments,” Proc. Int. Conf. on Advances in Reactor Physics, Paris, France, April 27-30, Vol. 1, pp. 199 (1987).
[2] P. Blaise, N. Dos Santos, “Interpretation of GEDEON1 experiment in MELUSINE for the validation of gadolinium depletion calculation using the APOLLO2.8/CEA2005V4.1 code package,” Conf. on Physics
and Technology of Reactors and Application, PHYTRA2, Fez, Morocco, September 26-28, (2011).
[3] D. Bernard, A. Santamarina, “Qualification of gadolinium burnable poison: Interpretation of MELUSINE/GEDON-II spent fuel analysis,” Annals of Nuclear Energy, Vol. 87, pp. 21-33 (2016).
[4] A. Santamarina, D. Bernard et al., “APOLLO2.8: A validated code package for PWR neutronics calculations,” Proc. Int. Conf. on Advances in Nuclear Fuel Management, Hilton Head Island, South Carolina, USA, April 12-15, (2009).
[5] A. Santamarina et al., “The JEFF-3.1.1 Nuclear Data Library NEA Data Bank,” JEFF Report 22, OECD-NEA data bank (2009).
[6] A. Tsilanizara et al., “DARWIN: An Evolution Code System for a Large Range of Applications,”
Journal of Nuclear Science and Technology, Vol. 37, pp. 845-849 (2014).
[7] N. Hfaiedh, A. Santamarina, “Determination of the Optimized SHEM mesh for Neutron Transport Calculation,” Proc. Int. Conf. of Math. and Comp., M&C, Avignon, France, September 12-15 (2005). [8] L. San-Felice, R. Eschbach, P. Bourdot, “Experimental validation of the DARWIN2.3 package for fuel cycle applications,” Nuclear Technology, Vol. 184, pp. 217-232 (2013).