HAL Id: tel-01280751
https://tel.archives-ouvertes.fr/tel-01280751
Submitted on 1 Mar 2016HAL is a multi-disciplinary open access
archive for the deposit and dissemination of sci-entific research documents, whether they are pub-lished or not. The documents may come from teaching and research institutions in France or abroad, or from public or private research centers.
L’archive ouverte pluridisciplinaire HAL, est destinée au dépôt et à la diffusion de documents scientifiques de niveau recherche, publiés ou non, émanant des établissements d’enseignement et de recherche français ou étrangers, des laboratoires publics ou privés.
Identifier les variations conduisant au cancer dans le
génome non codant et du transcriptome
Jia Li
To cite this version:
Jia Li. Identifier les variations conduisant au cancer dans le génome non codant et du transcriptome. Bio-informatique [q-bio.QM]. Université Paris-Saclay, 2015. Français. �NNT : 2015SACLS161�. �tel-01280751�
1
UNIVERSITE PARIS SACLAY (Paris 11)
ECOLE DOCTORALE : (Structure et Dynamique des Systèmes Vivants)
DOCTORAT
Bioinformatique
Thèse soutenue pour l‟obtention
du diplôme de doctorat par
Jia LI
Identifier les variations conduisant au cancer dans le génome et
transcriptome non codant
Thèse dirigée par : Professor. Daniel GAUTHERET
Soutenue le Lundi 14 Décembre 2015
JURY
Dr. Salvatore Spicuglia,
Rapporteur
Dr. Andrei Zinovyev,
Rapporteur
Dr. Hugues Roest Crollius,
Examinateur
Pr. Olivier Lespinet,
Examinateur
Pr. Daniel Gautheret,
Directeur de thèse
2
Acknowledgments
First of all, I would like to thank Pr. Daniel GAUTHERET, he accepted and supported my PhD application four years ago. Thanks for his contribution to our study, we have faced countless problems and difficulties when carrying out this work, his competent supervision and enthusiasm made our scientific hypothesis become achievable. Without his guidance and instruction, my thesis could not reach its present form.
I would like to express my heartfelt gratitude to my previous colleagues Zohra SACI, and Cecile PEREIRA. They gave me great help on Perl, R programming studies. Especially,
Zohra SACI assisted me in learning linux command lines, perl programming and using various packages for RNA-seq analysis. Her selfless help made me quickly and successfully transit from a newbie on bioinformatics to a capable computational biologist, which greatly contributes to the success of my PhD study.
I also would like to express gratitude to my colleagues Marie-Anne Poursat, Damien Drubay, Stefan Michiels. Marie-Anne Poursat advised us how to correctly train and validate
a random forest model, which is a critical part of our study. Damien Drubay and Stefan Michiels provided lots of useful suggestion to further improve the current study.
I also want to express gratitude to my colleagues Claire TOFFANO-NIOCHE, Jean LEHMANN, Fabrice LECLERC, Nicolas CHEVROLLIER, Marc GABRIEL. They
gave me a lot of help and suggestion in my life, in particular, Claire TOFFANO-NIOCHE, she helped me a lot deal with various life-related problems, such as application of titre de séjour and buying medical insurance. I also want to thank my Chinese friend, Ji WANG, for his help during my PhD study in France.
Most importantly, thanks to the financial support of the China Scholarship Council (CSC) to complete my thesis in France.
At last, I want to give my sincere thanks to my family members, my father, mother and younger brother, for their caring, support and encouragement in the past three and half years.
3
Index
Index ... 3
Abbreviations ... 6
Chapter 1- Introduction ... 8
1.1 Prioritizing coding variants ... 11
1.1.1 Probabilistic models ... 11
1.1.2 Machine learning models ... 12
1.1.3 Hybrid models ... 13
1.1.4 Comparing coding mutation scoring tools ... 14
1.2 Integrating recurrence for driver prediction ... 16
1.3 Non-coding elements and cancer ... 20
1.4 Prioritizing non-coding variants ... 23
1.4.1 Empirical scoring systems ... 23
1.4.2 Machine-learning models ... 24
1.4.3 Comparing non-coding variant scoring tools ... 26
1.5 Conclusion... 28
Chapter 2 – Non-coding driver mutations ... 31
2.1 Summary ... 32
2.2 Introduction ... 33
2.3 Results ... 35
2.3.1 Scoring mutations with the germline (SNP) model ... 36
2.3.2 Scoring mutations with the somatic (SOM) model ... 38
2.3.3 Towards an integrated model for germline and somatic mutations ... 42
2.4 Discussion ... 45
2.5 Materials and Methods ... 47
2.5.1 Human polymorphism, mutation and disease data ... 47
2.5.2 Uniform genome-wide features ... 48
2.5.3 Tissue-specific features ... 50
4
2.5.5 Somatic mutation model ... 51
2.5.6 Enrichment analysis ... 52
Chapter 3 –LncRNAs and cancer ... 53
3.1 Introduction ... 54
3.2 LncRNAs and proliferation ... 56
3.3 LncRNAs and invasion and metastasis... 58
3.4 LncRNAs and apoptosis... 60
3.5 LncRNAs and cell cycle ... 63
3.6 Development of computational tools for functional lncRNA prediction ... 67
3.6.1 Recurrent Somatic Copy-number Alteration-based Approach ... 68
3.6.2 Coexpression with Coding Genes Approach ... 68
3.6.3 Network-based systems ... 69
3.6.4 Interaction with Proteins and miRNAs Approach ... 69
Chapter 4 – A Permutation-based model for lncRNA driver search ... 73
4.1 Introduction ... 74
4.2 Results ... 74
4.2.1 Validation of the permutation-based model on cancer genes and lncRNAs ... 74
4.2.2 General characteristics of driver candidates ... 77
4.2.3 LncRNA driver candidates harboring enriched conserved elements ... 78
4.2.4 LncRNA driver candidates enriched for disease-associated variants ... 81
4.2.5 Expression analysis of lncRNAs in lung cancer ... 82
4.3 Discussion ... 84
4.4 Methods and materials ... 85
4.4.1 Cancer mutation, disease-causing variants, lncRNAs and cancer gene and lncRNA data ... 85
4.4.2 Scoring non-coding variants ... 86
4.4.3 The permutation-based model... 86
4.4.4 RNA-seq data processing and expression analyses of lncRNAs ... 87
4.4.5 Enrichment analysis ... 87
4.4.6 Statistical analyses ... 88
5
5.1 General conclusion ... 90
5.2 Perspectives ... 92
5.2.1 Refinement of the SOM and SNP models ... 92
5.2.2 Integrating SNP and SOM scores to form a combined score ... 92
5.2.3 Functional analysis of cancer lncRNA candidates ... 92
5.2.4 Setting up an user-friendly website ... 93
Chapter 6 -Appendix... 94
6.1 Supplementary Figures ... 95
6.2 Supplemental Tables ... 108
6.3 Supplemental Methods ... 125
6.4 1-Publication in Cancer Letters ... 131
6.5 2-Publication in PLoS Computational Biology ... 132
6
Abbreviations
CLL: Chronic Lymphocytic Leukemia
RF: Random Forest
VSURF: Variable Selection Using Random Forests
SNP: Single-Nucleotide Polymorphism
SOM: Somatic Mutation
HGMD: The Human Gene Mutation Database
Clivariant: Clinical Variant
GWAS: Genome-wide association study
ENCODE: The Encyclopedia of DNA Elements
COSMIC: Catalogue of Somatic Mutations in Cancer
CDS: Coding DNA Sequence
UTR: Untranslated Region
ncExon: Non Coding Exon
CR: Conserved Region
cTFBS: Conserved Transcription Factor Binding Site
TFBS: Transcription Factor Binding Site
DNase: DNase I Hypersensitive Site
ECS: Evolutionary Conserved RNA Structure
RR: Recombination Rate
HE: High Expression
LE: Low Expression
ER: Early Replication
7 DNA met: DNA Methylation
LncRNA: Long non coding RNA
ncRNA: Non coding RNA
miRNA: microRNA
PC gene: Protein Coding Gene
RPKM: Reads Per Kilobase per Million mapped reads
FPKM: Fragments Per Kilobase Of Exon Per Million Fragments Mapped
FDR: False Discovery Rate
FI: Function Impact
RMG: Recurrently Mutated Gene
CADD: Combined Annotation Dependent Depletion
8
Chapter 1-
Introduction
Results presented here are published in Сancer Letters (Appendix 1)
Mining the coding and non-coding genome for cancer drivers
.
LI J, Drubay D, Michiels S, Gautheret D. Cancer Lett. 2015. 369(2):307-15.
Author contribution:
Jia LI firstly wrote the manuscript and professor Daniel Gautheret further revised the paper. Damien Drubay and Michiel Stephan gave their suggestion and comments to the work. At last, Jia LI was in charge of the final preparation and revision of this paper.
9
Cancer is caused by the accumulation of genetic alterations and consequent disruption of cell functions. Over the past decade, the introduction of fast and relatively inexpensive sequencing methods has provided unprecedented opportunity to characterize cancer genomic landscapes. A variety of bioinformatics tools are now available to discover genetic variations from high throughput sequencing of tumor DNA, such as GATK (DePristo et al., 2011), CRISP(Bansal, 2010), LoFreq (Wilm et al., 2012), VarScan 2 (Koboldt et al., 2012), and SNVer (Z. Wei et al., 2011), which have been recently evaluated (Pabinger et al., 2014) and (H. W. Huang et al., 2015). Depending on cancer type, tumors harbor hundreds to tens of thousands of somatic mutations, most of which are located in the non-coding portion of the genome (Lawrence et al., 2013). However, not all somatic mutations have their contributions to cancer development, they are generally divided into two main classes: the „driver‟ and „passenger‟ mutations. The former is causally involved in the carcinogenesis, in which it confers selective growth
advantage to cancer cells and is under positive selection in the cancer microenvironment. The latter is the somatic mutation which couldn‟t give growth superiority to cancer cells and hasn‟t been positively selected, therefore, it plays little role in cancer formation and
progression. Driver mutation might not be necessary for the maintenance of the final cancer but has to be selected during the cancer-evolving process. Cells which carry driver mutations and functionally inert passenger mutations undergo clonal expansion, eventually, forming the final cancer (Stratton et al., 2009). Cancer driver genes are genes which carry these driver mutations and are critical to cancer formation. They are classified into three main categories: (1) genes whose non-synonymous mutation rate is significantly greater than a background mutation rate(Lawrence et al., 2013); (2) genes accumulate mutations with high functional impact (FM bias) (Gonzalez-Perez and Lopez-Bigas, 2012); (3) genes display a higher rate of high-scoring non-synonymous mutations than silent and intronic mutations(Hodis et al., 2012) .
A critical challenge in cancer genomics study is to distinguish “driver” mutations and cancer genes that are responsible for cancer development upon specific alterations from “passenger” mutations that are mere results of the cancerous process. A number of reviews provide guidelines for the discovery of cancer-causing variants (MacArthur et al., 2014; Moreau and Tranchevent, 2012). The most common strategy is first to prioritize non-synonymous variants
10
in protein-coding regions and then seek recurrently mutated genes in a cohort of cancer patients (Chapman et al., 2011; Ding et al., 2008; Gui et al., 2011; Wang et al., 2011; X. Wei et al., 2011). Diverse computational methods have been explored to prioritize
non-synonymous variants with respect to their disease-causing potential. Most are based on the assumption that coding mutations impacting functionally important residues, as inferred from evolutionary conservation and protein domain analysis, are more likely damaging (Vitkup et al., 2003). Other software, used in conjunction with these scoring systems, performs
recurrence search in patient cohorts. Currently, 547 cancer genes are described in the COSMIC catalogue of somatic mutations in cancer (version 71) (Forbes et al., 2011a).
The immense majority of the human genome (98%) is non-coding, and consequently most somatic mutations/alterations observed in tumors occur in this non-coding fraction. Because non-coding mutations are more difficult to interpret, these regions have been mostly
discounted from the wider search for driver mutations. However, mutations in non-coding regions can have a profound impact on cell fate. Indeed, functional regions in the non-coding genome include mRNA splice sites, UTR regulation elements, promoters, transcription factor binding sites, enhancers and a wide variety of non-coding RNA (ncRNA) genes. Among ncRNA genes, one particular class is now receiving focused attention due to its vast extent: long non-coding RNA (lncRNA). According to the latest estimate (Iyer et al., 2015), over 58,000 lncRNA genes are expressed in the human genome, which makes this class the biggest contributor to the “black matter” transcriptome.
There is ample evidence for disease-related mutations in the non-coding genome. A large fraction of disease or trait-relevant single nucleotide polymorphisms (SNPs) detected by Genome-wide Association Studies (GWAS) (Beck et al., 2014) is located in the non-coding genome, preferentially within enhancers, exons and mRNA promoters (Andersson et al., 2014). Inherited disease-causing variants are strongly enriched in non-coding regions under strong purifying selection, which comprise binding sites of transcription factors (TFs) and critical motifs from TF Families (Khurana et al., 2013). Further studies have shown that altered ncRNA functions initiated by genetic or regulatory changes play an important role in tumorigenesis (Chaluvally-Raghavan et al., 2014; Kwanhian et al., 2012; Ling et al., 2013; Ren et al., 2012; Tseng et al., 2014; Wegert et al., 2015).
11
In the absence of a clear and uniform functional code for these highly diverse non-coding elements, their variations are much more difficult to interpret than those of amino acid-coding regions. In this review we describe the methods and data available to interpret and prioritize non-coding genome mutations. As many basic principles in this field were laid for coding sequence analysis, we start by reviewing the methods developed for scoring protein-coding variants. We then describe the specific non-protein-coding elements that may be the subject cancer-driving mutations and we address the specific methods that were set up to characterize these variations.
1.1 Prioritizing coding variants
Prioritization of non-synonymous mutations for cancer study is a mature field built upon decades of experience in protein sequence and cancer pathway analysis. Table 1 provides a listing of the most commonly used tools. We distinguish below three classes of scoring systems, using either probabilistic, machine learning or hybrid approaches.
1.1.1 Probabilistic models
The pioneering SIFT (Sorting Intolerant From Tolerant) uses sequence homology to predict whether an amino acid substitution will affect protein function and hence, potentially alter phenotype (Ng and Henikoff, 2003). SIFT identifies conserved protein residues based on multiple sequence alignments of homologous proteins and calculates the likelihood that an amino acid at a position is tolerated, conditional on the most frequent amino acid being tolerated. Mutations in higher conserved coding regions intend to be predicted as more likely deleterious than those in lower conserved protein regions.
The mCluster method (Yue et al., 2010) aggregates mutation data by mapping known disease-related mutations to positions along conserved domains, and then mapping novel variants to those same conserved domains. The program identifies conserved mutation-enriched clusters, which are hotspots for cancer driving functional alterations, across multiple proteins. The mCluster score is the likelihood of a cluster of certain size occurring, given the number of positions in the domain and the mutation frequency.
12
MutationAssessor (Reva et al., 2011) implements a more elaborate conservation-based approach. It computes residue distribution entropy in multiple sequence alignments and estimates mutation impact by measuring the entropy difference caused by the mutation (conservation score). Moreover, the algorithm classifies protein alignment into distinct subfamilies with a clustering algorithm and quantifies the entropy difference initiated by a mutation in protein subfamilies (specificity score). The final “functional impact score” combines these two independent scores.
1.1.2 Machine learning models
PolyPhen2 (Adzhubei et al., 2010) integrates eight sequence and three structure-based
attributes for the description of an amino acid substitution, and predicts the damaging effect of a coding mutation. Most PolyPhen2 features compare a property of the wild-type allele
(ancestral, normal) and the corresponding property of the mutant allele (derived, disease-causing) and characterizes how likely the two human alleles are to occupy the site given the pattern of amino-acid replacements in a multiple-sequence alignment. The probability of a deleterious allele replacement is predicted using a Naïve Bayes classifier trained on HumDiv and HumVar (Capriotti et al., 2006), two databases of damaging alleles.
CHASM uses a random forest classifier to discriminate driver missense mutations from synthetically generated passenger mutations (Carter et al., 2009). It includes 49 predictive features ranging from exon conservation to UniProt annotation and frequency of the missense change type in the COSMIC database of cancer mutations (Forbes et al., 2011a). The program computes a classification score for each missense mutation. A mutation is determined to be driver or passenger by comparing its score to a null distribution made of scores from a filtered set of synthetic passengers that were held out from the Random Forest training.
SNAP (Screening for Non-acceptable Polymorphisms) is a neural network-based tool that predicts the effect of a missense variant (Bromberg and Rost, 2007). It uses PMD (the Protein Mutant Database) (Sjöblom et al., 2006) and incorporates evolutionary constraints, transition frequencies for mutations, biophysical characteristics of the substitution, secondary structural
13
information, relative solvent accessibility, and SwissProt annotations information to build a neural network model, which is trained on known mutations from PMD.
MutPred (Li et al., 2009) is another Random Forest classifier trained on five databases of human amino acid substitutions, CANCER (Sjöblom et al., 2006), KINASE (Greenman et al., 2007), The Human Gene Mutation Database (HGMD)(Stenson et al., 2009),
Swiss-Prot (Boeckmann et al., 2003) and a broad array of attributes describing structure features (such as secondary structure, solvent accessibility), a variety of functional sites (such as DNA-binding or phosphorylation sites), evolutionary conservation and transition frequencies. The MutPred model then associates a given non-synonymous mutation to a probability of gain or loss of structural and functional features.
1.1.3 Hybrid models
The current trend for increasing the accuracy of impact measure is to integrate different methods. For example, CanPredict (Kaminker et al., 2007a) uses a random forest classifier to predict whether a change is likely to be cancer-associated, based on analyses of three scores: the SIFT score determining functional impact of change, the Pfam-based LogR.E-value metric (Clifford et al., 2004) and the Gene Ontology Similarity Score (GOSS), which measures how similar a given mutated gene is to known cancer-causing genes (Kaminker et al., 2007b).
Condel (González-Pérez and López-Bigas, 2011) combines the output from PolyPhen2, SIFT, Mutation Assessor, Pfam-based LogR.E-values and MAPP (Stone and Sidow, 2005), which predicts deleterious mutations based on their disruption of physicochemical protein
characteristics. Another hybrid tool, CoVEC (Consensus Variant Effect
Classification) (Frousios et al., 2013) integrates prediction results from SIFT, PolyPhen2, Mutation Assessor and SNPs&GO (Calabrese et al., 2009), a scoring system based on functional protein features such as sequence conservation and GO-terms. Finally, Combined Annotation scoRing toOL (CAROL) combines the scores of PolyPhen-2 and SIFT to predict the effect of non-synonymous coding variants (Lopes et al., 2012). Expectedly, the authors of Condel, CoVEC and CAROL demonstrate that these tools outperform most individual
14
methods in classifying variants as damaging or neutral, highlighting the benefits of combined approaches (Frousios et al., 2013; González-Pérez and López-Bigas, 2011; Lopes et al., 2012).
1.1.4 Comparing coding mutation scoring tools
The authors of CoVEC (Frousios et al., 2013) assessed the classification performance of their tool and nine other prediction softwares: SIFT, PolyPhen2, SNPs&GO, PhD-SNP,
PANTHER, Mutation Assessor, MutPred, Condel and CAROL. Based on the programs' ability to properly classify HGMD inherited disease-related variants (Stenson et al., 2009) and neutral SNPs, MutPred had the best performance in terms of true positive rate, followed by PolyPhen2. SNPs&GO showed most applicability in cases requiring minimal false positive rates. Most of the individual tools had similar overall (ROC curve-based) performances, however, combined tools such as CoVEC were shown to outperform the individual tools. In an independent benchmark, Thusberg et al (Thusberg et al., 2011) tested nine scoring tools for their ability to distinguish 40,000 pathogenic variants of the PhenCode database (Giardine et al., 2007) from neutral variants. Tested tools included MutPred, Panther, PhD-SNP, PolyPhen, PolyPhen2, SIFT, SNAP, SNPs&GO and nsSNPAnalyzer (Bao et al., 2005). Programs
15
Table 1. Summary of computational methods for predicting the effects of missense mutations in cancer. Based on Machine learning Cancer-specific Other tools used
Web server, references SIFT Conservation Alignment
scores
No http://sift.jcvi.org/(Ng and Henikoff, 2003) Polyphen 2 Conservation Structure Training set Bayesian classification No http://genetics.bwh.harvard.edu/pph2/)(Adzhubei et al., 2010) Mutation assessor
Conservation No http://mutationassessor.org/(Reva et al., 2011) CHASM Conservation Structure Annotation Training set Random Forest
Yes http://wiki.chasmsoftware.org/index.php/MainPage(Carter et al., 2009)
mCluster Training set Yes http://www.mcluster.org(Yue et al., 2010) SNAP Conservation Structure annotation Training set Neural network
No Gene ontology http://rostlab.org/services/snap/(Bromberg and Rost, 2007)
Canpredict Conservation Annotation Random forest Yes SIFT LogR.E GOSS http://research-public.gene.com/Research/genentech/canpredict/ (Kaminker et al., 2007a)
MutPred Conservation Structure Annotation Training set Random forest
No SIFT http://mutpred.mutdb.org/(Li et al., 2009)
Condel Hybrid scoring system (weighted score) NA No PolyPhen2, SIFT, Mutation Assessor, Pfam-based LogR.E-values and MAPP
http://bg.upf.edu/fannsdb/(González-Pérez and López-Bigas, 2011)
CoVEC Hybrid scoring system SVM No SIFT, PolyPhen2, SNPs&GO, Mutation Assessor http://www.dcs.kcl.ac.uk/pg/frousiok/variants/index.html (Frousios et al., 2013)
CAROL Hybrid scoring system No No SIFT, PolyPhen2
http://www.sanger.ac.uk/resources/software/carol(Lopes et al., 2012) nsSNPAnalyzer structural and
evolutionary information
Random forest
No http://snpanalyzer.utmem.edu/(Bao et al., 2005)
PANTHER Conservation Alignment scores No http://www.pantherdb.org/tools/csnpScoreForm.jsp(Thomas et al., 2003) PhD-SNP Conservation Training set Support vector machine No http://gpcr2.biocomp.unibo.it/cgi/predictors/PhD-SNP/PhD-SNP.cgi (Capriotti et al., 2006) SNPs&GO Conservation Swissprot features Support vector machine No http://snps-and-go.biocomp.unibo.it/snps-and-go/(Calabrese et al., 2009) MAPP Physicochemical constraints NA No http://mendel.stanford.edu/supplementarydata/stone_MAPP_2005/ (Stone and Sidow, 2005)
IntOGen-mutations
Hybrid scoring system NA Yes PolyPhen2, SIFT, Mutation Assessor
http://www.intogen.org/web/mutations/v04/search (Gonzalez-Perez et al., 2013)
16
1.2 Integrating recurrence for driver prediction
Further to prioritizing individual mutations as shown above, a variety of approaches predict driver genes by combining mutation scores and recurrence patterns. The assumption
underlying these methods is that genes critical to the development of a specific cancer type should be recurrently mutated in a cohort of cancer samples. Several programs are available to identify such genes (Chapman et al., 2011; Ding et al., 2008; Gui et al., 2011;Wang et al., 2011;X. Wei et al., 2011).
IntOGen-mutations is a web server aiming to identify cancer drivers across tumor types (Gonzalez-Perez et al., 2013). The system first determines the consequences of mutations using the Ensembl variant effect predictor tool which offers a comprehensive database of variations, their effects and context (Chen et al., 2010) and uses three of the above tools (SIFT, PolyPhen2 and MutationAssessor) to compute the functional impact score of a somatic
mutation. These functional scores are then transformed into a uniform score which measures the damaging impact of somatic mutations with transFIC (González-Pérez and López-Bigas, 2011). This pipeline also computes each mutation's frequency of occurrence within and across cancer projects and groups mutations occurring in the same gene (or pathway). Subsequently, OncodriveFM (Gonzalez-Perez and Lopez-Bigas, 2012) which detects genes accumulating mutations with high functional impact (FM bias) and OncodriveCLUST tools (Tamborero et al., 2013) which determine genes whose mutations cluster in particular regions of the protein sequence in comparison with synonymous mutations (CLUST bias) are used to identify positively selected genes, i.e. genes whose mutations are selected during tumor development and are therefore likely drivers. Finally, the pipeline computes the frequency of mutation of each gene (and pathway) within a cancer class (Figure1).
17
Figure1. Schematic display of the Oncodrive-fm driver detection tool (Gonzalez-Perez and Lopez-Bigas, 2012).
Oncodrive-fm is constructed based on the hypothesis that driver genes display the bias toward the enrichment of variants with high function impact (FI). (A) The first step of Oncodrive-fm is measurement of FI scores of coding variants detected in multiple cancer samples with SIFT, polyphen2 and MutationAssessor. (B) Secondly, Oncodrive-fm evaluates whether a gene possesses a shift toward the enrichment of variants with high FI, it compares the FI of observed variants to a null distribution and computes a P-value for each gene. RFM,
not-18
FM biased. (C) Lastly, Oncodrive-fm can also detect gene modules or pathways that possess the FM bias.
The MutSigCV method (Lawrence et al., 2013) assesses the background mutation rate for each gene–patient–category combination based on the observed silent mutations in the gene and non-coding mutations in the surrounding regions. It pools data from other genes with similar properties (for example replication time, expression level) to increase accuracy. Significance levels (P values) are determined by examining whether observed mutations in a gene significantly exceed the expected counts based on the background model (Figure2).
Figure2. Overall concept of detection of recurrently mutated genes of MutSigCV in a cohort of cancer samples (Lawrence et al., 2013).
MuSiC relies on the calculation of a background mutation rate (BMR) (Dees et al., 2012). The algorithm counts the number of bases with sufficient aligned read-depth based upon user-defined coverage. Counts are determined for A, T, C and G as CpG dimers, and non-CpG C and G. Discovered mutations are categorized according to mutational mechanism, with separate categories for AT transitions, AT transversions, CpG transitions, CpG transversions, CG (non-CpG) transitions and transversions, and a seventh „indel‟ category. The BMR of each mutational mechanism category is calculated by dividing the number of mutations found in that category by the total number of bases available in which such a call could have been
19
made. Significantly mutated genes are generated by comparisons of mutation rates to BMR, using statistical tests.
Figure 3. Identification of driver genes under positive selection with InVEx (Hodis et al., 2012) (A)
Gene A possesses higher rate of nonsilent variants and silent/intronic variants in comparison with that of Gene B, indicating gene A is under positive selection of nonsilent variants in cancer. (B) Schema of a random permutation-based approach to prioritize driver genes that possess positively selected nonsilent mutations with respect to a null distribution.
InVEx is a random permutation-centered algorithm (Hodis et al., 2012) that relies on the assumption that a gene under positive selection for nonsilent mutations during cancer formation displays a higher rate of high-scoring non-synonymous mutations than silent and intronic mutations. A random permutation test is performed across each gene and a “mutation burden” score is calculated for each randomized instance, providing a null model of score
20
distribution. The actual mutation burden observed for a gene across all samples is then compared to this distribution and a P-value is computed, assessing whether the observed coding mutations and genes undergo positive selection (Figure3).
Although genes that are mutated with high recurrence are easily recognized, some cancer drivers are mutated in a small fraction (e.g. <1%) of tumors (Wood et al., 2007). Thus, methods that can classify mutations as either drivers or passengers on the basis of data that is independent of mutation frequency clearly become important. There are many ways of combining mutation deleteriousness, recurrence and knowledge of mutational background. Computational options in this area are far from fully explored and we may thus expect improved driver predictors in the future. Furthermore, the application of these methods to the non-coding genome is a fascinating perspective, as so little is known about driver elements in these regions. This challenge may soon become accessible thanks to development of scoring systems for non-coding mutations, as explained in the next sections.
1.3 Non-coding elements and cancer
The list of non-coding elements involved in gene expression regulation has been steadily increasing over the years. Promoters, enhancers, splicing regulators and the expanding family of regulatory ncRNA (mainly miRNAs and lncRNAs) are central elements of the cell
regulatory network. Their function in the control of gene expression is similar to that of many protein-coding cancer drivers, half of which are involved in transcriptional and
posttranscriptional regulation. Therefore, it comes as no surprise that mutations within these non-coding elements are responsible for the initiation and progression of cancer, among other diseases (Andersson et al., 2014; F. W. Huang et al., 2013; Khurana et al., 2013; Killela et al., 2013; Horn et al., 2013).
The first non-coding cancer hotspots to be suspected were promoters and TF binding sites. Indeed, among 4,492 phenotype-associated SNPs from the GWAS Central Database (Beck et al., 2014), 12% are located in binding regions of transcription factors, which is significant as these loosely defined regions represent 8.1% of the genome (Sato et al., 2013). Genetic variations at TF binding sites, including single-nucleotide polymorphisms and larger
21
structural variants, are frequently associated with binding affinity (Kasowski et al., 2010; Mcdaniell et al., 2010; Zheng et al., 2010), gene expression (Sugimachi et al., 2014; French and Et Al, 2013) and cancer susceptibility, progression and outcome (Jiang et al., 2012; Lin et al., 2014; S.-P. Huang et al., 2013). A well-known such locus is the TERT promoter, whose mutations were established as drivers in melanomas and gliomas (Killela et al., 2013; F. W. Huang et al., 2013; Horn et al., 2013).
Another important class of regulatory element is that of splicing regulators. Misregulation of RNA splicing initiated by genetic variants is a cause of human disease, including cancer. Alteration of 5'and 3' splicing sites and adjacent bases accounts for 10% of human inherited disease mutations (Sterne-Weiler and Sanford, 2014; Krawczak et al., 2007) and the number of tumor-relevant splicing variants detected by GWAS in cancers reaches 15,000 (He et al., 2009; Venables et al., 2008; Shapiro et al., 2011). For example, a germline mutation in the splicing site of hSNF5 is causative of exon 7 skipping and subsequent frameshift, which, as a result, renders infants susceptible to develop malignant brain tumors (Taylor et al., 2000). Likewise, a mutation at the acceptor site of the APC gene intron 3–exon 4 junction causes the loss of exon 4, which accordingly terminates seven codons downstream of junction 4, a phenomenon closely associated to childhood hepatoblastoma (Kurahashi et al., 1995).
Variation in non-coding RNA (ncRNA) sequence and expression is another potential component of cancer progression. The first important offenders in this class were miRNAs. Single nucleotide variations in miRNA sequences or in their mRNA target sites lead to alteration of binding specificity, thus affecting expression and/or translation of target mRNAs (Manikandan et al., 2012; Gopalakrishnan et al., 2014; Kamaraj et al., 2014;
Manikandan and Munirajan, 2014; Vaishnavi et al., 2014). For instance, SNPs in mRNAs of the CEP family of cell division genes, alter mRNA/miRNA interactions, greatly affecting mRNA expression, disrupting the cell cycle and contributing to initiate cancer(Kamaraj et al., 2014) Overall, more than 236 miRNAs have been associated to 79 human cancers either as potential oncogenes or tumor suppressors (Xie et al., 2013).
Long non-coding RNA is the most recent class of regulatory ncRNA to be associated to cancer. According to a recent study (Iyer et al., 2015), over 68% (58,648) of expressed genes
22
in human tumors are lncRNAs, 7942 of them lineage- or cancer-specific. Through gene regulation or other mechanisms, lncRNAs may act as proto-oncogenes, tumor suppressor genes or drivers of metastatic transformation. For instance, the HOTAIR lncRNA is highly expressed in primary breast tumors and metastases, as well as in gastric cancer, and its repression inhibits xenograft tumor growth and metastasis in mouse models (Gupta et al., 2010; Okugawa et al., 2014). MALAT1 is another lncRNA whose expression is correlated with metastasis and survival in lung cancer (Ji et al., 2003). Knockout of MALAT1 greatly impairs the migration and formation of tumor nodules of MALAT1-deficient A549 cells in a mouse xenograft (Gutschner et al., 2013). Jin et al. (Jin et al., 2011) observed that among a set of 33 SNPs independently associated with elevated prostate cancer (PCa) risk, eight were located in lncRNAs. Moreover, lncRNA loci showed a five-fold enrichment of PCa risk-related SNPs in comparison with the entire genome. SNPs in the lncRNA PRNCR1 were proposed to be related to colorectal cancer (CRC) risk (L. Li et al., 2013).
In spite of these recent advances, the list of cancer-driving elements in the non-coding genome remains extremely short with respect to the size of the regions involved. A major avenue in identifying new potentially relevant loci involves exploring chromatin states. Indeed, regions where chromatin is open or active in a given cell type are the most likely to contain key regulatory elements. For instance, DNase I hypersensitive sites (DHSs),i.e. DNA regions sensitive to the DNase I enzyme, harbor many regulatory elements such as enhancers, promoters and silencers (Gross and Garrard, 1988; He et al., 2014). Moreover, DHSs are associated with elevated levels of nearby gene expression, at least in certain cells (He et al., 2014). Other important functional hallmarks are provided by histone modifications such as acetylation and methylation, which control chromatin states and are thus important regulators of gene expression (Dawson and Kouzarides, 2012). Specific histone marks suggest different types of regulatory elements: H3K4me3 generally marks promoters and transcription start sites. Putative enhancers tend to be marked with H3K4me1 alone or in combination with H3K27ac or H3K27me3 (Rada-Iglesias et al., 2011; Zentner et al., 2011). Conversely, major repressive marks, such as H3K9me3 and H3K27me3, are associated with constitutive
heterochromatin and repetitive elements, repressive domains and silent developmental genes (Rada-Iglesias et al., 2011) and are therefore less likely to harbor cancer drivers.
23
1.4 Prioritizing non-coding variants
Although the number of associated non-coding mutations is increasing, finding cancer-driving mutations in the non-coding genome remains a huge challenge. A major bottleneck lies in identifying functional domains while trying to explore the consequences of the variations. Functional interpretation of non-coding variations is now turning into a realistic goal through the completion of major high-throughput studies such as the Encyclopedia of DNA Elements (ENCODE) (Rosenbloom et al., 2013), the “29 Mammals” Project (Lowe and Haussler, 2012), the Health Roadmap Epigenomics project (Bernstein et al., 2010) and other large scale regulatory data collections (Rhee and Pugh, 2011; Yu et al., 2011; Zeller et al., 2010)(Degner et al., 2012; Palii et al., 2011). Particularly, The ENCODE Project has provided researchers with genome-wide mapping of histone modification, Dnase I hypersensitive sites, FAIRE sites (formaldehyde-detected nucleosome-depleted elements), transcription factor binding sites, RNA-seq expression data and replication timing across multiple cell
lines (Rosenbloom et al., 2013). These extensive data form a major stepping-stone toward the functional annotation of non-coding variants. More and more studies are taking advantage of these annotations to explore and prioritize non-coding variants implicated in cancer and other diseases. Table 2 presents seven systems that are currently available for scoring non-coding variants. We distinguish below two families of such methods, based either on empirical scoring systems or on machine learning.
1.4.1 Empirical scoring systems
The RegulomeDB database and software (Boyle et al., 2012) assigns functions to non-coding variants based on the principle that a variant impacting a regulatory element likely results in functional consequence. Non-coding variants are classified into different functional categories according to their overlap with functional elements such as transcription factor binding, histone modifications, DNase I hypersensitive sites, FAIRE sites and eQTLs (expression Quantitative Trait Loci, that is loci likely to affect expression of target genes). Application of this tool to the annotation of non-coding variants from 69 full sequenced genomes (Clarke et al., 2012) identified thousands of potential functional variants.
24
The FunSeq tool (Khurana et al., 2013) predicts non-coding drivers by scoring the deleterious potential of variants, based on two assumptions. First, somatic variants in non-coding
elements containing a high fraction of rare variants (derived allele frequency < 0.5%) are considered as under negative selection and thus are most likely to be cancer drivers. Second, driver mutations should be recurrent in the same genomic element across multiple cancer samples. Application of this workflow to 90 cancer genomes yielded nearly a hundred non-coding drivers candidates. An improved algorithm, FunSeq2 (Fu et al., 2014) exploits large-scale genome data from 1000 Genomes and ENCODE into a scoring pipeline that combines functional features such as sequence conservation, transcription-factor binding sites,
enhancer-gene linkages, network centrality and recurrence across samples. In this model, features are weighted by their probability of overlapping a natural polymorphism in the 1000 Genome database, which is a negative indicator of selection strength. Application of FunSeq2 to germline pathogenic regulatory variants successfully distinguished HGMD (Human Gene Mutation Database) and GWAS non-coding pathogenic variants from neutral ones. The method also effectively scored COSMIC recurrent variants higher than non-recurrent variants.
1.4.2 Machine-learning models
While the RegulomeDB and FunSeq systems prioritize functional genetic variations using empirical models, recent methods aim to integrate functionally predictive features
automatically using machine learning (Kircher et al., 2014; Ritchie et al., 2014; Shihab et al., 2015). One of these models, GWAVA (Ritchie et al., 2014) uses regulatory mutations annotated in the HGMD database as a training set for non-coding variants of medical importance. These variants are predicted using a random forest classifier based on a
combination of regulatory features, genic context and genome-wide properties such as DNase I hypersensitivity sites, FAIRE sites, Transcription factor binding sites, Histone modifications, RNA polymerase binding sites, complex epigenetic states, CpG islands, sequence
conservation, allele frequency of variants and gene annotation. The model was able to effectively discriminate a set of disease-relevant variations of the ClinVar (Landrum et al., 2014) and GWAS Central databases from control variants. More importantly, recurrent cancer mutations from the COSMIC database were scored significantly higher than non-recurrent
25
mutations, suggesting that this approach might be useful in prioritizing cancer driver mutations.
Another tool, FATHMM-MKL, implements multiple kernel learning to weight different ENCODE feature annotations based on their relevance. The program builds a Support Vector Machine classifier based on a positive training set of non-coding pathogenic variants
annotated in HGMD and a negative set of common single-nucleotide variants with allele frequency above 1% within 1-Kb surrounding disease-causing variants. The model uses for prediction a kernel matrix of 10 annotation features, including transcription factor binding sites, evolutionary conservation, DNase I hypersensitive sites and histone
modifications (Shihab et al., 2015). A possible limitation in GWAVA and FATHMM-MKL is the methods highly rely on a set of promoter proximal, pathogenic mutations that are well characterized and thus are subject to ascertainment bias.
Instead of building a classifier using limited curated pathogenic variants, the CADD
system (Kircher et al., 2014) contrasts the annotations of fixed derived alleles in humans with those of de novo simulated variants. Here fixed (or nearly fixed) alleles are used as models for deleterious variants. The CADD system is trained to recognize such variants using a support vector machine classifier based on a combination of 63 tracks of annotations, including conservation, regulatory information, transcript information, protein-level score produced by SIFT, Polyphen or Grantham (Grantham, 1974). CAAD successfully differentiated 14.7 million high-frequency human-derived alleles (observed variants) from 14.7 million simulated variants (half simulated de novo mutations).
To conclude this section, we mention SPANR (splicing-based analysis of variants) (Hs et al., 2015), a program that combines a Bayesian machine learning algorithm and a regulatory model of gene splicing to detect and score disease-associated genetic variants. The RNA splicing model integrates regulatory elements and splicing levels generated from RNA-seq data of healthy human tissues. SPANR is capable of a precise classification of both intronic disease-related variants and deleterious disease mutations within exons, from common variants in the dbSNP database. Analyses using SPANR have generated a large body of
26
splice-disruptive mutations involved in Autism, familial colorectal cancer and spinal muscular atrophy, which are known for RNA-splicing deregulation.
1.4.3 Comparing non-coding variant scoring tools
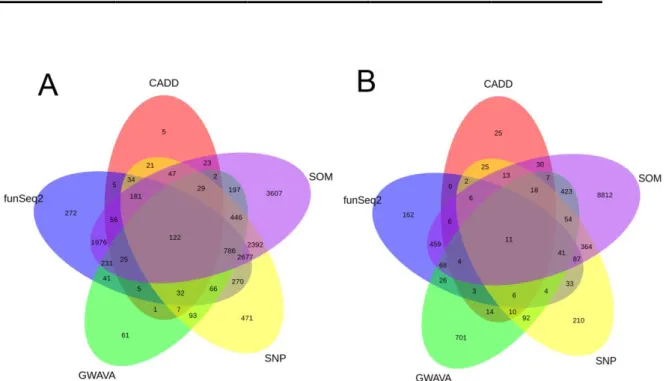
To illustrate the divergence of predictions by different non-coding mutation scoring systems, we selected seven tools from the current literature (CAAD, FunSeq, FunSeq2, GWAVA, RegulomeDB, Fathmm-MKL and SPANR) and used them to score 874,325 non-coding variants (both substitutions and short indels) from the whole genome sequencing of 88 liver cancer samples (Lawrence et al., 2013). First, we should note that all tools are not applicable to the entire set of somatic mutation (Fig. 4A). GWAVA, RegulomeDB, and funSeq2 were able to score over 99% of variants, while SPANR provided scores for only 2.48% of variants due to its specificity for splicing regulation. Due to this different scope, we excluded SPANR from further comparison. We scored the 841,402 somatic mutations covered by the other 5 tools and collected the 10,000 highest scoring variants from each tool. The Venn diagram in Fig. 4B shows the overlapping of predictions. Strikingly, even though there is a higher overlap of highest scoring variants among five tools as compared to 10000 randomly sampled ones (P value=0, a permutation test), only 13 variants are commonly predicted as high scoring by all five tools, illustrating the remarkable divergence of non-coding variant prioritization strategies. While a full benchmark of the different prediction algorithms is beyond the scope of this review, we may refer to two studies that assessed the performances of various non-coding variant prioritization tools in classifying sets of known deleterious HGMD variants. Each study compared a specific program developed by the authors to leading “state-of-the-art” algorithms. Fu et al. (Fu et al., 2014) showed that FunSeq2 has a better average prediction power compared to GWAVA and CAAD, while Shihab et al. (Shihab et al., 2015) showed that FATHMM-MKL outperformed GWAVA and CAAD in terms of accuracy. Due to the substantial number of recently developed methods, a full scale and independent comparative study would be valuable to provide consistent results and objectively identify the strengths and weakness of each tool.
27
Figure 4. Comparison of six non-coding mutation scoring tools. A. Fraction of positions covered by each tool in a set of 874,325 non-coding variants. B. Overlap of the 10,000 top-scoring variants, using the 5 scoring tools with the larger prediction coverage (CADD, Fathmm-MKL, FunSeq2, GWAVA and RegulomeDB), from the 841,402 variants common to their prediction coverage. Five set of 10000 variants were randomly sampled from the 841,402 variants covered by five tools, the overlap was calculated accordingly. The sampling process was repeated 1000 times, the significance of overlap of 10000 high scoring variants was compared to the 1000 overlaps of random sampling variants.
28
Table 2. Summary of computational approaches for predicting the damaging effects of non- coding mutations
Based on Machine
learning
Cancer-specific
Web server, references
Regulome DB
Overlap with functional elements Empirical Scoring systems No http://www.regulomedb.org/(Boyl e et al., 2012)
Funseq Negative selection in general population recurrent cancer mutations Empirical Scoring systems
Yes http://funseq.gersteinlab.org/ (Khu rana et al., 2013)
Funseq2 Negative selection in general population recurrence in cancer mutations Empirical Scoring systems
Yes http://funseq2.gersteinlab.org/ (Fu et al., 2014) GWAVA HGMD regulatory mutations, integrated genome annotation Random Forest No https://www.sanger.ac.uk/sanger/S tatGen_Gwava(Ritchie et al., 2014) CADD Deleteriousness,diverse genome annotation support vector machine No http://cadd.gs.washington.edu/ (Ki rcher et al., 2014)
SPANR RNA splicing model Bayesian
machine learning No http://tools.genes.toronto.edu/(Hs et al., 2015) FATHMM -MKL HGMD mutations, ten feature annotations (6 from ENCODE) support vector machine No http://fathmm.biocompute.org.uk( Shihab et al., 2015)
1.5 Conclusion
The search for cancer drivers requires a reliable functional annotation of variants and adapted tools for analyzing the recurrence of deleterious variants across patients. The former requisite is particularly challenging in the non-coding genome. An active research community is developing tools for non-coding variant annotation and prioritization using a variety of methods ranging from empirical scoring scheme to machine-learning and elaborate hybrid frameworks. Due to the heterogeneity and complexities of these scoring tools, objective comparisons based on proper benchmarks using different sets of validated or probable
29
disease-causing variants are strongly required. Among multiple sources of possible improvement, the success of hybrid methods for scoring coding variants, and the widely divergent predictions by the non-coding tools suggest that combining outputs from different tools will significantly increase scoring accuracy for non-coding variants. A further challenge is to jointly consider this “functional” score and the heterogeneity of cancer specific mutation constraints in different genome areas. These potential enhancements suggest we can expect important reliability gains in non-coding variant prioritization in the near future.
As described above, there are a handful of computational tools used to evaluate the functional impact of non-coding mutations. However, certain limitations still exist for these prediction tools. For example, empirical scoring systems, such as RegulomeDB and funSeq2, cannot provide a precise measure of functional information for non-coding variants, while machine learning models, such as FATHMM-MKL and GWAVA, might be overfitted to a small set of HGMD disease mutations and show major ascertainment biases, and CADD doesn‟t take into account cancer mutation information in its scoring system. Moreover, although an increasing number of cancer-associated lncRNAs has been experimentally characterized, an efficient computational tool to prioritize cancer-driving lncRNAs is still missing, mainly owing to the sophisticated and diverse mechanisms by which lncRNAs act. Therefore, it becomes
increasingly urgent and important to develop a scoring system that accurately measures the functional effect of non-coding cancer mutations and then injects this functional information into a computational program for the detection of non-coding drivers.
In the following studies, we hypothesized that purifying selection as measured by the fraction of rare SNPs in general population and mutation density (number of mutations /Mb)
constraint are two important measures of functional impact of cancer mutations in the non-coding cancer genome. In order to functionally score non-non-coding mutations in cancer and eventually identify new cancer drivers, we took into account the dual selection forces acting on the tumor genome: (1) population and evolutionary constraints acting at germline level and (2) constraints resulting from the accelerated mutation background of the cancer tissue. To achieve this, we have developed two independent random forest models, referred to as SNP and SOM models. The SNP model predicts expected fraction of rare SNPs for any non-coding
30
region based on a combination of features, the SOM model computes the expected mutation density for each 1-Mb window with an array of feature types ranging from replication time, expression level, histone modifications to regulatory elements. The two models are capable of discriminating disease-associated variants from Clivariant and HGMD databases from a set of random control SNPs, strongly supporting our hypothesis. This study is the object of the following chapter.
31
Chapter 2 –
Non-coding driver
mutations
Results presented here are published in PLoS Computational Biology (Appendix 2)
A dual model for prioritizing cancer mutations in the non-coding genome based on germline and somatic events
.
LI J, Poursat MA, Drubay D, Motz A, Saci Z, Morillon A, Michiels S, Gautheret D. PLoS
Comput Biol. 2015. 11(11):e1004583.
Author contribution:
Jia LI was the main contributor to this study, he performed the whole experiment under the supervision of Professor Daniel Gautheret. Poursat Marie-Anne provided professional
guidance as to the random forest model building and validation. Drubay Damien and Michiels Stephan gave statistical support to this work. Motz Arnaud was in charge of the preparation of figure 4 and supplementary figure 4. Professor Daniel Gautheret firstly wrote the manuscript, Jia LI, Saci Zohra, Morillon Antonin, Damien Drubay and Michiels Stephan gave their suggestion and comments. The paper was further revised by Daniel Gautheret and Jia LI together until the final acceptance.
32
2.1 Summary
Cancer cells undergo a mutation/selection process that resembles that of any living cell. Most mutations in cancer cell DNA occur in the so-called "non-coding" regions that represent 98.5% of the genome length. Pinning down which of these mutations contribute to the fitness of cancer cells would be important for identifying new "cancer drivers", which may in turn lead to future treatments. Unfortunately, predicting the impact of a non-coding DNA alteration remains extremely difficult. In this study, we analyze millions of non-coding cancer mutations and show cancer-specific mutational patterns can be used to predict non-coding regions that are preserved from mutations and may thus be important for cancer cell survival. Combining this information with population data, we propose a new scoring system that should help prioritize important non-coding mutations in future studies.
33
2.2 Introduction
Since the onset of cancer genomics, the search for cancer genes and cancer-causing mutations has largely focused on protein-coding genes and, more specifically, their coding exons, where the damaging effect of mutations is best understood. Among 572 human genes considered as cancer drivers (Futreal et al., 2004; D‟Antonio and Ciccarelli, 2013), nearly all are protein-coding. However protein-coding regions only represent a tiny subset of the vast transcribed area composed of over 50,000 non-coding genes (Harrow et al., 2012; Iyer et al., 2015) and the introns and untranslated regions (UTRs) of mRNA genes. Even though a large part of the non-coding transcribed regions is probably non functional (Ulitsky and Bartel, 2013), analyses based on evolutionary conservation or allele frequencies in human populations (Ponting and Hardison, 2011; Ward and Kellis, 2012) estimate that 10 to 15% of the overall genome is under selection, that is 7-10 times larger than protein-coding regions.
Non-coding mutations may cause damaging effects in many distinct ways. They may alter RNA structure (Corley et al., 2015) or binding sites for proteins or other RNAs, such as splicing sites (Jolly et al., 1994) and microRNA target sites in 3‟ UTRs, or impact regulatory sequences in gene promoters and enhancers. A recent population genomics study estimates that there are in average 15 highly deleterious mutations in the non-coding DNA of any healthy individual (Khurana et al., 2013). This large source of potentially damaging mutation remains mostly untouched by cancer genomics. In-depth analysis of the mutational load in the non-coding fraction of the genome is needed for the comprehensive understanding of cancer progression, as well as for the identification of new cancer drivers and therapeutic targets.
Whole genome normal vs. tumor sequencing commonly reveals thousands to tens of thousands of somatic mutations (Alexandrov et al., 2013; Kandoth et al., 2013; Lawrence et al., 2013), scattered across all genomic areas. In coding regions the genetic code and aminoacid conservation rules provide a robust functional model for scoring mutational damage (Adzhubei et al., 2010; Ng and Henikoff, 2003). Similarly reliable tools are needed for non-coding regions in order to prioritize non-coding mutations and seek gene regions acquiring deleterious mutations at an unusual pace across a set of tumor samples. Several scoring systems for non-coding mutations already exist. The RegulomeDB system (Boyle et al., 2012) scores variants using an empirical metric based on their overlap with transcription
34
factor (TF) motifs, known TF binding site, chromatin marks or expression QTLs (eQTL) and thus is clearly centered on regulatory DNA variants. Other scoring models consider allele frequencies in human populations. Rare alleles are more often associated to reduced or lost gene activity than frequent alleles (Urban, 2005) and a high local ratio of rare to total SNP is indicative of purifying selection (Khurana et al., 2013; Chen and Rajewsky, 2006; Lomelin et al., 2010; Haerty and Ponting, 2013). Khurana et al. used SNP data from the 1000 Genome project (Clarke et al., 2012) to identify about 0,4% of the genome (12Mb) as sensitive to mutations and introduced an empirical scoring system (Funseq) to rate somatic mutations based on their presence in sensitive segments and overlap with known regulatory elements (Khurana et al., 2013; Fu et al., 2014). Likewise, the CADD system (Kircher et al., 2014) predicts the deleteriousness of non-coding mutations based on allele frequencies modeled using machine learning on a series of genome features. Recently, Ritchie et al. introduced a model for prioritizing non-coding variants based on databases of known disease-related mutations (Ritchie et al., 2014). The authors used machine learning to predict regions where disease-causing variants are most likely, using as explanatory variables functional features such as exon annotations, histone and other chromatin marks or transcription factor binding sites (TFBS). However useful, these models have limitations in that they are often directed towards the detection of regulatory elements (where 75% of disease variants have been located to date (Ritchie et al., 2014) and they only consider human mutations in the light of germline, evolutionary selection, meaning independently of a specific tissue or disease context. This latter point is especially important in cancer, where (1) most disease-inducing mutations occur somatically during the lifetime of an individual, and (2) these mutations may have different impacts when occurring in different tissues.
The availability of multiple whole genome sequence (WGS) data from tumors and matched normal tissue has revealed the extensiveness and singularity of cancer somatic mutations (Alexandrov et al., 2013; Kandoth et al., 2013; Lawrence et al., 2013). Cancer cells divide under their own set of selective constraints by which large regions of the genome can sustain high mutation rates while others seem relatively protected. This accelerated mutation rate is an important factor that may cause recurrent mutations in genome areas that are not necessarily related to cancer. Methods for scoring putative driver mutations now take such
35 effect into account (Lawrence et al., 2013).
Variation of the somatic mutation rates in different genome areas is by itself a rich source of functional information. Schuster-Böckler & Lehner (Schuster-Böckler and Lehner, 2012) related 45 functional features (mostly histone marks) to somatic mutation rates and observed that the major factor influencing mutation density was chromatin organization, marks of open chromatin being associated to a reduced SNV densities and marks of closed chromatin to higher densities. Cancer somatic mutations do not all cause cell death or tumor progression, but they may contribute to tumor heterogeneity which in turn facilitates the emergence of new clones capable of surviving micro-environmental changes and drug treatments (Podlaha et al., 2012). In this sense, the somatic mutation landscape can be considered as a model of accelerated evolution in which most mutations are neutral and a handful is under selection as beneficial to tumor progression.
A strong hypothesis guiding the present study is that, in order to prioritize non-coding mutations in cancer and eventually discover new cancer drivers, one should take into account these dual selection forces acting on the tumor genome: (1) population and evolutionary constraints acting at germline level and (2) constraints resulting from the accelerated mutation background of the cancer tissue. To this aim we developed two integrative models that use annotated genome features to predict germline or somatic mutation constraints at any genomic location. We compared the functional features that most influence each mutational regimen and analyzed the intersection of constrained regions predicted under each model. A new picture of the somatic mutational landscape emerges where regions under constraint in the germline may be subject to highly variable mutation rates in the tumor. We present evidence that low somatic mutation areas are functionally relevant and can be used as a powerful screen for prioritizing cancer-related non-coding mutations.
2.3 Results
We represent germline and somatic constraints acting on tumor genomes using two independent models, one for each mutational regimen, that we term the SNP model and the SOM model. For each model, we define a set of genome features, mainly from
36
UCSC/Ensembl genome annotation (Karolchik et al., 2014) and the ENCODE Project (Rosenbloom et al., 2013) and we use these features to predict the expected mutational constraint at any genome position. In the SNP model, the mutational constraint is expressed as a regional ratio of rare SNP, while in the SOM model it is expressed as a regional mutation density. We further describe each model below.
2.3.1 Scoring mutations with the germline (SNP) model
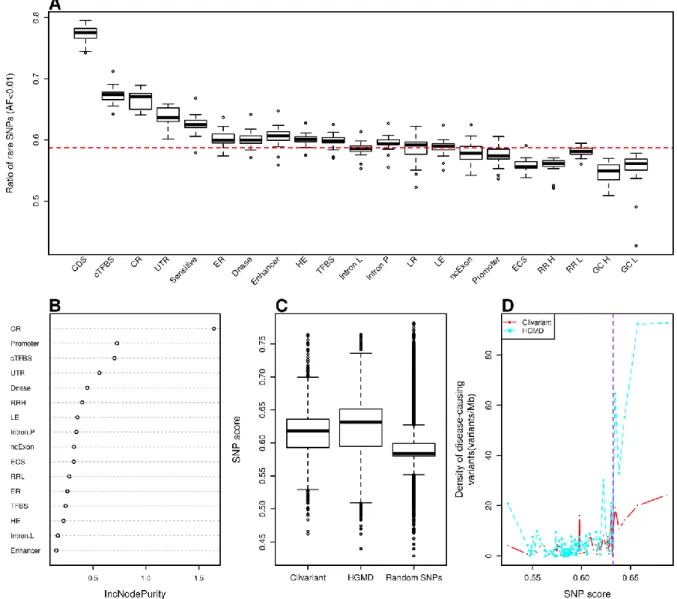
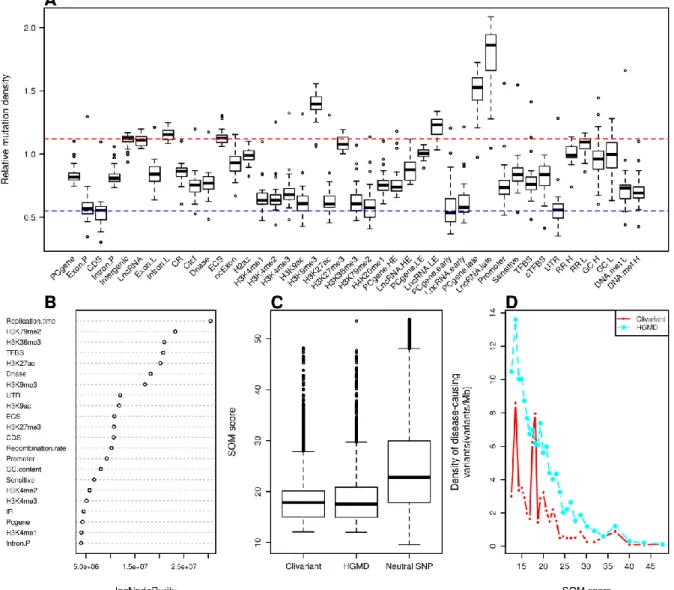
A high regional ratio of rare SNPs (i.e. SNPs with allele frequencies below 0.5 or 1%) is a hallmark of genome regions under negative / purifying selection (Chen and Rajewsky, 2006; Khurana et al., 2013; Haerty and Ponting, 2013). Figure 1A shows varying ratios of rare SNPs obtained from the 1000 Genome Project (Clarke et al., 2012) associated to known functional regions or "features"' (see Table S1 for each feature definition). Coding regions (CDS) clearly stand out as more constrained than coding regions in general. However, a number of non-coding elements also depart from the average genome signal, reflecting prior analysis of the 1000 Genome project data (Khurana et al., 2013). Regions under purifying selection (ie. with high rare SNP ratio) include evolutionary conserved regions, transcription factor binding sites, DNase I hypersensitive, early replicated and highly expressed regions. Inversely, we observed low ratios of rare SNPs in regions of strong GC-bias, high replication rate and evolutionary conserved RNA structures (ECS). Of note, this low ratio of rare SNP in ECS is in disagreement with the expected deleterious effect of mutations in functional RNA structures.
We developed a Random Forest (RF) model to predict purifying selection at any genome position based on the features present at this position. To this aim we associated every non-coding genome position to a vector of binary values describing the presence/absence of functional features at this location (see Table S1 and Methods). Following feature selection and cross-validation, we obtained a robust model associating any combination of 16 genomic variables to a predicted rare SNP ratio. A measure of importance of each feature's contribution to the RF model is shown in Fig.1B. Evolutionary conserved regions, promoters and conserved transcription factor binding sites are among the strongest contributors to rare SNP ratio, in line with previous studies (Clarke et al., 2012). Of note, the predictive value of a high recombination rate, which is associated to a low rare SNP ratio (Fig 5A), had not been reported before.
37
To evaluate how the SNP model alone can predict deleterious mutation in the non-coding genome, we compared the average scoring of one million random SNPs to that of non-coding variants from two distinct collections of disease-related mutations, the Clivariant (Landrum et al., 2014) and HGMD (Stenson et al., 2009) databases (Fig. 5C). Known clinical variants from either database have significantly higher scores by the SNP model than random variants (Wilcoxon P<2.2e-16 in both cases). Furthermore, scores in the SNP model are positively correlated to the density of disease-related SNPs (Fig 5D, r= 0.80 and 0.73, P=6.09e-08 and 3.15e-06 for Clivariant and HGMD, respectively), which confirms the capacity of the SNP model to identify non-coding regions where mutations are more likely to be disease-related.
38
according to different genome features (see Table S1 and Methods for feature details). Each box shows rare SNP fraction across all human chromosomes, except chr. Y. CDS: coding sequence; cTFBS: conserved transcription factor binding site; CR: evolutionary conserved region; UTR: untranslated region; Sensitive: region with high rate of rare SNP defined in (Khurana et al., 2013), ER/LR: early and late replicated region; DNase: DNase I hypersensitive site; HE/LE: high and low expressed region; Intron L/Intron P: intron of lncRNA/of protein coding gene; ncExon: non coding exon; ECS: evolutionarily conserved structure; RR H/RR L/GC H/GC L: high recombination rate, low recombination rate, high GC content and low GC content regions. The red dotted line represents the average fraction of rare SNPs across the genome. B. Feature importance as measured by IncNodePurity. We only show here features that passed feature selection. C. Distribution of SNP scores for random SNPs and for clinical variants from the Clivariants and HGMD databases. Random SNPs here are a set of 1M random intergenic SNPs from the 1000 Genome project. D. Correlation of SNP scores with densities of disease-causing variants. Genome positions were sorted by SNP score and split into 20 Mb intervals. The plots show the average SNP score and density of disease-causing variants for each interval. The purple dotted line shows cutoff used for defining high SNP score thereafter.
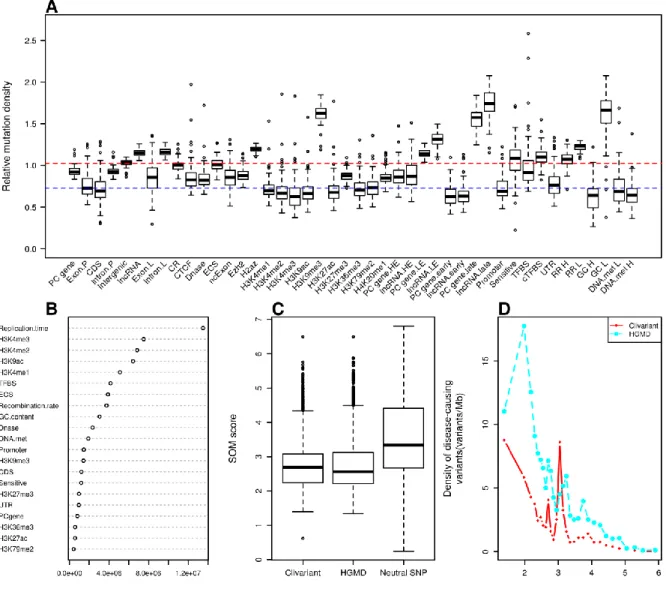
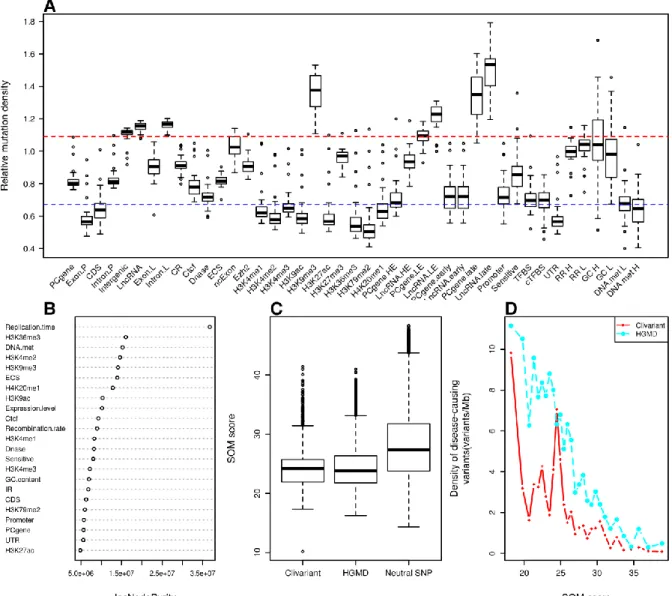
2.3.2 Scoring mutations with the somatic (SOM) model
The tumor mutational landscape results from the combined action of multiple factors including mutagenic agents, accelerated cell division, impairment of DNA replication/repair pathways and resistance to treatment (Lawrence et al., 2013). The tumor genome is thus subject to a set of constraints that are quite distinct from those acting in the germline. To analyze these constraints, we collected somatic mutation data from whole genome sequencing of liver cancer (N=88 patients), chronic lymphocytic leukemia (CLL) (N=28), lung adenocarcinoma (N=24) (Alexandrov et al., 2013) and melanoma (N=25) (Berger et al., 2012). We analyzed mutation densities for the above genomic features and for tissue-specific features such as histone marks, early/late replicated regions and transcript abundance obtained from tissue-matched Encode cell lines (Rosenbloom et al., 2013) (Table S2). Results are shown in Figure 6A, S1A, S2A, S3A. Protein-coding sequences (CDS) harbor relatively low somatic mutation densities compared to introns (intron.P) and intergenic regions in all four cancer types, consistent with higher functional constraints in CDS, as observed in the SNP