HAL Id: halshs-00706791
https://halshs.archives-ouvertes.fr/halshs-00706791
Submitted on 11 Jun 2012
HAL is a multi-disciplinary open access archive for the deposit and dissemination of sci-entific research documents, whether they are pub-lished or not. The documents may come from teaching and research institutions in France or abroad, or from public or private research centers.
L’archive ouverte pluridisciplinaire HAL, est destinée au dépôt et à la diffusion de documents scientifiques de niveau recherche, publiés ou non, émanant des établissements d’enseignement et de recherche français ou étrangers, des laboratoires publics ou privés.
Ingratiation and Favoritism: Experimental Evidence
Stéphane Robin, Agnieszka Rusinowska, Marie Claire Villeval
To cite this version:
Stéphane Robin, Agnieszka Rusinowska, Marie Claire Villeval. Ingratiation and Favoritism: Experi-mental Evidence. 2012. �halshs-00706791�
Documents de Travail du
Centre d’Economie de la Sorbonne
Ingratiation and Favoritism : Experimental Evidence
Stéphane ROBIN, Agnieszka RUSINOWSKA, Marie-ClaireVILLEVAL
Ingratiation and Favoritism: Experimental Evidence
Stéphane Robin,a Agnieszka Rusinowska,b Marie Claire Villevalc
April 2012
Abstract: We provide experimental evidence of workers’ ingratiation by opinion conformity
and of managers’ discrimination in favor of workers with whom they share similar opinions. In our Baseline, managers can observe both workers’ performance at a task and opinions before assigning unequal payoffs. In the Ingratiation treatment, workers can change their opinion after learning that held by the manager. In the Random treatment, workers can also change opinion but payoffs are assigned randomly, which gives a measure of non-strategic opinion conformism. We find evidence of high ingratiation indices, as overall, ingratiation is effective. Indeed, managers reward opinion conformity, and even more so when opinions cannot be manipulated. Additional treatments reveal that ingratiation is cost sensitive and that the introduction of performance pay for managers as well as a less noisy measure of performance increase the role of relative performance in the assignment of payoffs, without eliminating the reward of opinion conformity.
Keywords: Ingratiation, opinion conformity, favoritism, discrimination, social distance,
experiment.
JEL Classification: C7, C92, D03, D86, M51
a
University of Lyon, F-69007, Lyon, France ; CNRS, GATE Lyon St Etienne, 93, Chemin des Mouilles, 69130 Ecully, France. Email: [email protected]
b
CES (Centre d'Economie de la Sorbonne), Paris School of Economics – CNRS, 106-112 Bd de l'Hôpital, 75647 Paris, France. Email: [email protected]
c
University of Lyon, F-69007, Lyon, France ; CNRS, GATE Lyon St Etienne, 93, Chemin des Mouilles, 69130 Ecully, France. Email: [email protected]
Acknowledgments: The authors are grateful to Jeffrey Carpenter, Gary Charness, Glen
Dutcher, Stefano Della Vigna, Seda Ertac, Armin Falk, Urs Fischbacher, Guido Friebel, Michel Grabisch, Alan Kirman, Michael Kosfeld, Marco Piovesan, Aldo Rustichini, Arthur Schram, Matthias Sutter, and participants at the conferences of the Economic Science Association in Chicago, of the European Association of Labour Economists in Cyprus, of the Society for the Advancement of Economic Theory in Faro, at seminars at the Universities of Bremen, Frankfurt, Innsbrück, Konstanz, Munich, Koc University in Istanbul, and at the EMIR and MINT workshops in Lyon and Paris. The financial support of ANR (National Research Agency) to the MINT program is gratefully acknowledged (ANR_09-BLAN-0321-01).
1. INTRODUCTION
This paper explores how interpersonal influence activities affect the assignment of rewards within a hierarchy. We study employees’ ingratiatory behavior directed at superiors who have discretion in the assignment of earnings. Ingratiation consists of various strategies including opinion conformity, self-presentation and other-enhancement.1 This paper considers the first strategy. In a work environment, ingratiation occurs when an employee aims to impress superiors by increasing his/her attractiveness.2 For example, using survey data from Forbes 500 companies, Westphal and Stern (2006) provide evidence that managers use interpersonal influence activity as a substitute for elite credentials to obtain boardroom appointments. Ingratiation may result from a willingness to reduce social distance with managers and it does not necessarily originate in informational asymmetries, in contrast to the influence activities modeled by Milgrom (1988) and Milgrom and Roberts (1988).3
Ingratiation has certainly been encouraged by the development of subjective appraisals of employees (Lazear and Gibbs, 2009). Indeed, subordinates’ ingratiation and managers’ favoritism are the two sides of the same coin. Ingratiation may be encouraged by the fact that managers frequently reward dimensions other than the strict job performance of workers.4
1
In social psychology, ingratiation is defined as “a strategic attempt to get someone to like you in order to obtain compliance with a request” (Vaughan and Hogg, 2008) or as “a class of strategic behaviors employed by a person to make himself more attractive to another” (Wortman and Linsenmeier, 1977). Opinion conformity consists of expressing preferences supporting the opinion held by a target person; self-presentation is a means of self-promotion; other-enhancement includes flattering and expressing favorable judgments of their target (Jones, 1964).
2
Ingratiation is also thought to be widespread among politicians for the support of voters, citizens for reaching priority access to certain facilities, sellers for encouraging customers to buy, individuals for facilitating mating.
3
It also differs from collusion within organizations (Tirole, 1986) as it does not involve bribing the superior to obtain the desirable outcome. In contrast to the “Yes Men” theory of Prendergast (1993), which provides a rationale for subordinates to conform to their superiors’ opinions by reporting what the superiors want to hear about employees’ efforts, ingratiation by opinion conformity is not restricted to information that directly influences a firms’ profit.
4
A survey, conducted in U.S. companies with over 1,000 employees, indicates that favoritism in workplace promotions is widespread: 84% of the 302 senior business executives interviewed online report that favoritism exists in their company, and 23% admit they have practiced it themselves (Gardner, 2011). Favoritism is defined in the study as: “Preferential treatment of an employee for assignments, credit, opinion, influence, or advancement on the basis of factors that do not directly relate to a person’s ability to perform his or her job function, such as background, ideology or gut instincts.”
Prendergast and Topel (1996) have modeled favoritism in organizations as resulting from the unavailability of objective measures of workers’ performance. Subjectivity may lead evaluators to reward preferred subordinates arbitrarily. In contrast, Bramoullé and Goyal (2011) explain that favoritism may exist even without introducing managers’ social preferences. It is seen as the equilibrium of a repeated game, since it allows a social group in which favors are traded to retain more surplus within the group. In a recent field experiment, Bandiera et al. (2009) have shown the importance of social connections in favoritism. Managers who are paid a fixed wage tend to favor the workers to whom they are socially connected, regardless of their ability. Favoritism may be harmful for the firm’s performance because it pervades the information on which job assignments are made. Levine et al. (2010) have shown that when employers have preferences that favor specific workers, they may end up hiring inefficient and too many workers. In addition, by distorting incentives, it may discourage the effort of workers who do not benefit from favors.5
To the best of our knowledge, no study has so far investigated both employees’ ingratiatory behavior and managers’ favoritism simultaneously. An important novelty of our paper is that we tie these two dimensions together to understand better their joint dynamics. Another novelty is that we provide empirical evidence on both employees’ strategic opinion conformity and managers’ favoritism, based on opinion proximity. Indeed, we have found no empirical study in economics on ingratiation and on favoritism based on opinion conformity.6,7 As managers may interpret opinion conformity as a signal of reduced social distance, our study also sheds light on discriminatory processes based on social distance.
5
Efferson et al. (2008) have shown, however, that in-group favoritism may also help populations of heterogeneous people to solve coordination problems.
6
In contrast, social psychologists have investigated ingratiatory behaviors extensively. For meta-analyses, see notably Gordon (1996) and Higgins et al. (2003) and Appelbaum and Hughes (1998) for a survey.
7
Empirical tests of favoritism focus on demographic characteristics (Goldin and Rouse, 2000; Knowles et al., 2001; Fershtman and Gneezy, 2001) or on home bias in sports (Kocher and Sutter, 2004; Garicano et al., 2005) and editing (Laband and Piette, 1994). In addition to Bandiera et al. (2009), recent experimental studies have
Since reliable survey data on ingratiation and favoritism are hardly available, we have designed a laboratory experiment in which three workers have to perform a task while the manager has discretion on how to assign unequal payoffs to them.8 In the Baseline treatment, the manager can obtain information on the workers’ performance and on their opinions about a certain topic, before assigning payoffs. Indeed, at the beginning of each experimental session, the participants have to report their opinion on four topics, related to artistic tastes and policy issues. This captures the idea that in a work environment, people develop social relations with managers by exchanging ideas on topics that are not only related to the content of their jobs. This can influence the managers when they have to assign earnings or responsibilities. Comparing the opinions of the manager and those of each worker gives a metric of their proximity. We are therefore able to measure the respective weight of relative performance and opinion proximity in the assignment of payoffs.
In our Baseline treatment, workers cannot change their opinion after learning that of the manager. In contrast, in the Ingratiation treatment workers have the option of changing their opinion before the manager knows about it. We exploit this change to identify whether workers expect managers to reward opinion proximity and whether less-able workers use it to compensate for low performance. This effect is quantified by means of an individual ingratiation index.9 By comparing the managers’ decisions in these two treatments, we study whether managers behave differently when knowing that proximity may result from ingratiation.
investigated in-group/out-group discrimination based on personal relations or social distance in trust games (Falk and Zehnder, 2007; Hargreaves Heap and Zizzo, 2009; Brandts and Sola, 2010), bargaining games (Zizzo, 2011), or competition games (Filippin and Guala, 2011; Dutcher, 2012). On social distance, see Akerlof (1997).
8
This is equivalent to considering that a manager’s effort is complementary to a worker’s effort and that the manager can spend more time working with a specific worker.
9
This index is inspired by the notion of the influence index in game theory that is used to study how influence leads a player to deviate from his inclination (Hoede and Bakker, 1982; Grabisch and Rusinowska, 2009, 2010, 2011).
Opinion conformity is, however, not always strategic.10 To disentangle ingratiation and a pure taste for conformity, a third treatment, the Random treatment, has been designed. The assignment of payoffs is now random and the manager passive, but workers are still allowed to change their opinions. The difference in the ingratiation indices in the Random and the Ingratiation treatments measures the importance of strategic conformity.
Since ingratiation and favoritism may lead to efficiency losses, we have designed three additional treatments to test the sensitiveness of ingratiation and favoritism to three policy interventions. First, we test whether ingratiation resists the introduction of a financial cost linked to changing one’s opinion. In workplace environments, increasing the cost of ingratiation may be obtained by increasing the awareness of managers, thus requiring more subtle strategies from ingratiators, or by making ingratiation more visible to other subordinates. We expect to observe less ingratiation when a higher cost reduces its net benefit. Second, we test the sensitiveness of ingratiation and favoritism to a reduction of noise in the measure of workers’ relative performance. We replace an idiosyncratic random term in the content of the task by a common random term, which makes individual outputs more comparable. In a real setting, this could be achieved via a stronger standardization of the content of tasks and a more accurate measure of individual performance. We expect a reduction of favoritism but an indeterminate effect on ingratiation. Third, we change managerial incentives from fixed pay to performance pay, by tying the manager’s compensation to the workers’ outputs. By introducing a cost for favoritism, we expect managers to reward more performance and less opinion conformity. A stronger alignment of
10
In social psychology, conformity is mainly motivated by the search for social approval (Asch, 1951; Cialdini and Goldstein, 2004). Neuroscientists have shown that the brain analyzes a deviation from the group opinion as a punishment (Berns, 2008; Klucharev et al., 2009). Economists give three explanations for conformity. First, herding behavior (Banerjee, 1992; Scharfstein and Stein, 1990) and informational cascades (Bikhchandani et al., 1992) result from informational deficits. Second, in Bernheim (1994), conformity results from the impairment of status in case of departure from a social norm (see also Akerlof, 1980; Jones, 1984). Third, in Katz and Shapiro (1986), acting similarly may create mutual positive externalities.
managerial incentives with the firm’s interests could possibly lead workers to reducing their ingratiatory behavior.
Our main findings are as follows. First, a majority of workers change their opinion after learning the manager’s opinion. While a pure taste for conformity is also identified, most of this behavior is strategic. Second, the ingratiation index and performance are negatively correlated. The fear of not being a frontrunner in terms of performance may lead workers to compensate by expressing opinions that will make them more likeable in the eyes of the manager. Ingratiation decreases in its moral costs depending on the topic and the strength of opinion. More precisely, the ingratiation index is smaller when an individual values more his opinion, and is larger when opinions are related to highly debated policy issues. The latter relationship could suggest that ingratiation is not only acquisitive (i.e. driven by the desire to access valuable resources at a minimal cost) but also protective (i.e. motivated by the willingness to prevent a possible sanction in case of a visible disagreement) (see Jones, 1964).
Third, ingratiation does not disappear over time because workers learn that a significant proportion of managers reward opinion conformity. If a majority of managers behave in accordance with a meritocratic principle and reward the most able individuals, a shorter social distance is also rewarded. Managers discriminate against the individuals who express more distant opinions, especially when opinions are about much debated topics and when workers’ opinions are more conservative. However, knowing that workers can conform strategically reduces the influence of social distance in the assignment of high payoffs.
Fourth, the limited feedback about who gets the high payoff prevents a decline in the motivation of able workers who would observe that they are sometimes passed over by less able, ingratiating workers. We find that imposing a financial cost for changing one’s opinion discourages ingratiation. The introduction of performance pay for managers increases significantly the role of relative performance in the assignment of payoffs, relative to opinion
proximity. This result is consistent with Bandiera et al. (2009) who find that managerial performance pay increases the productivity of high ability workers, especially those who have no connection with the manager. Performance pay does not, however, eliminate completely discrimination in favor of similarly-oriented workers and it does not affect ingratiatory behavior. Finally, reducing the noise in the measure of workers’ relative ability also reinforces the role of relative performance in the assignment of payoffs, but slightly less than managerial performance pay.
Overall, our paper confirms the importance of social distance in strategic decision-making and suggests directions for limiting the importance of ingratiation and favoritism. The remainder of the paper is structured as follows. In Section 2, we present a simple theoretical model. Section 3 describes the experimental design and procedures. Section 4 presents the experimental results. Section 5 discusses these results and concludes.
2. A MODEL OF INGRATIATION AND FAVORITISM 2.1. Description of the model
We consider a model with a manager and workers, which allows us to analyze managers’ favoritism and workers’ ingratiation at the same time. The manager’s task is to assign unequal earnings to the workers. Two levels of payoffs to the workers are possible, H and L, where H > L and workers compete to get the winning prize, H.11 The manager has to choose which worker gets H, with L being assigned automatically to every other worker.
It is assumed that before assigning the payoffs, the manager can observe both workers’ performance at a task and their opinions on some issues. The performance of worker k is given by:
yk = ek + k
11
This aspect of the model is similar to a rank-order tournament with a winning-losing prize structure (Lazear and Rosen, 1981).
where ek measures the effort exerted by the worker or his skill, and k is an idiosyncratic
random or luck component drawn from a known distribution with a zero mean and variance σ2. The worker’s cost of supplying effort is c(e
k), with c’, c” > 0. Each worker has his
preliminary opinions on certain topics that are known neither to the manager nor to other workers. The manager expresses publicly her opinions on the topics. After learning about the manager’s opinion and performing the task, each worker reports his opinion. The final (reported) opinion of the worker might differ from his initial opinion, which allows for ingratiatory behavior directed at the manager.
The manager’s utility is given by:
perf dist
m
m w w w
u
where wm is the manager’s own payoff, wdist denotes the payoff of the worker with the lowest
distance between his opinion and the opinion of the manager, and wperf denotes the payoff of
the worker with the best performance. 0 and 0 measure the intensity of the manager’s preference for one of the two types of workers, respectively. We do not impose any relation between α and β. characterizes a manager who favors more workers who share more similar opinions, with a particular case of the opinion-oriented manager when
0
. Similarly, describes a manager who favors the best performance more than opinion similarity. This manager is called a meritocratic manager when 0. The case when means that the manager has equal preference for both kinds of workers. An
indifferent manager does not pay attention to either performance or opinion and is
characterized in the model by 0. We assume that
, are unknown to the workers. It should be noted that our model extends the framework of favoritism studied in Prendergast and Topel (1996), in which the manager observes only performance.
The degree of the worker’s ingratiation by opinion conformity is measured by the so-called ingratiation index, which is defined similarly to the influence index in the framework of influence in a social network (Grabisch and Rusinowska, 2009, 2010). Let k
ini
d denote the distance between the initial opinion of the worker k and the opinion of the manager, and dfink
be the distance between the final (reported) opinion of the worker and the opinion of the manager. For all dinik 0and k
fin k ini d
d we define the ingratiation index by: 12
] 1 , 0 [ k ini k fin k ini k d d d I
When ingratiation is possible (i.e. dinik 0) the worker’s ingratiation is the choice of the ingratiation index Ik.13 The higher Ik is, the stronger is the worker’s ingratiation behavior. In
particular, Ik=0 reports no ingratiation behavior and Ik=1 corresponds to perfect ingratiation.
The cost function of ingratiation is given by:
Ck(Ik)(ckckmo(s))I k
where ck is a financial cost (possibly equal to 0), and ckmo(s) denotes the moral cost of
ingratiation which is a function of the strength s of the worker’s opinion. cmo(s)
k increases in
s, i.e., the more important his personal opinion on a given topic is to the worker, the higher is
his moral cost of ingratiation.14 Obviously, Ck (0) = 0 and
Ck(1)ckckmo(s).
Let us determine now the workers’ utility. By N we denote the set of workers, where its cardinality |N| = n. The choice function of the manager is a function
P, : Rn R
n N
which assigns to every vector of distances and performances (D,Y) one worker (the one
12
Since each worker reports his final opinions to the manager after receiving a feedback on his performance, dkfin (and consequently Ik) depends on the performance yk. To simplify the notation we do not add this
dependence to the formula of Ik.
13
Equivalently, the ingratiation decision means the choice of the distance dkfin, since dkini is given and known by
the worker before he makes the ingratiation decision.
14
The moral cost may also depend on the specificity of the topic. For simplicity, we do not add it to the theoretical model, although we take this into account in the experimental design.
selected for the wage H). The vector (D,Y) is the 2n-vector, in which n’s first coordinates are distances between the final opinions of the workers and the opinion of the manager, and n’s last coordinates are the workers’ performances. Since workers have to choose their ingratiation behavior without knowing parameters
, , it is a problem of decision under uncertainty. A state of nature corresponds to a pair (,). The set of states of nature is therefore equal to 2
R . The act of the worker k is a function fIk R
k : such that: k Y D P if e c I C L k Y D P if e c I C H f u k k k k k k k I k k ) , ( ) ( ) ( ) , ( ) ( ) ( )) , ( ( ) , ( , ,
The worker’s decision is the ingratiation index Ik that maximizes his expected utility:
))) , ( ( ( max arg , k Ik I k k f u E , where E,(uk( fIkk(,))) u k( fIk k(,))p(,)d
dwith the probability distribution of (,) denoted by p(,).
2.2. Behavioral hypotheses
The theoretical model delivers some behavioral predictions about ingratiation, favoritism, and the impact of three policies (the improvement of the measurement accuracy of relative performance, the introduction of a financial cost of ingratiation, and the introduction of managerial performance pay).
On the worker’s side, there is a trade-off in the worker’s utility uk: the worker may increase
his ingratiation index Ik in the hope of receiving the payoff H, but by doing so he bears a
higher cost. Can ingratiatory behavior be advantageous? Let the worker’s performance be equal toyk ekk. Giveny , let k argmax ,( ( (,)))
k I k I k k k f u E
I with the value Ck(Ik) of the corresponding cost function. We expect that some workers choose Ik 0. For 0
k ini
d and the states of nature (,0) and (,) with close to 0, the choice Ik 0 could lead to
k Y D
P,( , ) and to the worker’s utility uk Lc(ek). Choosing a sufficiently larger
0
k
I to end up with P,(D,Y)k would give the higher utility uk HCk(Ik)c(ek) if
the financial and moral costs of ingratiation are sufficiently small, i.e., if
k mo k k I L H s c c ( ))
( . We therefore express the following prediction:
Proposition 1: Provided the costs of ingratiation are sufficiently low, the worker should report opinions that reduce the distance with the manager.
What change of the ingratiation index can be expected if the worker’s performance increases? Suppose that the worker’s performance is yk and is higher than yk, and results from a higher effort ek ek, i.e., c(ek)c(ek). If the improved performance does not lead to a switch from P,(D,Y)k to P,(D,Y)k, then the new ingratiation index Ik should be smaller, otherwise the worker’s utility would decrease. However, if the increase in performance switches utility from (LCk(Ik)c(ek)) to (HCk(Ik)c(ek)), then the new ingratiation index should not necessarily decrease. More precisely, the worker’s utility will
not decrease with the new (higher) performance if
mo k k k k k k I s c c e c L e c H I ) ( )) ( ( )) ( ( .
Hence, indeed Ik Ik when (Hc(ek))(Lc(ek)), but when (Hc(ek))(Lc(ek))
both directions of change in the ingratiation index are possible.
Proposition 2: Depending on the relation between H, L, and the costs of effort, an increase in worker’s performance should usually (although not always) decrease ingratiation.
How does an increase in the costs of changing opinions affect the ingratiatory behavior? Since the worker does not want to decrease his utility, i.e., to increase the value of
k mo k k k k I c c s I
smaller ingratiation index. In particular, an increase in the strength of opinion s will give a smaller ingratiation index, since ckmo(s)is increasing in s. We then have:
Proposition 3: Increasing the costs of ingratiation decreases ingratiation.
On the manager’s side, we are interested in observing if both opinion-oriented and meritocratic managers exist, i.e., if both 0 and 0 are identified in the experiment, and in which proportion. Since every manager should, in principle, care about good performances as they represent the firm’s interests, we expect that the case of 0 is rare. We predict then the following:
Proposition 4: The manager’s preference should be expressed rather by 0 than by
0
.
The parameter that measures the intensity of the manager’s preference for opinion proximity should be lower when the manager is sure that workers can change their opinion. We make the following statement:
Proposition 5: Introducing the possibility of ingratiation decreases .
The parameter measures the intensity of the manager’s preference for performance. Consequently, an improvement of the accuracy of measuring relative performance of the worker should increase. Precisely, accuracy is improved if one replaces the idiosyncratic error term by a common shock in the definition of individual output (yk = ek + ε); indeed, the
difference in relative performance between workers now depends only on effort and skill and no longer on personal luck. Similarly, if we relate the manager’s payoff to the performance of the workers, then the manager should focus more on the workers’ performance and less on opinions. Introducing managerial performance pay yields a new payoff function, such as:
wm w0 yk
k
with w a fixed wage, y0 k the performance of worker k, and γ a multiplier ofworkers’ performance. This leads us to the following statement.
Proposition 6: Improving the accuracy of relative performance measures and introducing
managerial performance pay both increase.
3. THE DESIGN OF THE EXPERIMENT
Let us describe first how we elicited opinions before introducing each treatment and the procedures used.
3.1. Elicitation of opinions
In the first part of each session, we elicited the participants’ opinions on four topics displayed in random order. As we suspect ingratiation to be domain-dependent, we chose two topics related to tastes and two others related to highly debated policy issues. Specifically, the participants had to look at a naïve art painting and to listen to a piece of reggae music, each during a minimum of 20 seconds and a maximum of two minutes. Then, they had to rate their taste for the painting and the music on a scale ranging from 1 (“I hate it”) to 100 (“I adore it”). They also had to rate their opinion on two statements: “One should introduce a carbon tax to change the course of global warming” and “One should regularize illegal immigrants”, between 1 (“I am extremely unfavorable”) and 100 (“I am extremely favorable”). They were informed that their responses were anonymous but would be used in the next parts of the session with no additional information.
Since our model assumes that ingratiation is negatively correlated with the strength of one’s opinion (as a measure of the moral cost of ingratiation), participants had to indicate the importance of each response on a 10-level Likert scale between 1 (“my answer has no real
value for me; I could have answered completely differently”) and 10 (“my answer represents a lot to me”). Answers were not incentivized because of the policy-related questions.
3.2. Main treatments
Our experiment included three treatments called Baseline, Ingratiation, and Random. Each treatment consists of 12 periods.
Consider the Baseline first. At the beginning of each period, groups of four were formed randomly. Each group included one manager (“participant A”) and three workers (“participants B”). Roles were assigned randomly and they were kept constant throughout the session. In each period, the workers had to perform a task. The task consisted of answering two questions taken from a trivia quiz on general knowledge; the random draw of questions was i.i.d and this was common information. The manager had to assign payoffs to the workers, namely one payoff of 10 points (with a conversion rate of 18 points = €1) and two payoffs of 5 points. The manager was paid a fixed wage of 12 points. A fixed wage allows us to observe the natural inclination of the manager for meritocracy or for opinion proximity. Each period had three stages. In the first stage, groups were formed and workers were informed about their manager’s opinion on one randomly selected topic (painting, music, carbon tax statement or immigration statement). In the second stage, workers performed the task. It was common knowledge that questions varied across workers. Each worker was only informed of his own score (0, 1, or 2, corresponding to the number of correct answers in the quiz).15 In the third stage, the manager chose which workers received the high payoff. She could press two buttons for free before assigning payoffs. One button was for asking information about each worker’s score and the other one for asking their opinion on the issue
15
Imposing a random assignment of questions to each player is equivalent to introducing an idiosyncratic random term in the payoff function. This random term and the limited possible difference in performance between workers aim at recreating some noise in the measurement of relative performance. This is relaxed in a further treatment.
selected in the first stage. Each button was randomly disposed on the left or the right of the screen in order not to force the manager’s attention on any information. At the end of each period, workers were informed about their payoff, but not on whether the manager had asked for information. Groups were rematched at the beginning of the next period.16 This treatment allowed us to determine the respective influence of relative opinion and performance on assigning payoffs.
There is only one difference between the Ingratiation treatment and the Baseline: workers were allowed to change their initial opinion before it was made available to the manager and after receiving a feedback on their score. They were reminded about the manager’s and their own initial opinions; they could change opinion by moving a slider. The manager knew that workers could modify their opinion but she only observed the reported opinions without knowing whether they had been changed or not. Note that the managers could not change their own opinion. As before, workers did not receive any information about other workers’ opinions or scores. This treatment allowed us to determine i) the value of the ingratiation index and ii) its relationship with performance, opinion topic, and the strength of opinions. Comparing the Baseline and the Ingratiation treatments indicates whether the respective weights of relative scores and opinions differ when managers know that opinions can be manipulated strategically.
Workers may change their opinion strategically but also because they like conforming to the opinion of a high status person (the manager). To disentangle these two reasons, the Random treatment is different in one way to the Ingratiation treatment. Workers can still change their opinion but managers are now passive: workers’ payoffs are assigned randomly. In this context, we assume that a change in opinion is driven by a taste for conformity.
16
Using a stranger matching protocol eliminates by design that managers favor workers with more similar opinions to build reciprocal relationships based on favoritism and favor rendering.
Comparing Ingratiation and Random treatments indicates to what extent opinion conformity is strategic.
Each participant played in two treatments. In some sessions, they played the Baseline followed by the Ingratiation treatment. In other sessions, they played the Ingratiation treatment followed by the Random treatment. We controlled for order effects by reversing the order of treatments in other sessions.
3.3. Policy interventions
We tested the sensitiveness of ingratiation and favoritism to three policy interventions: a reduction of the noise in the measurement of relative performance; the introduction of a financial cost for changing opinion; and a shift of managerial compensation from a fixed wage to performance pay. Each intervention corresponded to a new treatment.
In the Baseline-Policy 1 and Ingratiation-Policy 1 treatments, we increased the precision of relative performance measures. The three workers then received the same trivia quiz that consisted of four questions of the same level of difficulty instead of two. This reduced the role of idiosyncratic luck in relative performance. Comparing these treatments with the original ones indicates whether, when the score is more informative of the worker’s relative ability, i) the influence of scores is reinforced while that of opinions decreases and ii) the expected negative correlation coefficient between ingratiation indices and scores increases.
The Ingratiation-Policy 2 and Random-Policy 2 treatments introduce a fixed cost for changing one’s opinion. It costs 1 point for the worker to change opinion regardless of the size of the change (which corresponds to 20% of the low payoff and 8.33% of the high payoff). Comparing these treatments with the original ones indicates whether: i) ingratiation is cost-sensitive, and ii) managers pay more attention to opinions when ingratiation is costly.
In the Baseline-Policy 3 and Ingratiation-Policy 3 treatments, we introduced performance pay by tying the manager’s payoff to the sum of the three workers’ scores. Under performance pay, the manager’s payoff function becomes:
3 1 0 10 0.5 k k k k m w y y w The parameter 0 captures the strength of managerial incentives. It has been chosen so that on average the managers earn 12 points, as in the main treatments.17 We tested whether such a change in managerial incentives: i) leads managers to reward more scores and less opinion proximity than under a fixed compensation; and ii) as a consequence, leads to a reduction in ingratiatory behaviors.
3.4. Procedures
The experiment was computerized, using the REGATE-NG software (Zeiliger, 2000). 29 sessions were conducted at the laboratory of the Groupe d’Analyse et de Théorie Economique
(GATE), Lyon, France. Between 12 and 20 individuals took part in each session, for a total of
500 participants invited via the ORSEE software (Greiner, 2004). In total, we observed 125 “managers” and 375 “workers”. The participants were undergraduate students from the local Engineering and Business schools. Table A1 in Appendix 2 indicates the number of participants and the treatments played in each session.
Upon arrival, the participants were randomly assigned to a terminal by drawing a tag from a bag. Instructions for the elicitation of opinions were distributed and read aloud (see Appendix 1). Headphones were placed at the disposal of the participants. After all of them expressed their opinions on the four issues, instructions were distributed for the next part.
17 An alternative would be to make the manager’s payoff depend on the score of the worker who receives the
high payoff. This would allow us to measure how much money managers are willing to forego to favor opinion conformity instead of performance. This could be tested in an extension of the present paper. Our less direct payoff function enabled us to test whether making the reference to performance more salient suffices to reduce favoritism.
After checking individually the understanding of the instructions by means of a questionnaire, roles were assigned and participants played the 12 periods of a given treatment with a random re-matching of groups after each period. Then, the instructions for the 12 periods of a second treatment were distributed. At the end of the session, after completing a demographic questionnaire, the participants were allowed to proceed to the payment room one by one.
At the end of the session, the payoffs of all the periods were added up and converted into Euro for payment. Sessions lasted on average 75 minutes, including the payment of participants, and each participant earned €14.78 on average, including a show-up fee of €4.
4. RESULTS
In this section, we first analyze the workers’ ingratiatory behavior. Then we study whether and by how much opinion conformity matters relative to performance in the assignment of payoffs. In a final sub-section we report the results of the policy interventions.
4.1. Ingratiatory behavior
To measure opinion conformity and ingratiation, we first calculate the distance between the manager’s and the worker’s opinions at two different moments in the game. We compare the initial distance between the opinions expressed preliminarily and the final distance between opinions after workers can change their opinion. Table 1 reports summary statistics for each treatment indicating, for the cases in which initial opinions differ, the number of changes in opinions in each direction, the number of observations with perfect or almost perfect ingratiation, and the mean ingratiation index.18 Perfect ingratiation indicates a change in opinion designed to match exactly the opinion of the manager; almost perfect ingratiation corresponds to the cases in which the initial distance is higher than 2 and the final distance does not exceed 2. The ingratiation index is calculated as the difference between the initial
18
In the Random treatment, it would be formally more correct to name this index “conformity index”. We retain the notion of an ingratiation index for both treatments for simplicity.
distance between the manager’s and the worker’s opinions and the final distance in opinions, divided by the initial distance. It excludes the observations in which the final distance is greater than the initial distance.
Table 1. Summary statistics
Treatments Baseline Ingratiation Random
Same initial opinion as the manager’s Different initial opinion
Total 65 (4.75%) 1303 (95.25%) 1368 (100%) 130 (4.63%)ns 2678 (95.37%) ns 2808 (100%) 74 (5.14%)ns 1366 (94.86%) ns 1440 (100%) Sub-sample of observations with a different initial opinion
Change between final and initial distance - Increased distance - Same distance - Decreased distance Total - 1303 (100%) - 1303 (100%) 167 (6.24%) 995 (37.15%) 1516 (56.61%) 2678 (100%) 116 (8.49%) ns 819 (59.96%)*** 431 (31.55%)*** 1366 (100%)
Perfect ingratiation (same final opinion) Almost perfect ingratiation (same +/- 2)
- - 301 (11.24%) 477 (18.57%) 63 (4.61%)*** 103 (7.72%)***
Mean ingratiation index - 0.42 (0.26) 0.19 (0.19)***
Note: The Table reports the significance of two-tailed Mann-Whitney tests comparing, in the upper part of the Table, each of the Ingratiation and Random treatments with the Baseline, and in all the other cases, the Random with the Ingratiation treatment.19 ns indicates no significance and *** indicates significance at the 1% level.
Table 1 shows that in the Ingratiation treatment, slightly more than one third of the participants kept the same opinion after learning that it differs from that of the manager, while 56.61% of the participants conformed with the manager’s opinion, and 11.24% even matched the manager’s opinion perfectly. An important part of this behavior is strategic, as in the Random treatment less than one third of the participants reduced the distance in opinions and perfect conformism represents only 4.61% of the observations.
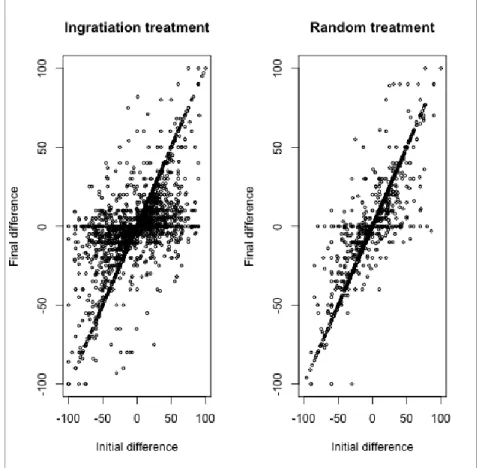
As a complement, Figure 1 represents the initial difference (i.e. the difference between the opinion of the manager and the initial opinion of the worker) on the x-axis, and on the y-axis the final difference (i.e. the difference between the opinion of the manager and the opinion reported by the worker), for each observation in any period of the game. The left- and right-hand panels are for the Ingratiation and the Random treatments, respectively.
19
Strictly speaking, one session provides only one independent observation. Here, the mean value of each variable per worker and per treatment is considered as one independent observation. All the non-parametric statistics reported in this paper are two-tailed Mann-Whitney tests, using the same notion of an independent observation, unless specified otherwise.
Fig. 1. Distribution of initial and final differences between the manager’s and worker’s opinions
Figure 1 identifies four situations. The diagonal indicates that opinions have not been changed. The dots on the horizontal line corresponding to a final difference of zero indicate that the worker and the manager share the same opinion. When the initial difference is not equal to zero, this reveals perfect ingratiation. A third situation is represented by the few dots located below (above) the diagonal, when the initial difference is negative (positive): workers increase distance with the manager, which can be seen as anti-conformism (this is outside the scope of this study). Almost all the other cases correspond to ingratiation or conformism. The two panels indicate that many workers change opinion in the Ingratiation treatment, while many observations lie on the diagonal in the Random treatment.
Next, we analyze the determinants of the probability for a worker to increase, keep constant or decrease the distance in opinion with the manager. We estimate multinomial Logit models with robust standard errors clustered at the worker level. Clustering is required
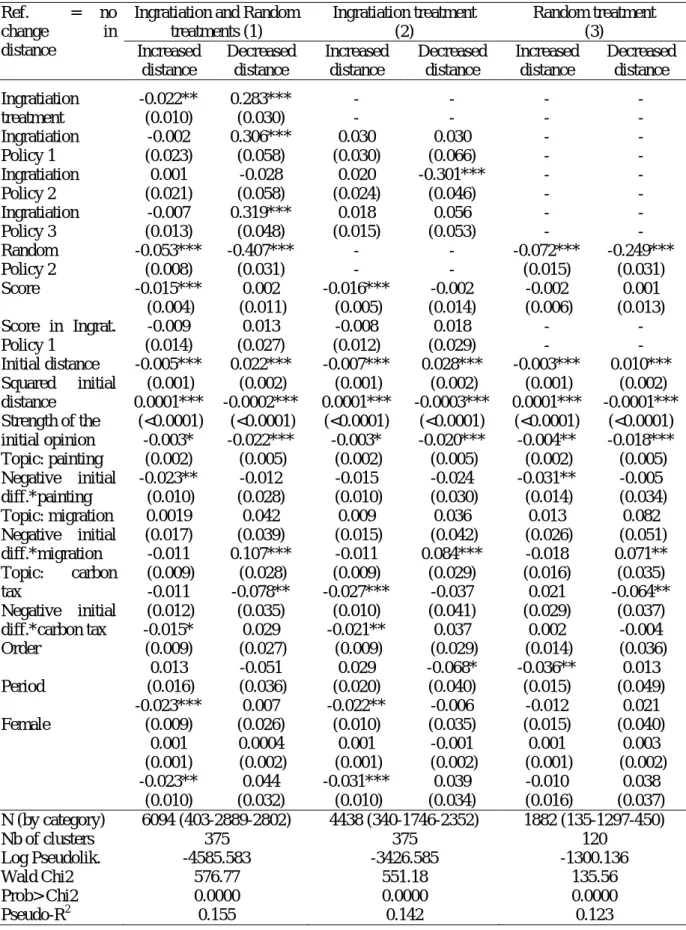
as each participant is observed 24 times. The reference category is when the worker does not modify his initial opinion. In Model (1), we pool the data from the Ingratiation and Random treatments and include a dummy variable for the Ingratiation treatment among the independent variables. Model (2) is for the Ingratiation treatment and Model (3) for the Random treatment. In the three models, the independent variables include the score, as we expect that ingratiation is more likely when workers perform poorly. Regarding opinions, we include the distance between the manager’s and the worker’s initial opinion, the squared distance between initial opinions to allow for non-linearity, and the strength of the opinion reported in the preliminary part. We allow ingratiation to differ according to the opinion topic, by including a dummy variable for each topic. To measure whether the ordinal position of the worker’s opinion relative to that of the manager matters, we include “negative initial difference” variables indicating whether the worker’s opinion was more favorable than that of the manager. For the carbon tax statement or immigration statement, a negative initial difference is observed when the worker's opinion is more conservative than the manager's one. We finally control for the order between treatments (with a dummy variable equal to 1 when the Ingratiation treatment is played first, and 0 otherwise), the period in the treatment and the worker’s gender. Table 2 reports the marginal effects.
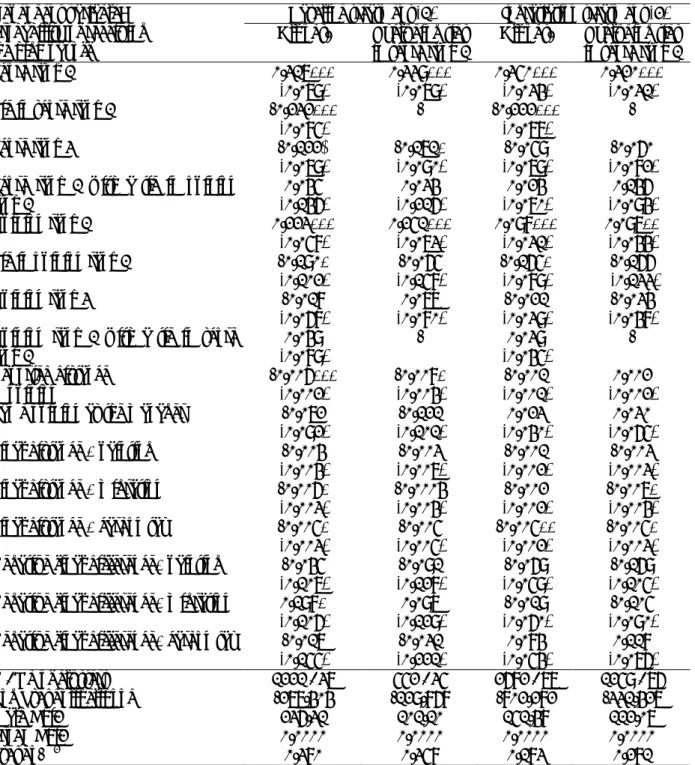
Table 2. Determinants of the probability of varying the distance in opinion with the manager - Multinomial Logit models with robust standard errors and clustering at the worker level
Ref. = no change in distance
Ingratiation and Random treatments (1) Ingratiation treatment (2) Random treatment (3) Increased distance Decreased distance Increased distance Decreased distance Increased distance Decreased distance Ingratiation treatment Score Initial distance Squared initial distance Strength of the initial opinion Topic: painting Negative initial diff.*painting Topic: migration Negative initial diff.*migration Topic: carbon tax Negative initial diff.*carbon tax Order Period Female -0.023* (0.013) -0.017*** (0.005) -0.004*** (0.001) 0.00004** (<0.001) -0.003* (0.002) -0.021 (0.013) 0.0004 (0.018) -0.022* (0.012) 0.004 (0.020) -0.016 (0.012) 0.005 (0.018) -0.026** (0.011) 0.002 (0.001) -0.026* (0.014) 0.280*** (0.029) 0.007 (0.013) 0.022*** (0.002) -0.0002*** (<0.001) -0.027*** (0.006) -0.019 (0.036) 0.085* (0.047) 0.123*** (0.033) -0.116*** (0.041) 0.047 (0.035) -0.063 (0.044) 0.020 (0.029) 0.001 (0.002) 0.050 (0.040) - - -0.023*** (0.005) -0.004*** (0.001) 0.0004*** (<0.001) -0.003 (0.002) -0.011 (0.013) -0.0004 (0.018) -0.023** (0.012) -0.006 (0.018) -0.027** (0.012) 0.040 (0.027) -0.027** (0.013) 0.002* (0.001) -0.026** (0.013) - - 0.004 (0.015) 0.025*** (0.002) -0.0002*** (<0.001) -0.025*** (0.006) -0.037 (0.038) 0.079 (0.048) 0.111*** (0.035) -0.086* (0.050) 0.073** (0.036) -0.116** (0.049) 0.008 (0.041) -0.0003 (0.003) 0.037 (0.042) - - 0.003 (0.010) -0.003** (0.001) 0.0004** (<0.001) -0.004 (0.004) -0.036 (0.024) -0.001 (0.034) -0.018 (0.027) 0.023 (0.042) 0.009 (0.023) -0.051 (0.023) -0.013 (0.024) 0.001 (0.002) -0.019 (0.025) - - 0.002 (0.019) 0.012*** (0.003) -0.0001*** (<0.001) -0.026*** (0.007) 0.012 (0.052) 0.082 (0.065) 0.113** (0.049) -0.132** (0.053) -0.001 (0.051) 0.016 (0.069) 0.028 (0.052) 0.004 (0.003) 0.063 (0.053) N (by category) Nb of clusters Log Pseudolik. Wald Chi2 Prob> Chi2 Pseudo-R2 4004 (283-1814-1947) 234 -3233.292 352.91 0.0000 0.109 2678 (167-995-1516) 234 -2051.514 309.45 0.0000 0.112 1366 (116-819-431) 120 -1147.994 64.54 0.0000 0.045
Note: The table reports the marginal effects, with robust standard errors in parentheses. *, **, and *** indicate significance at the 10%, 5% and 1% level, respectively. The number of observations (N) by category refers to the number of observations in which workers increase the distance, keep the distance stable and decrease the distance, respectively.
The estimates of Model (1) show that the Ingratiation treatment increases the likelihood of shifting one’s opinion towards the manager by 28%, compared to the Random treatment. The score has no effect, which may be due to the expectation of ties. In contrast,
the probability of reducing the distance increases with the initial distance, at a decreasing rate. As predicted, it is lower when the participant reported a stronger belief in his opinion. Interestingly, some topics are more likely to lead to ingratiation. The statement about the regularization of illegal immigrants increases by 12.27% the likelihood of reducing the distance in opinion. This effect is asymmetric: it vanishes when the worker holds opinions that are more liberal than that of the manager. In other words, ingratiation/conformism is more likely when the worker is more conservative than the manager on this issue.20 When treatments are considered separately (Models (2) and (3)), the impact of the initial distance is twice as important in the Ingratiation than in the Random treatment (2.52% vs. 1.20% for each difference point, respectively).
Table 2 also indicates that the probability of increasing the distance with the manager’s opinion is marginally lower in the Ingratiation treatment. It is also reduced when the score is lower (only in the Ingratiation treatment), when the initial distance is higher (but non-linearly), when workers hold stronger initial opinions and when opinions are related to policy issues in the Ingratiation treatment. Women are also less likely to be anti-conformist.
Next, to explain the magnitude of changes in opinion we estimate the determinants of the ingratiation index. We estimate Tobit models with robust standard errors clustered at the worker level, since the index is censored both at 0 (no change in opinion) and at 1 (perfect ingratiation).21 By definition, we exclude anti-conformist workers and individuals who have the same initial opinion as the manager. The independent variables are the same as in Table 2 (except the distance in opinions since it is used to calculate the dependent variable). Model
20
This effect is not due to a specific distribution of the differences in initial opinions in this topic relative to the other topics (see Figure 1A in Appendix that displays the distribution of differences in opinions for each topic separately). Nor is this due to a difference in the strength of opinion across topics. Two-tailed Wilcoxon tests with each worker as an independent observation show that the strength of the opinion is not different between music (reference), migration policy (p=0.780) and carbon tax policy (p=0.437); opinions are less certain about painting (p<0.001).
21
We also estimated a two-step model to deal with a potential selection bias, with a Probit model with clustered robust standard errors in the first step, and an OLS model including the Inverse of Mill’s Ratio in the second step. Since IMR was not significant, we report here the estimates of Tobit models accounting for censored data.
(1) pools the data from the Ingratiation and Random treatments, while Models (2) and (3) analyze each treatment separately. Table 3 reports the estimates.
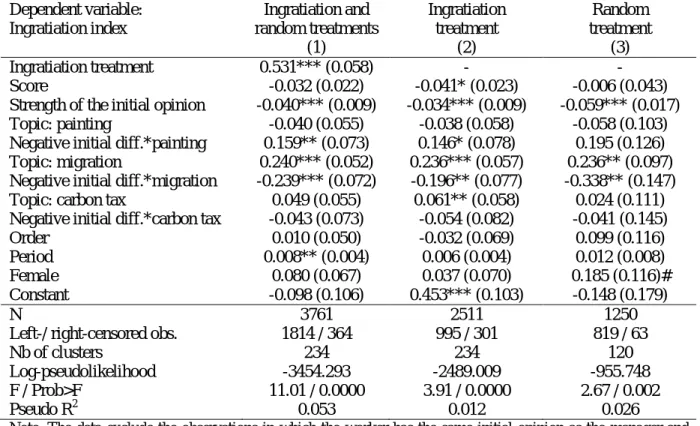
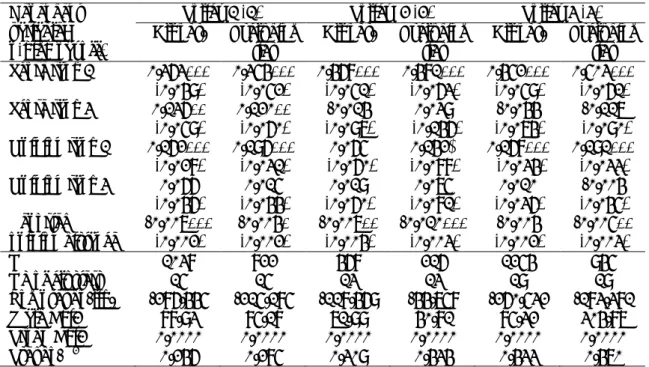
Table 3. Determinants of the ingratiation index - Tobit models with robust standard errors and clustering at the worker level
Dependent variable: Ingratiation index Ingratiation and random treatments (1) Ingratiation treatment (2) Random treatment (3) Ingratiation treatment Score
Strength of the initial opinion Topic: painting
Negative initial diff.*painting Topic: migration
Negative initial diff.*migration Topic: carbon tax
Negative initial diff.*carbon tax Order Period Female Constant 0.531*** (0.058) -0.032 (0.022) -0.040*** (0.009) -0.040 (0.055) 0.159** (0.073) 0.240*** (0.052) -0.239*** (0.072) 0.049 (0.055) -0.043 (0.073) 0.010 (0.050) 0.008** (0.004) 0.080 (0.067) -0.098 (0.106) - -0.041* (0.023) -0.034*** (0.009) -0.038 (0.058) 0.146* (0.078) 0.236*** (0.057) -0.196** (0.077) 0.061** (0.058) -0.054 (0.082) -0.032 (0.069) 0.006 (0.004) 0.037 (0.070) 0.453*** (0.103) - -0.006 (0.043) -0.059*** (0.017) -0.058 (0.103) 0.195 (0.126) 0.236** (0.097) -0.338** (0.147) 0.024 (0.111) -0.041 (0.145) 0.099 (0.116) 0.012 (0.008) 0.185 (0.116)# -0.148 (0.179) N
Left-/ right-censored obs. Nb of clusters Log-pseudolikelihood F / Prob>F Pseudo R2 3761 1814 / 364 234 -3454.293 11.01 / 0.0000 0.053 2511 995 / 301 234 -2489.009 3.91 / 0.0000 0.012 1250 819 / 63 120 -955.748 2.67 / 0.002 0.026
Note: The data exclude the observations in which the worker has the same initial opinion as the manager and those in which the worker increased his distance with the manager. Robust standard errors are in parentheses. *, **, and *** indicate significance at the 10%, 5% and 1% level, respectively. # indicates borderline significance at the 11% level.
The higher index in the Ingratiation than in the Random treatment confirms the presence of strategic conformism. It decreases consistently with the score, but only in the Ingratiation treatment. The strength of the initial opinion reduces the magnitude of the change in both treatments but the coefficient is much larger in the Random than in the Ingratiation treatment, which suggests that people have less self-control in a more strategic environment. In the Ingratiation treatment, the index increases when opinions are relative to the two policy statements. In the Random treatment, the index is also higher for the workers who hold a more conservative opinion on migration policy, indicating that this highly debated topic leads to a greater need for conformism even in the absence of strategic considerations, perhaps due
to a social desirability bias. Finally, the index of women (females) in the Random treatment is not far from reaching significance (11%).22
To summarize, our analysis of workers’ behavior supports the following results:
Result 1. Many workers change their initial opinion strategically after learning about the
opinion of the manager, in the hope of getting a favor. We also observe a pure taste for conformity. This supports Proposition 1.
Result 2. The ingratiation index is negatively correlated with performance. This supports
Proposition 2.
The following result supports Proposition 3:
Result 3. A higher moral cost of conformity (a stronger initial opinion) reduces ingratiation.
Those who reported initially more conservative opinions on highly debated issues have a consistently higher ingratiation index.
We turn now to the managers to analyze the determinants of the payoff assignment.
4.2. Performance and opinion proximity in payoff assignment
89.25% of the managers asked information on both the workers’ scores and opinions in the Baseline; the corresponding values were 95.51% and 82.08% in the Ingratiation and the Random treatments, respectively. Mann-Whitney tests conclude there is a significant difference between the Baseline, and both the Ingratiation treatment (p=0.052) and Random treatment (p=0.085) on the one hand, and between the Ingratiation and Random treatments (p<0.001) on the other hand.
22
We estimated the same models on the restricted sample of workers who strictly reduced the distance in opinion with the manager. The main changes in the results are an increased level of significance of the score in the Ingratiation treatment (at the 5% level) and a loss of significance of the topic variables in both treatments, except for the negative impact of having more liberal opinions on illegal immigration in the Ingratiation treatment.
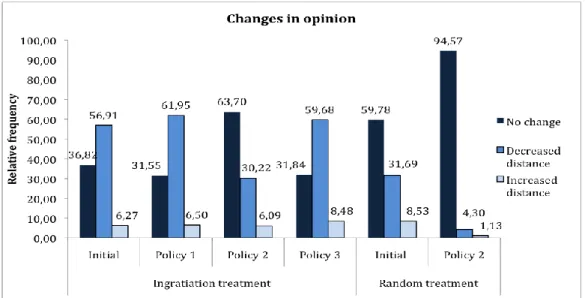
Before estimating its individual determinants, we report descriptive statistics about the rate of success of a worker depending on his ranking in the triad, based on his performance and opinion distance. The “score rank” 1 (3) is assigned to the worker who gets the highest (lowest, respectively) score in the triad; the “opinion rank” 1 (3) is assigned to the worker whose reported opinion is the closest (most distant, respectively) to the manager’s opinion. Ranks 2 are assigned to intermediate scores or opinions. In the Baseline, the share of best performers who receive the high payoff is 42.49% (56.68% after exclusion of ties among the best performers); in the Ingratiation treatment, the percentages are 46.55 (Mann-Whitney test comparing Ingratiation and Baseline: p=0.259) and 67.57 (p=0.152). Figure 2 displays the relative frequency of workers who get the high payoff depending on both ranks, by treatment.
Fig. 2. Percentage of workers receiving the high payoff by ranks and treatment
For each opinion rank, Figure 2 indicates that having the first score rank always increases the likelihood of receiving the high payoff in the Baseline. But it also shows that for any score rank, having the first opinion rank increases dramatically the probability of receiving the high payoff. Only the first opinion rank allows a worker to earn more than a random assignment of payoff regardless of the score rank, whereas having the first score rank makes the worker better off than a random assignment only if he also holds the first opinion rank.
The Ingratiation treatment rebalances the influence of relative scores and opinions: the first opinion rank is rewarded considerably less than in the Baseline. Now, only the first score rank allows a worker to earn more than a random assignment, except when he holds the third opinion rank. Managers put less weight on opinions when they expect brownnosing.
To study the determinants of which worker receives the high payoff we estimate conditional Logit models with fixed effects and robust standard errors clustered at the manager level. Indeed, the manager selects one worker conditional to the attributes of the choice alternatives, i.e. the characteristics of the other triad members. The independent variables include score and opinion ranks (with Rank 2 as the omitted categories) and dummy variables for a tie in the score Rank 1 or in the opinion Rank 1. A variable interacts the first ranks in both opinion and score in case of a tie in the score rank to test whether the opinion rank is used to split the tie. A similar variable is built for a tie in the opinion rank. The independent variables also include the distance in opinion and a dummy variable indicating whether the worker reports exactly the same opinion as the manager. We also interact the distance in opinion and each topic,23 and dummy variables indicating a negative difference in opinion (i.e. a more negative opinion of the manager compared to the worker). We only include the cases in which managers looked at both scores and opinions. Table 4 displays the marginal effects of these variables in the Baseline (Model (1)) and the Ingratiation treatment (Model (2)). We also report regressions excluding ties among the best performers.24
23
Topic variables are not directly included because there is no within-group variation.
24
Table 4. Determinants of which worker receives the high payoff – Conditional Logit models with robust standard errors clustered at the manager level
Dependent variable: Probability of receiving the high payoff
Baseline treatment (1) Ingratiation treatment (2) All obs. Excluding ties
in score rank 1
All obs. Excluding ties in score rank 1 Score rank 1
Tie in score rank 1 Score rank 3
Score rank 1 with a tie in opinion rank 1
Opinion rank 1 Tie in opinion rank 1 Opinion rank 3
Opinion rank 1 with a tie in score rank 1
Reported distance in opinion
Same opinion as the manager Final distance * painting Final distance * migration Final distance * carbon tax
Negative final difference* painting Negative final difference* migration Negative final difference* carbon tax
0.317*** (0.079) -0.232*** (0.085) -0.122# (0.079) 0.045 (0.146) 0.223*** (0.058) -0.190* (0.102) -0.018 (0.068) 0.049 (0.089) -0.006*** (0.002) -0.072 (0.092) -0.004 (0.004) -0.006* (0.003) -0.005* (0.003) -0.045 (0.107) 0.198* (0.106) -0.017 (0.155) 0.339*** (0.079) - -0.171* (0.090) 0.034 (0.216) 0.251*** (0.073) -0.065 (0.158) 0.077 (0.080) - -0.008* (0.004) -0.121 (0.101) -0.003 (0.007) -0.0004 (0.004) -0.005 (0.005) -0.091 (0.128) 0.097 (0.129) -0.031 (0.221) 0.350*** (0.034) -0.222*** (0.077) -0.059 (0.079) 0.024 (0.070) 0.098*** (0.031) -0.165* (0.089) -0.021 (0.039) 0.039 (0.045) -0.001 (0.001) 0.023 (0.040) -0.001 (0.002) -0.002 (0.002) -0.005** (0.002) -0.069 (0.059) -0.019 (0.060) 0.084 (0.054) 0.320*** (0.031) - -0.060 (0.082) 0.146 (0.094) 0.097** (0.044) -0.166 (0.133) -0.034 (0.048) - 0.002 (0.002) 0.030 (0.065) -0.003 (0.003) -0.007* (0.004) -0.005* (0.003) -0.169 (0.105) -0.105 (0.090) 0.118 (0.076) N / Nb of clusters Log Pseudolikelihood Wald Chi2 Prob> Chi2 Pseudo-R2 1221 / 37 -277.404 236.31 0.0000 0.380 552 / 35 -129.868 101.10 0.0000 0.358 2682 / 77 -802.282 151.48 0.0000 0.183 1259 / 76 -331.427 112.07 0.0000 0.281
Note: Marginal effects are displayed with standard errors of the marginal effects in parentheses. *, **, and *** indicate significance at the 10%, 5% and 1% level, respectively. # indicates significance at the 12% level.
Table 4 shows that having the best score in the triad increases the probability of receiving the high payoff by 31.72% in the Baseline, and by 34.95% in the Ingratiation treatment. These probabilities naturally decrease in the case of ties. Being the worst performer in the
triad is sanctioned but only in the Baseline and this is borderline significant. The importance of opinion distance is striking: having the closest distance increases the chance of receiving the high payoff by 22.29% in the Baseline and by 9.77% in the Ingratiation treatment (the effects remain the same when we exclude ties in score rank 1). This indicates both that a lower opinion distance is always rewarded but that managers take less account of this dimension when it may result from ingratiation. This is also supported by the fact that the absolute value of the opinion distance exerts a negative influence only in the Baseline treatment. This negative effect is reinforced when opinions are about policy topics (also observed in the Ingratiation treatment when ties are excluded). A worker’s more liberal opinion on migration policy is rewarded more than a more conservative one. There is no additional effect of having the first opinion (score) rank in case of a tie in the best score (opinion, respectively) rank.
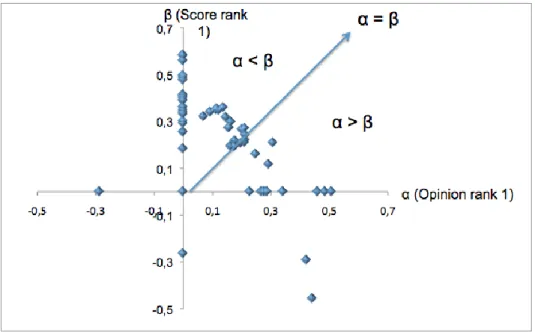
Next, we build a tentative typology of payoff assignment functions. For each manager, we estimate the α and β parameters of our model by means of a conditional Logit model of the decision to assign the high payoff to a specific worker with robust standard errors. We include all the periods in which the manager looked at both scores and opinions.25 To retain the maximum number of observations, we pool the data from the Baseline and Ingratiation treatments.26 The value of α is given by the marginal effect of opinion rank 1 and the value of
β by the marginal effect of score rank 1. In Figure 3, a dot on the vertical (horizontal) axis
means that the manager is influenced by the best rank in score (opinion) while the marginal effect of the best rank in opinion (score) is not different from 0.
25
This excludes only one manager who looked exclusively at the opinions of the workers throughout the game.
26
The minimum number of observations is 33 and the maximum 72. We acknowledge that pooling treatments may bias coefficients, since opinion rank matters less in the Ingratiation treatment.