HAL Id: hal-00296123
https://hal.archives-ouvertes.fr/hal-00296123
Submitted on 24 Jan 2007
HAL is a multi-disciplinary open access
archive for the deposit and dissemination of
sci-entific research documents, whether they are
pub-lished or not. The documents may come from
teaching and research institutions in France or
abroad, or from public or private research centers.
L’archive ouverte pluridisciplinaire HAL, est
destinée au dépôt et à la diffusion de documents
scientifiques de niveau recherche, publiés ou non,
émanant des établissements d’enseignement et de
recherche français ou étrangers, des laboratoires
publics ou privés.
Taiwan: observed evidence and model simulation
C.-Y. Lin, Z. Wang, W.-N. Chen, S.-Y. Chang, C. C. K. Chou, N. Sugimoto,
X. Zhao
To cite this version:
C.-Y. Lin, Z. Wang, W.-N. Chen, S.-Y. Chang, C. C. K. Chou, et al.. Long-range transport of Asian
dust and air pollutants to Taiwan: observed evidence and model simulation. Atmospheric Chemistry
and Physics, European Geosciences Union, 2007, 7 (2), pp.423-434. �hal-00296123�
www.atmos-chem-phys.net/7/423/2007/ © Author(s) 2007. This work is licensed under a Creative Commons License.
Chemistry
and Physics
Long-range transport of Asian dust and air pollutants to Taiwan:
observed evidence and model simulation
C.-Y. Lin1, Z. Wang2, W.-N. Chen1, S.-Y. Chang1, C. C. K. Chou1, N. Sugimoto3, and X. Zhao2
1Research Center for Environmental Changes, Academia Sinica, Taipei 115, Taiwan
2Institute of Atmospheric Physics, Chinese Academy of Sciences, Beijing, China
3National Institute for Environmental Studies, Onogawa, Tsukuba, Japan
Received: 27 September 2006 – Published in Atmos. Chem. Phys. Discuss.: 12 October 2006 Revised: 13 December 2006 – Accepted: 17 January 2007 – Published: 24 January 2007
Abstract. Long-range transport of Asian dust and air pol-lutants are major environmental concerns of Taiwan during the winter monsoon season when northeasterly winds pre-vail following passages of cold fronts. Based on hourly mea-surements of Taiwan Environmental Protection Administra-tion (TEPA) air quality monitoring staAdministra-tions, Lidar and in-situ IC, a significant long-range transport dust and air pol-lutants event on 18 March 2005 has been identified. During
this episode, drastically elevated concentrations of PM10, CO
and SO2 along with the strong northeasterly on 18 March
were observed over background Wanli station, with peaks
of about 170 µgm−3, 1.0 ppm and 14 ppb, respectively. We
have found that air masses of air pollutants and Asian dust are transported separately. Although the mixing takes place on the way to Taiwan, it mixes slightly when they arrived in
Taiwan. The major component of the first PM10 peak were
air pollutants, evidenced by the consistent peaks of SO2−4
and NO−3 measured by in-situ IC, while no significant
de-polarization was measured by Lidar. In contrast, the evident
non-spherical particles and hourly PM10 concentration
con-sistently varied with Ca2+indicating that mineral dust was
the major component of the second peak. Trajectory anal-ysis showed that these two peaks come from quite different sources areas. The air masses of the first peak mainly come from anthropogenic area and transport in the low boundary layer (<1500 m) while the masses of the second peak origi-nate from high altitude (>4000 m) of desert areas. Numerical results showed significant agreement of temporal and verti-cal variation of aerosol concentration with observations. The phenomena of split air parcels between air pollutants and Asian dust transported to Taiwan are strongly associated with the transport paths and stable and dry atmospheric boundary conditions.
Correspondence to: C.-Y. Lin (yao435@rcec.sinica.edu.tw)
1 Introduction
The topic of long-range transport of desert dust during late winter and spring in East Asia is well documented (e.g. Shaw, 1980; Duce et al., 1980; Prospero et al., 1989; Murayama et al., 2001). Many researchers have noted the effect of the high aerosol load caused by frequent Asian dust outbreak, such as reduced visibility, biogeochemical cycles, and the at-mospheric radiation budget (e.g. Uematsu et al., 1983; Li et al., 1996; Chun et al., 2001; Sokolik and Toon,1996; IPCC, 2001; Seinfeld et al., 2004).
Except for the dust storms, anthropogenic emissions over East Asia also received much attention recently. Along with economic growth, East Asia has been a region of rapidly in-creasing emissions of air pollutants in the past decades. In the winter and spring, Taiwan and vicinity is often under the influence of northeasterly winter monsoon winds originating in central Asia. The winter monsoon not only brings cold air, but can also transport air pollutants and dust over a long distance to Taiwan and even to the northwestern Pacific area (Arimoto et al., 1996; Uno et al., 2001; Uematsu et al., 2003; Takemural et al., 2002). This is evident from satellite obser-vations such as AVHRR, MODIS, and SEAWIFS (Husar et al., 2001; Nakajima et al., 2003), that show a pronounced en-hancement of aerosol optical depth during winter and spring over the western North Pacific as a result of Asian conti-nental outflow. Takemura et al. (2002) pointed out that 50% of the total optical thickness around Japan is due to anthro-pogenic aerosols during the strong Asian dust events. Based on the qualitative analysis from background stations of Tai-wan Environmental Protection Administration (TEPA), Lin et al. (2004) presumed the contribution of long-range
trans-port to PM10 abundance in northern Taiwan to range from
50% to 70% during the northeasterly monsoon. Recently, Lin et al. (2005) estimated that the long-range transport of partic-ulate pollutants in northern and eastern Taiwan contributes
to PM10, CO and SO2 concentrations of about 30 µg/m3,
Prospero et al. (2003), in a study of aerosols distribu-tions at Midway Island during 1981–2000, found that pol-lutants such as sulfate and nitrate ions in the aerosols in-creased concurrently with mineral dust in spring and win-ter. Over a long period, the anthropogenic pollutant increases along with mineral dust in the spring. Uno et al. (2001) il-lustrated a long-range transported case by numerical model and showed that mineral dust and anthropogenic tracer are si-multaneously transported to the central Pacific Ocean. How-ever, in our study, the hourly data analysis taken from TEPA air quality monitoring stations showed that most of the dust storm cases usually do not pick up significant air pollutants, or randomly carried pollutants during long-range transport of dust storm episode (Lin et al., 2004). Also, Uematsu et al. (2002) pointed out that Asian dusts are occasionally ca-pable of transporting mineral and anthropogenic particles to the western North Pacific. Matsumoto et al. (2003) found out
anthropogenic fine particles containing abundant nss- SO2−4
appeared first and were then followed by large mineral
par-ticles that had absorbed NO−3 . This phenomena is
differ-ent from that proposed by Prospero et al. (2003) and Uno et al. (2001). The consistent feature found by Prospero et al. (2003) were based on seasonal variations, while the lack of correlation observed at TEPA stations were at time scale of about an hour or less (Lin et al., 2004). Furthermore, Taiwan and Japan lie just off the major emission sources region, so it might take some time to admix the different air masses in-cluding various types of aerosols (Uematsu et al., 2002). It is presumed that whether air pollutants are consistently carried by dust storms or not is strongly associated with the paths of the air mass transport and boundary structures. Therefore, the processes of long-range transport are complex and need further discussion.
K. Matsumoto et al. (2003) showed that the transport pat-terns of the polluted air masses from the east Asian continent to the northern regions of the northwestern Pacific are often different from those to southern regions. Asian dust trans-port mainly between 30∼40 N (Zhao et al., 2003; Satake et al., 2004) while sulfate and carbon is between 25∼45 N (Sa-take et al., 2004). More importantly, this is the first time observed and discussed the separately transport phenomenon between Asian dust and air pollutants over low latitude (less than 25 N) location such as Taiwan. This report completes the picture in the region.
In this paper, we investigate a separately transport case of Asian dust and air pollutants air masses to Taiwan. In this study, measurement of TEPA ground stations, In-situ IC and Lidar are used to analyze the episode. The Nested Air Quality Prediction Model System (NAQPMS) is employed to study the process of the long-range transport of dust and air pollutants to Taiwan.
2 Data source and instruments
Measurements of hourly PM10 and other pollutants were
taken from TEPA air quality monitoring stations. Meteoro-logical parameters, i.e. surface temperature, wind direction
and speed, rainfall, and atmospheric concentrations of PM10,
NOx, CO, and SO2observed at a coastal background station
and a mountain station in northern Taiwan were used in this study. The coastal background station Wanli (Fig. 1) is up-wind from the frontal passage and thus ideal for observing the effect of frontal passages on distribution of dust and air pollutants. Measurements at Yangming mountain station (al-titude 826 m) at a national park in northern Taiwan turn out to be very valuable also because it is relatively clean and pro-vides information on vertical distribution of trace species.
The aerosol composition was analyzed by an in-situ IC system (Chang et al., 2006), which provides concentrations
of water-soluble ions Cl−, NO−2, NO−3, SO2−4 , Na+, NH+4,
K+, and Ca2+. The location of the sampling site (25 N,
121.32 E, Fig. 1) is at the weather observatory of the National Taiwan University (NTU), which is located in the southwest-ern part of the Taipei Basin. The in-situ IC system consisted of gas removal denuders, aerosol collecting device, and ion chromatograph (Model ICS-90, Dionex Corp., Sunnyvale, CA, YSA), and was attached to the bypass flow line of the TEOM monitor to measure the water-soluble inorganic ions
PM2.5during spring of 2005 throughout at 15-min intervals
(PM10 is not available in this study). At the same location,
a Lidar system (hereafter referred to as RCEC/ASNTU Li-dar) was set up from 2004. RCEC/ASNTU Lidar is a dual-wavelength Raman and Depolarization Lidar system (manu-factured by Zenon SA, Greece). The lidar system employs the second and third harmonics of Nd-YAG laser at 532 nm and 355 nm. This system is operated on a 24 h basis to probe the atmosphere at elevations ranging between 0.3 km and 8 km. More details are shown in Table 1. Meanwhile, Lidars performed by National Institute for Environmental Studies (NIES) located in China and Japan were also employed to compare the model results.
3 Model description
The NAQPMS is a fully modularized three-dimensional sys-tem with various options for representing the physical and chemical processes describing regional and urban atmo-sphere pollution (Wang et al., 2000, 2002). It consists of two parts, a regional chemical transport model and the Fifth-Generation PSU/NCAR Mesoscale Modeling System, MM5 (Grell et al., 1995), which is used to generate meteorological fields. The initial and boundary conditions for MM5 are
ob-tained from NCAR/NCEP 2.5◦×2.5◦reanalysis data sets at
6-hour intervals. The model can employ flexible horizontal grid resolution with multiple level nested grids for regional applications and urban scale simulations. Even NAQPMS
4 5 6 7 8 9 10 11 12 13 ur
Fig. 1. Locations of Lidar sites for RCEC/ASNTU and Miyakojima and the TEPA background stations Yangming and Wanli.
Table 1. RCEC/ASNTU lidar characteristics.
Laser Nd:YAG (Big-Sky CFR-400)
Wavelength 532/355 nm
Pulse energy 65/60 mJ
Repetition rate 20 Hz
Transient Recorder 12 bits A/D converter at 20 MHz and 250 MHz photon counting (Licel TR20-40)
Height Resolution 7.5 m
Telescope diameter 40 cm, focal length 160 cm
Channels 532 nm (depolization), 355 nm, and 387 nm (nighttime only)
model can employ multiple level nested grid only one do-main (91×73 grid boxes in the east-west and south-north di-rections) was employed with 81 km resolution in this study. Vertically, the model divides the troposphere from surface to 100 hPa into 20 layers using variable-spaced sigma coordi-nates and the thickness of the surface layer is about 70 m.
A modified dust deflation module is embedded in NAQPMS. The detail methodology for dust emission was described by Wang et al. (2002). In this application, soil dust emission intensity is modified with the vegetation frac-tion percentages and soil categories based on the approach of Wang et al. (2000): Qi =C1×u ∗2×(1 − u∗0/u ∗) × W × R i× X Cjfj, (1)
where u* and u*0are the fraction and threshold friction
ve-locities and C1is an empirical constant set as 2.9×10⁻¹¹(Hu
and Qu, 1997); Cj is the weighting factor of dust loading for
jtype of vegetation that is obtained from the U.S. Geological
Survey (USGS) data with a horizontal resolution of 10 min;
fj is the vegetation fraction percentage of j type of
vegeta-tion in a model grid that is derived from the AVHRR data. The humidity factor W is assumed to be linearly dependent
on the relative humidity (Wang et al., 2000). Ri is the
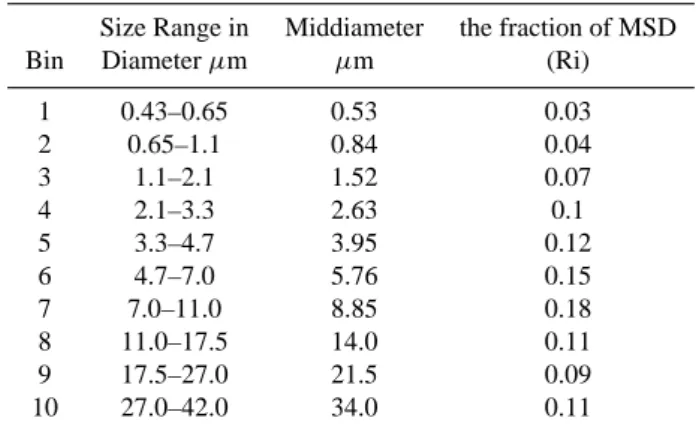
frac-tion of the i-th bin of deflating dust and is obtained from the size distribution of floating dust in source area (Table 2).
The dust particle size is divided into 10 size bins from 0.43 to 42 µm in diameter in terms of the eight stages of aerosol sampler, with three additional size bins above 11 µm for larger particles. Table 2 lists the particle size ranges. The size distribution of dust emission is an important parameter for dust simulation. In this study, the total dust emission flux is apportioned to each size bin based on the observation of the size distribution of soil dust in Chinese source regions within and on the edge of deserts (Zhang et al., 2003; Gao et al., 2002).
The emissions of air pollutants in Asia were obtained from the East Asia inventory by Streets et al. (2003). Meanwhile, in order to evaluate the amount of long-range transport, local emissions are excluded in this study. The model domain in this study is shown in Fig. 6. This model has been success-fully used to study the atmospheric trace gases and particles,
such as SOx, dust, O3, and acid rain over East Asia (Wang et
al., 2000, 2002; Uematsu et al., 2003; Lin et al., 2007).
4 Results
4.1 Observation analysis
Figures 2a and b show the time series of the hourly
(a) 1 2 3 4 5 6 7 8 9 10 11 12 3/17 3/18 3/19 3/16 3/17 3/18 3/19 3/16 (b) 15 16 17 18 19 20 21 22 23 24 14 3/16 3/17 3/18 3/19 3/16 3/17 3/18 3/19 (c) st & r t o △ x △ Y n m n W nl 7 8
Fig. 2. The time series of hourly PM10(red closed circles), CO (dashed line), SO2(solid), NOx(cross), surface temperature (TM, open circle with vertical line), wind speed (closed square, bottom panel) are shown at (a) Wanli station (b) Yangming station ( from 01:00 LST 16 March to 24:00 LST 19 March 2005). Surface wind at Wanli station is represented by wind vector while wind field is not available at
Yangming station. Data missing is between 45th and 60th for PM10at Yangming station. (c) The time series of enhancement hourly ratio of
quality monitoring stations Wanli and Yangming. The data indicates that the cold front arrived around midnight of 17 March 2005 and that the temperature reached the minimum when the wind speed reached the maximum on 18 March 2005. Although wind speed and temperature significantly varied, no rainfall was monitored at Wanli in this case. Be-fore the frontal passage, local pollution dominated on 16 and 17 March and showed clear diurnal variation in air pollu-tants. During local pollution days, daytime anthropogenic emissions at rush hour lead to the concurrent enhancement of
air pollutants such as NOx, CO, and SO2. At night,
concen-trations of all pollutants drop gradually to their minima. Af-ter the cold front passed over northern Taiwan on 18 March, the surface temperature dropped to a minimum, wind speed increased to a maximum and the wind changed to northeast-erly. The strong winds swept away most of the local
pollu-tants while NOxstayed at extremely low values and showed
no diurnal cycle. In this situation, local pollutants become less evident or even disappear all together. In order to further analyze whether the pollution is major contributed by local or long-range transport, we assume the average concentrations during early morning (01:00∼05:00 LST) as the baseline concentration of the day. Thus, the enhancement of the
con-centrations of hourly incremental NOx and CO (i.e. 1NOx
and 1CO) could be examined. Figure 2c shows the enhance-ment ratio of short lived (1NOx) to long lived specie (1CO). The values of the enhancement ratio (i.e. 1NOx/1CO) re-mained low at both Wanli and Yangming stations stably on 18 October and is significantly different from that identified local pollution days. It is important to note that the contribu-tions of local emissions are quite minor on the episode day. Therefore, most of the enhancement of air pollutants can be attributed to the long-range transport.
Figure 2a shows that northeasterly winds with maximum speed of about 12 m/s brought an air mass from the Asian
continent with PM10, CO, and SO2concentrations that
coin-cidently peaked at 07:00 LST (i.e. the 55th hour of Figs. 2a and b) on 18 March 2005 at windward Wanli station at about
170 µg/m3, 1.0 ppm, and 14 ppb, respectively. Under the
strong northeasterly wind (mean wind speed was 7.86 m/s on 18 March), the average concentrations at Wanli station on
18 March for PM10, CO, and SO2were 103 µg/m3, 390 ppb,
and 5.3 ppb, respectively. By using two years’ dust storm episodes, Lin et al. (2005) estimated that the average inflow
concentration of PM10, CO, and SO2 of dust events were
71±34 µg/m3, 359±88 ppb, and 1.1±0.5 ppb, respectively.
It is apparent that more than 3 times of mean SO2
concen-tration arrived via long distance transported over Taiwan for
this case. The concentration of PM10, CO, and SO2 were
well correlated at the north tip of coastal station Wanli before 10:00 LST on 18 March. Although there are a few hours’
PM10 data missing for Yangming station (Fig. 2b), its
vari-ation trend is similar to Wanli. Apparently, the consistent
hourly variations of PM10 and air pollutants in the
morn-ing of 18 March are characteristic of the long-range
trans-Table 2. Particle size ranges and the fraction of mass size
distribu-tions (MSD) of vertical dust flux for three major desert regions of China used in this study.
Size Range in Middiameter the fraction of MSD
Bin Diameter µm µm (Ri)
1 0.43–0.65 0.53 0.03 2 0.65–1.1 0.84 0.04 3 1.1–2.1 1.52 0.07 4 2.1–3.3 2.63 0.1 5 3.3–4.7 3.95 0.12 6 4.7–7.0 5.76 0.15 7 7.0–11.0 8.85 0.18 8 11.0–17.5 14.0 0.11 9 17.5–27.0 21.5 0.09 10 27.0–42.0 34.0 0.11
port event with a significant amount of air pollutants from the Asian continent as propounded by Lin et al. (2004). The
concentration of SO2(CO) dropped drastically from 14 ppb
(1.0 ppm) at 08:00 LST to 3 ppb (0.3 ppm) after 16:00 LST
(i.e. the 64th hour of Figs. 2a and b). However, PM10
con-centration did not consistently drop with air pollutants but peaked at 11:00 LST on 18 March. In other words, there was a second peak at around noon as a result of the variation of
hourly PM10at Wanli station.
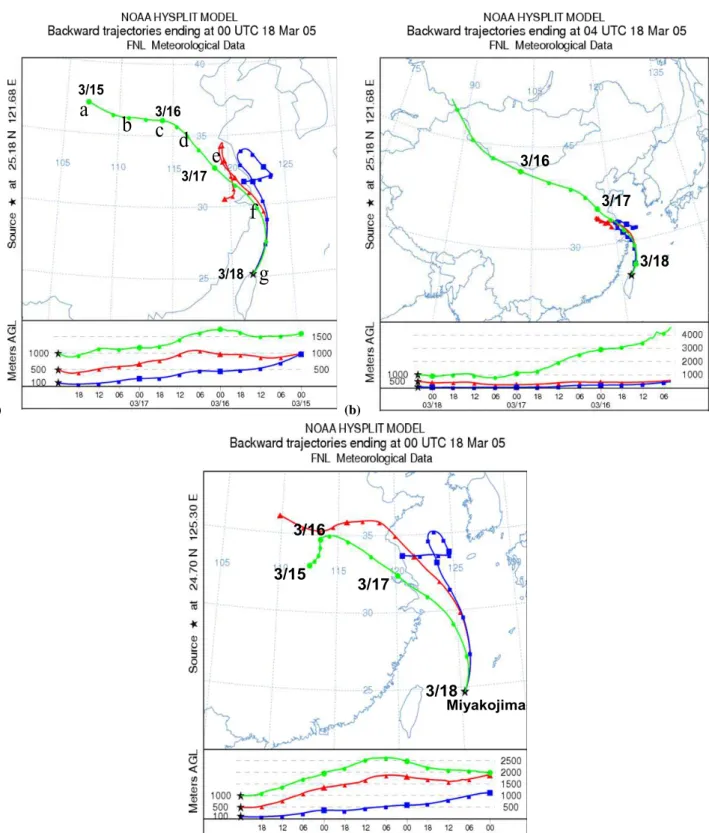
In order to identify the sources and to examine how trans-port paths affect the concentrations of air pollutants in north-ern Taiwan, a three-day backward trajectory analysis was preformed for this case. The analysis was computed using the HYSPLIT (Hybrid Single-Particle Lagrangian-Integrated
Trajectory) model (Draxler and Hess, 1998). The
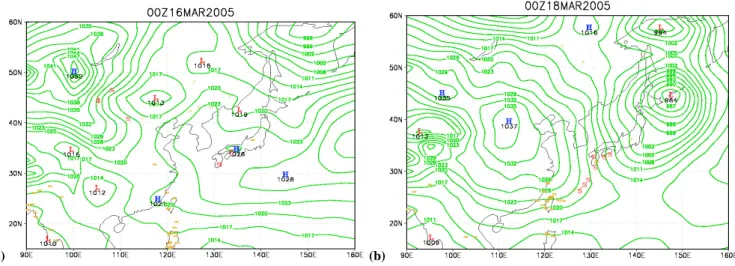
back-ward trajectory analysis was performed for altitudes of 100, 500, and 1000 m at Wanli station in northern Taiwan. Fig-ures 3a and b shows the 72-h backward trajectory starting from 00:00 UTC (08:00 LST) and 04:00 UTC (12:00 LST) on 18 March 2005. From the backward trajectory analysis in northern Taiwan showed that these two peaks in Fig. 2 come from quite different sources areas. For the first peak, the air parcels at 100 m, 500 m and 1000 m mostly moved in the low boundary (<1500 m) over industrial areas of Main-land China before traveling to Taiwan (Fig. 3a). However the second peak, the air parcels at 1000 m with the source of air masses originated from higher altitude (>4000 m) of desert areas (Fig. 3b). The atmospheric condition was con-siderably stable and was evident that the high pressure cen-ter measured nearly 1052 hpa around Mongolia (Fig. 4a) on 16 March 2005. The dry atmospheric conditions and strong pressure gradient led to the occurrence of dust storms over Inner-Mongolia (Fig. 4a). Following the anticyclone outflow, Asian dust was transported to the downstream regions such as Korea, Japan and Taiwan as shown in Fig. 4b. Tracing the air masses trajectory, the sounding of Shanghai (not shown)
(a)
2
3
4
5
6
7
8
9
10
11
12
13
14
15
16
17
18
19
20
21
22
23
24
3/18 3/17 3/16 3/15
a
b
c
d
e
f
g
3/18 3/17 3/16 3/15a
b
c
d
e
f
g
(b) 3/18 3/17 3/16 3/18 3/17 3/16 (c)3/18
3/17
3/16
3/15
Miyakojima3/18
3/17
3/16
3/15
3/18
3/17
3/16
3/15
MiyakojimaFigure 3 (c)
Fig. 3. Result of the HYSPLIT model 3-day backward trajectory analysis started at altitudes of 100, 500 and 1000 m at (a) 00:00 UTC
(08:00 LST) at Wan-Li station in northern Taiwan. (b) 04:00 UTC(12:00 LST) at Wan-Li station in northern Taiwan (c) 00:00 UTC (08:00 LST) at Miyakojima station on 18 March 2005. The top and bottom panels display horizontal and vertical motion. Symbols de-note the location of the air parcel every 6 h. The letters a to g are represented the geographic locations in Fig. 7 in x-axis.
(a)
1
2
(b)
Fig. 4. Surface weather chart and dust storm report (denoted by dollar signs) at 00:00 UTC on (a) 16 March 2005 (b) 18 March 2005.
Symbols of H and L show the location of major high and low pressure systems.
at 00:00 UTC on 17 March 2005 shows that the inversion layer was nearly 800 hpa (about 2 km in altitude), caused by the strong subsidence of the cold high. Following the strong prevailing northeasterly flow, the sounding of Taipei (not shown) also displayed the same inversion height on 18 March 2005, i.e. the subsidence inversion layer at nearly 2 km. Dur-ing three days of transport, the air parcels of 100 and 500 m are mostly at relatively low altitude (below 1000 m). In other words, air masses are mostly transported in the low bound-ary during the transport periods. Therefore, the probability for these air parcels of picking up air pollutants over indus-trial areas should be relatively high.
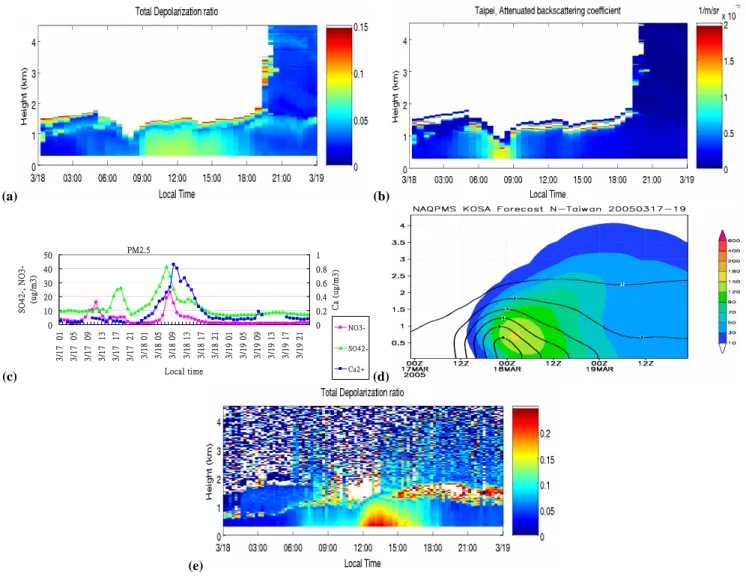
Figure 5a shows an aerosol depolarization episode mon-itored by RCEC/ASNTU Lidar on 18 March 2005, during which the significant aerosol depolarization occurred from 09:00 LST to 18:00 LST. The high depolarization occurred below altitude of 1.5 km, ranged from 5% to 10% and lasted for about 8 h. This indicates that the non-spherical particles mainly exist after 09:00 LST on 18 March. It is important to note that mineral dust presumably reached northern Tai-wan after 09:00 LST. Furthermore, the major composition of
the secondary peak as a result of the hourly variation of PM10
concentration (Fig. 2a) detected at Wanli station around noon was mineral dust. To the contrary, the significant attenu-ated backscattering coefficient (Fig. 5b) for 532 nm between 06:00∼09:00 LST was about 2∼3 times that of the high de-polarization period on 18 March. Vertical distribution of en-hanced attenuated backscattering coefficient was mainly be-low 1500 m. It was earlier deduced from hourly data that air pollutants was the major component of the first peak of
hourly PM10concentration at 08:00 LST at Wanli station.
In order to identify the aerosol compositions presumed
above, the time series of water-soluble ions Ca2+, SO2−4 ,
and NO−3 in PM2.5 (PM10 not available in this study) that
were monitored by In-situ IC in northern Taiwan are shown
in Fig. 5c. The water-soluble ion Ca2+is generally
consid-ered a good indicator of mineral dust while ions SO2−4 and
NO−3 are mainly from anthropogenic sources. As with the
earlier analysis on 17 March, local pollution dominated
be-fore frontal passage, ions SO2−4 and NO−3 peaked during
day-time but no significant Ca2+concentration. After frontal
pas-sage, the concentration of SO2−4 peaked at 07:00 LST which
is about 2–3 h prior to the peak of Ca2+concentration on 18
March. Apparently, air pollutants are the major contributors
of PM10before 08:00 LST, which is consistent with hourly
monitored results for ground station (Wanli) and mountain station (Yangming). Concurrently, results of Lidar and In-situ IC show that the transport of air pollutants is prior to the dust aerosol after the frontal passage on 18 March 2005.
The same sequence observed from composition analysis, Lidar and ground stations suggest that northerly flow not only carried dust, but also anthropogenic pollutants to Tai-wan for this episode. Air pollutants and dust are not always transported together to Taiwan, for example this case. Ap-parently, the transport of dust or air pollutants is strongly associated with the boundary structure and transport paths. Unfortunately, currently available data are based on station only without any indications of transport processes. There-fore numerical study obviously plays an irreplaceable role for understanding the transport mechanism of dust or air pol-lutants to Taiwan.
4.2 Simulation results and discussion
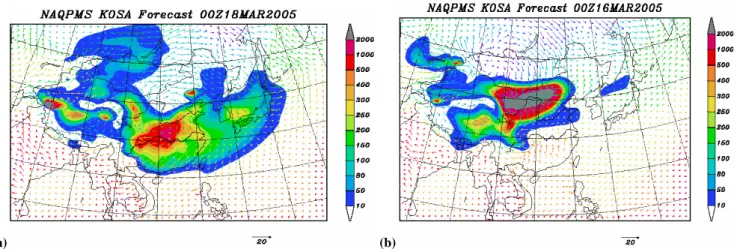
Figure 6a shows the simulated spatial distribution of sur-face dust concentration at 00:00 UTC on 18 March 2005.
Concentrations of dust between 100∼150 µg/m3are located
(a) Figure 5 (a) (b) Figure 5 (b) (c) o l t m u m u m 1 2 (d) o l t m u m u m 6 7 8 9 10 11 12 13 14 15 16 17 18 19 20 21 22 23 24 (e)
Fig. 5. (a) Time series of depolarization ratio of Lidar observed in northern Taiwan on 18 March 2005. (b) Time series of attenuated
backscattering coefficient of Lidar observed in northern Taiwan on 18 March 2005. (c) Time series of hourly soluble ions for Ca2+, SO2−4
and NO−3 in PM2.5 during 17 March∼19 March 2005. (d) Simulated vertical profiles of dust concentration (shaded, unit: µg/m3)and
SO2(contour, unit: ppb) over northern Taiwan from 00:00 UTC 17 March to 24:00 UTC 19 March 2005. (e) Results of time series of
depolarization ratio at Miyakojima Lidar on 18 March 2005.
(Fig. 4b) shows that on 18 March 2005 dust was observed from southern Japan to the islands Amami and Okinawa which are located northeast of Taiwan. Tracing back the trajectory of the dust paths, the spatial distribution of a re-markable simulation of dust concentration (Fig. 6b) are in agreement with the surface weather report (Fig. 4a) in the dust source regions around Inner-Mongolia at 00:00 UTC on 16 March 2005. Simulation results of temporal and spatial distribution of Asian dust demonstrated that the air pocket carrying dust via long-range transport was dominated by a high pressure system following the cold front and formed a band-shaped transport to Taiwan (Chen et al., 2004).
Figure 5d shows the time series of vertical profile of the model predicted over northern Taiwan. The long-range
trans-port of dust concentration is mainly below 1.5 km and peaked
nearly 150∼180 µgm−3at altitude of about 500∼1000 m in
northern Taiwan from 00:00 UTC (08:00 LST) to 04:00 UTC
(12:00 LST) on 18 March. For SO2, it peaked about 6∼8 ppb
along with the continental outflow in the morning and prior to the peak of dust concentration. These simulation results agree well with the finding of the high resolution of In-situ IC, i.e. Asian dust and air pollutants are not coincidently transported by the same air masses. Compared to Lidar re-sults (Figs. 5a and b) over northern Taiwan, simulation dust
and SO2distributions both are consistent with the
character-ization of depolarcharacter-ization ratio and attenuated backscattering coefficient in the vertical distribution. However, compared to the background station’s monitoring results in northern
(a)
Figure 6 (a)
(b)
Fig. 6. Simulated distribution of ground level dust concentration and wind field at (a) 00:00 UTC (08:00 LST) 18 March 2005, (b) 00:00 UTC
(08:00 LST) 16 March 2005.
Taiwan (Fig. 2a), numerical results of air pollutants seem un-derestimate. It is due to Taiwan’s emissions are excluded in this numerical study. In addition, emissions inventory might also one of the important reasons as for the emissions in this study are based on the result of the emission inventory in year 2000 by Street et al. (2003), i.e. it could be underestimated of the emission apply to our case in 2005.
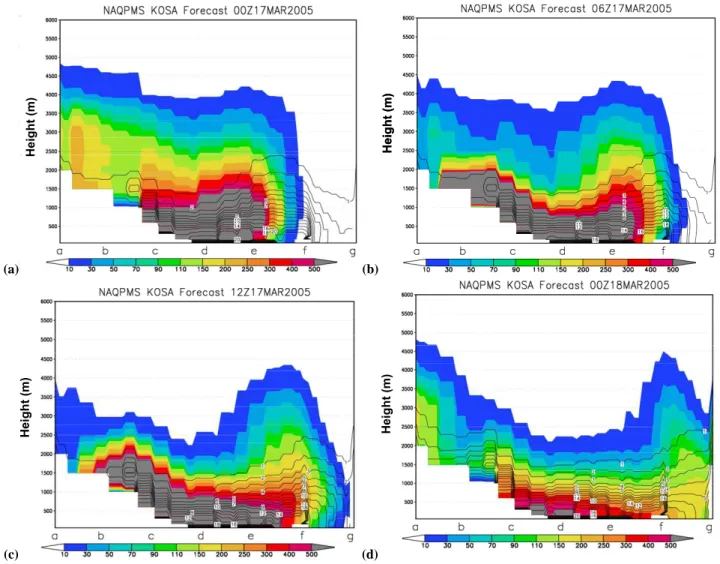
The substantial consistent between observation and model results are also shown at other Lidar site over Miyakojima (125.3 E, 24.7 N) (Fig. 1). Miyakojima is located on an is-land off north-eastern Taiwan and the air masses are from the similar sources area (Figs. 3a and c) on the episode day. Fig-ure 5e shows the time series of Lidar observation at Miyako-jima. The significant depolarization ratio is below 1.5 km on 18 March at Miyakojima has a similar temporal and verti-cal distribution but stronger than the result of RCEC/ASNTU Lidar (Fig. 5a). In theory, Miyakojima is quite close to Tai-wan; it is expected to have the same level depolarization ra-tio. However, local emission is significant in northern Taiwan (RCEC/ASNTU Lidar located in downtown) while Miyako-jima’s local emission can be ignored almost. Therefore, the result of total depolarization ratio in Miyakojima is more evi-dent than that of Taiwan. The time series of simulation long-range transport dust over Miyakojima (not shown) also re-semble to northern Taiwan (Fig. 5d) due to their close loca-tion. It is apparent that our model results provide important messages for this issue. Figures 7a–d show the vertical cross section along the path of the altitude of the 1 km trajectory that is displayed in Fig. 3a. Taiwan is located at position of “g” in Figs. 7a–d. It is important to note that not only the significant concentrations of dust aerosols, but also air pollutants are transported below the altitude of 1.5 km be-fore reaching Taiwan (Figs. 7a–d). As mentioned earlier, the atmospheric condition is stable and dry caused by a strong subsidence of the cold high for this episode. A strong sub-sidence such as this can inhibit the air masses by admixing
those transported in the lower boundary. When the air masses passed over East China sea, the boundary layer subsequently developed (Figs. 7b, c and d). This is probably a result of a boundary layer over the East China Sea upwind of Taiwan, which is known for turbulence mixing because of the cold winter monsoon winds over the relatively warm Kuroshio Current. Revisiting the trajectory path (Fig. 3a) at 00:00 UTC on 17 March, nearly all air parcels are located over coastal industrial areas. The dust aerosols have nearly reached the
mainland coastal area while a high SO2concentration is
be-tween the mainland coast and Taiwan (Fig. 7a). In the other words, air pollutants transported to Taiwan are prior to dust air masses before they admix properly. A significant
concen-tration of SO2is continually emitted over the industrial areas
of China. Air pollutants are pushed by the dust air masses in the stable atmospheric conditions of the boundary layer as they pass by the major pollutant emission areas of China (Figs. 7a and b). Simulation results also demonstrated that the long-range transport of air pollutants to Taiwan is prior to dust for this case.
Since major paths came from the continent and no evi-dent rainfall occurred (not shown) at stations Yangming and Wanli, the effect of the wet deposition might have weak-ened before reaching northern Taiwan on 18 March. Fur-thermore, vertical mixing between dust aerosol and major coastal air pollutant masses are indistinctive due to stable weather conditions and air masses mostly traveled over
conti-nental. Therefore, the high SO2concentration (peaked nearly
14 ppb) via long-range transport can be observed over Tai-wan after wet deposition of the front and the turbulence mix-ing of cold winter monsoon winds over the relatively warm Kuroshio current. The above processes might have been the major reasons that significant concentrations of air pollutants could be transported for long distances prior to dust transport to Taiwan for this episode.
(a) 5 6 7 8 9 10 11 4 H e ig h t (m ) H e ig h t (m ) (b) H e ig h t (m ) H e ig h t (m ) (c) 15 16 17 18 19 20 21 22 14 H e ig h t (m ) H e ig h t (m ) (d) H e ig h t (m ) H e ig h t (m )
Fig. 7. Simulation results of temporal variations of dust (shaded) and SO2concentrations (contour lines) of the vertical profile along the path of the altitude of 1000 m in Fig. 3a at (a) 00:00 UTC 17 March 2005 (b) 06:00 UTC 17 March 2005 (c) 12:00 UTC 17 March 2005 (d) 00:00 UTC 18 March 2005. The letters a to g in x-axis are represented the geographic locations in Fig. 3a.
The observed different composition could be significantly influenced by the transport paths and different vertical mix-ing processes (Zhou et al., 1990; Matsumoto et al., 2003; Arimoto et al., 2004; Lin et al., 2004). This paper provides the fundamental information to understand what controls the composition of Asian outflow to Taiwan, especially in the low latitude region. Except for this case that shows disagree-ment in transport between mineral dust and air pollutants, we noted that dust aerosol (mineral particles) arriving over northern Taiwan together with air pollutants also frequently occurred. Therefore, more cases need to be studies to make precise deductions regarding the vertical mixing and trans-port processes of various types of aerosols to Taiwan.
5 Summary
During late winter and spring, high mineral dust concentra-tions have frequently been observed over East Asia. Along with the long-range transport of Asian mineral dust, anthro-pogenic air pollutants are occasionally carried by the prevail-ing winter monsoon.
Data from a background coastal station and mountain sta-tion by TEPA showed an episode in which a frontal pas-sage was accompanied by a substantial mass of air pollu-tants on 18 March 2005. Drastically elevated
concentra-tions of PM10, CO and SO2 along with the strong
north-easterly were observed over background Wanli station, with
peaks of about 170 µgm−3, 1.0 ppm and 14 ppb,
respec-tively. Monitoring by RCEC/ASNTU Lidar showed that sig-nificant aerosol depolarization ratio occurred below 1.5 km between 09:00 LST and 18:00 LST on 18 March 2005.
Meanwhile, the significant attenuated backscattering coeffi-cient for 532 nm was mainly below 500 m and about 2∼3 h earlier than significant depolarization. Continuous measure-ment of hourly soluble ions demonstrated that air pollutants
were the major contributors of PM10before 08:00 LST while
Ca2+ peaked nearly two hours later. Results from TEPA
ground stations, RCEC/ASNTU Lidar, and continually In-situ IC consistently showed that the transport of air pollutants was prior to the dust aerosol after the frontal passage for this case.
Results from NAQPMS air quality model suggests that the predicted time series of Asian dust distribution agree excellent with the observation of Lidars that were measured in northern Taiwan and Miyakojima. Overall concentration of air pollutants is underestimated by simulation compared to that of ground stations over northern Taiwan. This is prob-ably due to the emissions input in this study are based on the early inventory (Street et al., 2003) in year 2000 while our study case is in 2005. In addition, local emissions were ex-cluded in this study; it might also be one of the reasons for this concern. Under the stable and dry atmospheric condi-tions, air pollutants transported to Taiwan are prior to dust also predicted by the model. As dust and air pollutants are from different sources and are transported in dry and sta-ble weather conditions to Taiwan the phenomena of split air parcels for air pollutants and Asian dust transported to Tai-wan are strongly associated with the transport paths, and sta-ble and dry atmospheric boundary conditions.
Acknowledgements. We would like to thank the
Environmen-tal Protection Administration, Taiwan, ROC for providing the
ground station data. The authors gratefully acknowledge the
NOAA Air Resources Laboratory (ARL) for the provision of the HYSPLIT transport and dispersion model and READY website (http://www.arl.noaa.gov/ready.html) used in this publication. We thank X. Dong (Sino-Japan Friendship Center for Environmental Protection), J. Zhou (Anhui Institute of Optics and Fine Me-chanics), C. H. Lee (Kyung Hee University), S. C. Yoon (Seoul National University), A. Shimizu and I. Matsui (National In-stitute for Environmental Studies) for their contributions in the Lidar observation. This research was supported by NSC grants,
NSC95-2111-M-001-008, and NSC94-2111-M-001-003. This
work also partly supported by Key Project of Chinese Academy of Sciences (KZCX2-YW-205), Natural Science Foundation of China (40305018) and Chinese Ministry of Science and Technology (2005CB422205).
Edited by: M. G. Lawrence
References
Arimoto, R., Zhang, X. Y., Huebert, B. J., et al.: Chemical composi-tion of atmospheric aerosols from Zhenbeitai, China, and Gosan, South Korea, during ACE-Asia, J. Geophys. Res., 109, D19S04, doi:10.1029/2003JD004323, 2004.
Arimoto, R., Duce, R. A., Savoie, D. L., et al.: Relationships among aerosol constituents from Asia and the North Pacific dur-ing PEM-West A., J. Geophys. Res., 101, 2011–2023, 1996. Chang, S.-Y., Fan, G.-C., Chou, C. C.-K., and Chen, W.-N.: Source
identifications of PM10aerosols depending on hourly
measure-ments of soluble components characterization among different events in Taipei Basin during spring season of 2004, Chemo-sphere, 65, 792–801, 2006.
Chen, J. P., Wang, Z., Young, C.-Y., Tsai, F., Tsai, I.-C., Wang, G.-J., Shieh, W.-C., Lin, H. W. Huang, J.-Y., and Lu, M.-J.: Simu-lation of Asian yellow dust incursion over Taiwan for the spring of 2002 and 2003, Terr. Atmos. Oceanic Sci., 15(5), 949–981, 2004.
Chun, Y. S., Boo, K. O., Kim, K., Park, S. U., and Lee, M.: Syn-opsis, Transport, and physical characteristics of Asian dust in Korea, J. Geophys. Res., 106, 18 461–18 469, 2001.
Draxler, R. R. and Hess, G. D.: An overview of the Hysplit-4 mod-eling system for trajectories, dispersion, deposition, Aust. Mete-orol. Mag., 47, 295–308, 1998.
Duce, R. A., Unni, C. K., Ray, B. J., Prospero, J. M., and Merrill, J. T.: Long-range atmospheric transport of soil dust from Asia to the tropical North Pacific: Temporal variability, Science, 209, 1522–1524, 1980.
Gao, W., Wei, W., and Liu, M.: Analysis on the regional character-istics of sand-dust aerosol over Tarim Basin, Arid Land Geogra-phy, 25(2), 165–169, 2002.
Grell, G. A., Dudhia, J., and Stauffer, D. R.: A description of the Fifth-Generation Penn State/NCAR Mesoscale Model (MM5), Tech. Note NCAR/TN-398+STR, 122 pp, Natl. Cent. for Atmos. Res., Boulder, Colo., 1995.
Huebert, B. J., Bates, T., Russell, P. B., et al.: An overview of ACE-Asia: Strategies for quantifying the relationships between Asian aerosols and their climatic impacts, ACE-Asia special issue A, J. Geophys. Res., 108(D23), 8633, doi:10.1029/2003JD003550, 2003.
Husar R. B., Tratt, D. M., Schichtel, B. A., et al.: The Asian dust events of April 1998, J. Geophys. Res., 106(D16), 18 317– 18 330, 2001.
Intergovernmental Panel on Climate Change: Climate Change 2001 – Impacts Adaptation and Vulnerability, Cambridge Univ. Press, New York, 2001.
Jaffe, D. A., Mahura, A., Kelley, J., Atkins, J., Novelli, P. C., and Merrill, J.: Impact of Asian emissions on the remote North Pacific atmostphere: Interpretation of CO data from Shemya, Guam, Midway, and Mauna Loa, J. Geophys. Res., 102, 28 627– 28 636,1997.
Li, X., Maring, H., Savoie, D., Voss, K., and Prospero, J. M.: Dom-inance of mineral dust in aerosol light-scattering in the North Atlantic trade wind, Nature, 380, 416–419, 1996.
Lin, C.-Y., Liu, S. C., Chou, C. C.-K., Liu, T. H., Lee, C.-T., Yuan, C.-S., Shiu, C.-J., and Young, C.-Y.: Long-Range Transport of Asian Dust and Air Pollutants to Taiwan , Terr. Atmos. Oceanic Sci., 15(5), 759–784, 2004.
Lin, C.-Y., Liu, S. C., Chou, C. C.-K., Huang, S.-J., Liu, C.-M., Kuo, C.-H., and Young, C.-Y.: Long-range transport of aerosols and their impact on the air quality of Taiwan, Atmos. Environ., 39, 6066–6067, 2005.
Lin, C.-Y., Wang, Z., Chou, C. C.-K., Chang, C.-C., and
episode over southwestern Taiwan, Atmos. Environ., in press, doi:10.1016/j.atmosenv.2006.12.050, 2007.
Matsumoto, K., Uyama, Y., Hayano, T., Tanimoto, H., Uno, I., and Uematsu, M.: Chemical properties and outflow pat-terns of anthropogenic and dust paticles on Rishiri Island during the Asian Pacific Regional Aerosol Characterization Experiment (ACE-Asia), J. Geophys. Res., 108(D23), 8666, doi:10.1029/2003JD003426, 2003.
Murayama, T., Sugimoto, N., Uno, I., et al.: Ground-based network observation of Asian dust eveint of April 1998 in east Asia, J. Geophys. Res., 106, 18 345–18 359, 2001.
Nakajima, T., Sekiguchi, M., Takemura, T., et al.: Significance of direct and indirect radiative forcings of aerosols in the East China Sea region, J. Geophys. Res., 108(D23), 8658, doi:10.1029/2002JD003261, 2003.
Prospero, J. M., Savoie, D. L., and Arimoto, R. A.: Long-term record of nss-sulfate and nitrate in aerosols on Midway Island, 1981–2000: Evidence of increased (now decreasing?) anthro-pogenic emissions from Asia, J. Geophys. Res., 108(D1), 4019, doi:10.1029/2001JD001524, 2003.
Prospero, J. M. and Savoie, D. L.: Effect of continental sources of nitrate concentrations over the Pacific Ocean, Nature, 339, 687– 689, 1989.
Satake, S., Uno, I., Takemura, T., et al.: Characteristics of Asian aerosol transport simulated with a regional-scale chemical trans-port model during the ACE-Asia observation, J. Geophys. Res., 109, D19S22, doi:10.1029/2003JD003997.
Seinfeld, J. H., Carmichael, G. R., Arimoto, R., et al.: ACE-ASIA regional climate and Atmospheric chemical effects of Asian dust and pollution, Bull. Amer. Meteorol. Soc., 85, 367–380, 2004. Shaw, G. E.: Transport of Asian desert aerosol to Hawaiian Islands,
J. Appl. Meteorol., 19, 1254–1259, 1980.
Sokolik, I. N. and Toon, O. B.: Direct radiative forcing by anthro-pogenic airborne mineral aerosols, Nature, 381, 681–683, 1996. Streets, D. G., Bond, T. C., Carmichael, G. R., Fernandes, S. D., Fu, Q., He, D., Klimont, Z., Nelson, S. M., Tsai, N. Y., Wang, M. Q., Woo, J. H., and Yarber, K. F.: An inventory of gaseous and primary aerosol emissions in Asia in the year 2000, J. Geophys. Res., 108(D21), 8809, doi:10.1029/2002JD003093, 2003.
Takemural, T., Uno, I., Nakajima, T., Higurashi, A., and Sano, I.: Modeling study of long-range transport of Asian dust and anthro-pogenic aerosols from East Asia, Geophys, Res. Lett., 29, 2158, doi:10.1029/2002GL016251, 2002.
Uematsu, M., Duce, R. A., Prospero, J. M., Chen, L., Merrill, J. T., and McDonald, R. L.: Transport of mineral aerosol from Asia over the North Pacific Ocean, J. Geophys. Res., 88, 5343–5352, 1983.
Uematsu, M., Yoshikawa, A., Muraki, H., Arao, K., and Uno, I.: Transport of mineral and anthropogenic aerosols during a Kosa event over East Asia, J. Geophys. Res., 107(D7), 4059, doi:10.1029/2001JD000333, 2002.
Uno, I., Amano, H., Emori, S., Kinoshita, K., Matsui, I., and Sugi-moto, N.: Trans-Pacific yellow sand transport observed in April 1998: A numerical simulation, J. Geophys. Res., 106, 18 331– 18 334, 2001.
Uno, I., Carmichael, G. R., Street, D. G., et al.: Regional chemi-cal weather forecasting system CFORS: Model description and analysis of surface observations at Japanese island stations dur-ing the ACE-Asia experiment, J. Geophys. Res., 108(D23), 8668, doi:10.1029/2002JD002845, 2003.
Wang, Z., Ueda, H., and Huang, M.: A deflation module for use in modeling long-range transport of yellow sand over East Asia, J. Geophys. Res., 105, 26 947–26 960, 2000.
Wang, Z., Akimoto, H., and Uno, I.: Neutralization of soil aerosol and its impact on the distribution of acid rain over East Asia: Ob-servation and model results, J. Geophys. Res., 107(D19), 4389, doi:10.1029/2001JD001040, 2002.
Zhang, X. Y., Gong, S. L., Shen, Z. X., et al.: Characterization of soil dust aerosol in China and its transport and distribution dur-ing 2001 ACE-Asia:1. Network observations, J. Geophys. Res., 108(D9), 4261, doi:10.1029/2002JD002632, 2003.
Zhao, T. L., Gong, S. L., Zhang, X. Y., and McKendry, I.
G.: Modeled size-segregated wet and dry deposition
bud-gets of soil dust aerosol during ACE-Asia 2001: Implications for trans-Pacific transport, J. Geophys. Res., 108(D23), 8665, doi:10.1029/2002JD003363,2003.
Zhou, M.-Y., Yang, S.-J., Parungo, F. P., and Harris, J. M.: Chem-istry of marine aerosols over the western Pacific Ocean, J. Geo-phys. Res., 95, 1779–1787, 1990.