HAL Id: cea-02509250
https://hal-cea.archives-ouvertes.fr/cea-02509250
Submitted on 16 Mar 2020
HAL is a multi-disciplinary open access
archive for the deposit and dissemination of
sci-entific research documents, whether they are
pub-lished or not. The documents may come from
teaching and research institutions in France or
abroad, or from public or private research centers.
L’archive ouverte pluridisciplinaire HAL, est
destinée au dépôt et à la diffusion de documents
scientifiques de niveau recherche, publiés ou non,
émanant des établissements d’enseignement et de
recherche français ou étrangers, des laboratoires
publics ou privés.
Increasing of MERARG Experimental Performances
On-line Fission Gas Release Measurement by Mass
Spectrometry
Yves Pontillon, H. Capdevila, S. Clement, E. Guigues, A. Janulyte, Y. Zerega,
J. Andre
To cite this version:
Yves Pontillon, H. Capdevila, S. Clement, E. Guigues, A. Janulyte, et al.. Increasing of MERARG
Experimental Performances On-line Fission Gas Release Measurement by Mass Spectrometry.
AN-IMMA 2015 - 4th International Conference on Advancements in Nuclear Instrumentation
Measure-ment Methods and their Applications, Apr 2015, Lisbone, Portugal. �10.1109/TNS.2016.2554610�.
�cea-02509250�
Increasing of MERARG Experimental Performances:
On-line Fission Gas Release Measurement by Mass
Spectrometry.
Y. Pontillon, H. Capdevila, S. Clement, E. Guigues, A. Janulyte, Y. Zerega and J. Andre
Abstract – The MERARG device - implemented at the LECA-STAR Hot Laboratory, at the CEA Cadarache - allows characterizing nuclear fuels with respect to the behaviour of fission gases during thermal transients representative of normal or off normal operating nuclear power plant conditions. The fuel is heated in order to extract a part or the total gas inventory it contains. Fission Gas Release (FGR) is actually recorded by mean of both on-line gamma spectrometry station and micro gas chromatography. These two devices monitor the quantity and kinetics of fission gas release rate. They only address 85Kr radioactive isotope and the elemental quantification of Kr, Xe and He (with a relatively low detection limit in the latter case, typically 5-10 ppm). In order to better estimate the basic mechanisms that promote fission gas release from irradiated nuclear fuels, the CEA fuel study department decided to improve its experimental facility by modifying MERARG to extend the studies of gamma emitter fission gases to all gases (including Helium) with a complete isotopic distribution capability. To match these specifications, a Residual Gas Analyser (RGA) has been chosen as mass spectrometer. This paper presents a review of the main aspects of the qualification/calibration phase of the RGA type analyser. In particular, results recorded over three mass ranges 1-10 u, 80-90 u and 120-140 u in the two classical modes of MERARG, i.e. on-line and off-line measurements are discussed. Results obtained from a standard gas bottle show that the quantitative analysis at a few ppm levels can be achieved for all isotopes of Kr and Xe, as well as masses 2 and 4 u.
I. INTRODUCTION
perators and fuel vendors have considered a variety of means to enhance, from a general point of view, plant performance. This modification has taken place in the last decades and is likely to continue in the long term. Within the field of nuclear fuel, this approach is supported by a few basis orientations, such as for instance burn-up extension of standard fuels, new types of fuel, more efficient fuel management schemes, new cladding materials and new fuel assembly designs.
As a consequence of this evolution, there is a permanent need to reassess the reactor safety studies, in order to ensure that these progresses take place without detriment to safety. Within this framework, Fission Gas Release (FGR) and swelling caused by intra and intergranular bubbles must be adequately considered in the fuel licensing process, either in normal operation or as the radioactive “source term” in case of
Y. Pontillon, H. Capdevila, S. Clement are with CEA, DEN, DEC, SA3C, LAMIR, F-13108 Saint Paul lez Durance, France (telephone: + 33 4 42 25 72 26, e-mail: yves.pontillon@cea.fr).
E. Guigues, A. Janulyte, Y. Zerega and J. Andre are with Aix-Marseille Université, LISA EA 4672, 13397 MARSEILLE cedex 20, France.
a nuclear incident and/or accident occurring in Nuclear Power Plant (NPP).
Under normal operating conditions, even though numbers of questions are not completely solved up to now, it is considered that the most important mechanism which promotes FGR from high burn up fuels [1,2,3] is the release by atom diffusion to grain boundaries and from there to the free volume of the rod by venting through tunnels. In fact, mechanisms which are involved at low burn-ups (i.e. recoil, knock-out, …) contribute less than 1% to the global released fraction [4,5]. Besides, contribution from the High Burn-up Structure (HBS) of the pellet begins to be significant for burn-ups higher than 50 GWd/t, but diffusion remains the mechanism having potential too much larger release fractions than the others [6,7].
Up to now, predicting correctly the FGR from high burn up
UO2 fuels at off-normal conditions, such as for instance power
transient, reactivity initiated accident (RIA) and loss-of-coolant accident (LOCA), remains a crucial challenge. As a consequence, different R&D programs have been performed in France, through joint actions between the Commissariat à l’Energie Atomique (CEA) and its partners. Within this framework, a specific emphasis has been put on mechanisms which promote the FGR under these conditions. One of the most useful ways to do that is to perform appropriated annealing treatments in order to measure both the absolute level and the time dependence of the released gases, together with the corresponding fuel micro-structural changes during representative thermal transients, since experimental knowledge of fission gas release alone is not efficient enough [8]. This approach requires not only to extend the database for transient analyses to a broader range of test conditions and materials, but also to quantify properly the uncertainties relative to the database to make its use more relevant.
According to this general objective, MERARG device - implemented at the LECA-STAR Hot Laboratory, at the CEA CADARACHE – has been built. It allows characterizing the nuclear fuel with respect to the behaviour of fission gases during thermal transients. In this device, the fuel is heated in order to extract a part or the total gas inventory it contains. FGR is actually recorded by mean of both on-line gamma spectrometry station and micro gas chromatography. These two devices monitor the quantity and kinetics of fission gas
release rate. They only address 85Kr radioactive isotope and
the elemental quantification of Kr, Xe and He (with a relatively low detection limit in the latter case, typically 5-10 ppm). In addition, fission gases are collected in capacities for, in some cases, off-line analysis by GC-MS (in other laboratories) which allows dosing stable and active gases.
O
However, in order to better estimate the basic mechanisms that promote gas (i.e. He, Kr and Xe) release from irradiated nuclear fuels, the CEA fuel study department at Cadarache decided to improve its experimental facility by modifying the existing annealing device MERARG to extend the studies of gamma emitter fission gases to all gases (including Helium) with a complete isotopic distribution capability.
In this context, a joint research program between Aix Marseille Université and CEA Cadarache was launched in order to develop a mass spectrometer apparatus with a sampling device adapted to MERARG sweeping line for monitoring gaseous fission products at very low threshold levels and fast response times.
To match these specifications, a Residual Gas Analyser (RGA) has been chosen as mass spectrometer. It is conventionally used as a smart gauge in a large vacuum chamber, when it operates as an analyser of residual vacuum of this chamber. For our application, used as a Process Gas Monitor, it is placed in a small-volume vacuum chamber. The mass spectrometer consists of an open electron-impact ion source, a mass filter and two ion detectors (a Faraday Cage and Electron Multiplier).
In addition to ensure the fastest transportation times (about 1 s) of neutral particles toward the ion source, the sampling device must not introduce significant mass-segregation. The sampling device operates according to: (a) on-line measurement mode for release kinetic and (b) off-line mode to reproduce the delayed measurement of capacities containing the total quantity of released gases.
After having described briefly the MERARG facility together with the chosen mass spectrometer (and its principal characteristics), the paper presents a concise review of the main aspects of the qualification/calibration phase of the RGA type analyser. We will also discuss results recorded over three mass ranges 1-10 u, 80-90 u and 120-140 u in the two classical mode of MERARG, i.e. on-line and off-line measurements. In addition, we will detail the corresponding detection limitation of this RGA (less than 1 ppm).
II. EXPERIMENTAL SET UP
This section is devoted to, on the one hand, a brief description of the MERARG facility and, on the other hand, to details regarding the mass spectrometer characteristics.
A. MERARG Facility
This facility has been used for several years at CEA (Grenoble and after CADARACHE), in hot cells Laboratory (respectively LAMA and LECA-STAR), in order to fulfil several analytical programmes on FGR. It has been presented elsewhere [9,10,11]. So, the following presentation will be relatively brief.
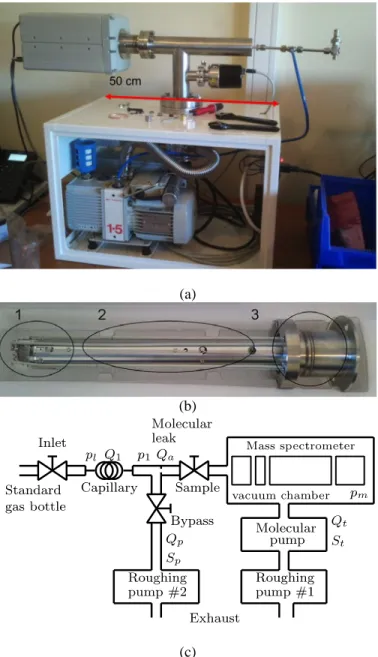
The device (Fig. 1) has been adapted from Canadian
experiment [12] using the CEA expertise in radioactive gas measurement. Its main components are: the induction furnaces located in a shielded hot cell, the gamma spectrometry device, and the gloves box where gas coming out of the furnace is trapped. Recently, a new device has been added in order to
monitor Fission Product (other than gas) Release as a function of temperature [13].
The furnace is a “circulation” one. The furnace chamber is a quartz tube; the sample is put into a metallic crucible, which is coupled to the high frequency (100 kHz) coil placed around the quartz tube, and heated up by induction. During the whole annealing, the specimen is swept by a regulated gas flow (argon or air). Fission gas is carried away with the sweeping gas; it flows through aerosol filters before passing in the delay chamber situated in front of the gamma spectrometer. The gas flow ends in the gloves box where fission gas is trapped.
Furnace temperature, gas flow and pressure are continuously monitored. The sample temperature is evaluated by two ways: (i) a thermocouple placed at the bottom part of the crucible measures its temperature, (ii) and in some cases by a pyrometer (for temperature above 1000°C by direct sighting into the sample chamber).
The delay chamber and the detector are located in a shielded chamber. The detector is a germanium P-type crystal with 60 % efficiency. These components are designed to
detect a FGR minimum cumulated value of 1 % for 85Kr and
0.1 % for 133Xe, after a test duration of 1 hour carried out on a
200 mg fuel sample at a burn-up of 50 GWd.thm-1. Calibration
of this system is ensured thanks to 85Kr standard gas sources.
The cumulative gas release can also be obtained at the end of an experiment by analyzing the gas which has been trapped into the gloves box. This measurement is achieved by gamma spectrometry. The gamma spectrometry of the capacities provides a second measurement of the total radioactive FGR.
Calibration of this system is ensured thanks to 85Kr standard
gas sources.
Fig. 1. MERARG device
B. The chosen mass spectrometer
Among the mass-analysis principles, the quadrupole mass filter is the most suitable for on-line implementation [14]. It is a mature roughly 40 years old technique and is today widely used in a broad range of vacuum based instrumentation. Applications include sensitive leak detection, residual gas analysis, thermal desorption mass spectroscopy, molecular beam analysis, and detection in liquid and gas chromatography. The number of applications for quadrupole mass filter spectrometers continues to increase. These spectrometers are used in portable instruments for in-situ analysis of hazardous chemicals in the environment, in mobile battlefield laboratories or in specific machines for the separation of atomic isotopes.
Typically, flange-mounted quadrupole mass spectrometers are used as Residual Gas Analyser (RGA). They can also be
used as the core of a mass spectrometer system placed in a small-volume vacuum chamber for gas monitoring from a process (Process Gas Monitor) [15].
The quadrupole mass filter possesses many technological advantages, such as compactness, robustness, and reduced cost of fabrication. Mass separation is limited to one u, however sensitivity of detection is very high: it can measure partial
pressures down to 10-14 torr when it employs an electron
multiplier as ion detector instead of Faraday cup. Furthermore, an arrangement of triple quadrupoles composed of a pre-filter operated in RF-mode, a mass selective filter and a post filter increases the sensitivity of the mass spectrometer.
The RGA performances can be enhanced. As an example, Extrel company proposes an RGA designed specifically for low mass gas analysis applications which can easily resolve Helium and Deuterium which are separated by 0.028 u [16]. The application of a static axial magnetic field along the mass filter increases the resolution of a quadrupole mass filter with hyperbolic-shaped electrodes [17]. Quadrupole mass filter with hyperbolic electrodes operated in zone 3 of the Mathieu stability diagram could achieve the resolution of the low mass
isotopes such as HT-D2, separated by 0.004125 u [18,19]. The
implementation of RGA concerns a very wide application range. On Tore Supra, a shielded residual gas analyser system can function during plasma operation and is set up to monitor the composition of the neutral gas. For instance, it measures
the evolution of particle balance H2/D2 isotopic ratio in the
exhaust gas [20].
Our choice concerns the flange-mounted Residual Gas
Analyser of Thermo Scientific (Fig. 2a). The device comprises
an open electron impact ion source, a triple quadrupole mass
analyser and a Chaneltron electron-multiplier (Fig. 2b). The
sampling device, described in Fig. 2c, is composed of an
adapted pressure converter for gas sampling at 1-2 bar, a vacuum chamber and two-stage pumping device. Scanning for masses ranging between 1-5, 70-90 and 120-140 u can be achieved during 1 minute with a resolution equal to 1 u.
The sampling device is a critical stage in developing a successful mass spectrometry based analytical method. Any error in gas sampling directly affects the quantitative precision and accuracy of the measurement. Therefore, the inlet device must both insure pressure adaption between line and mass spectrometer vacuum chamber and minimize sample discrimination while also meeting other objectives such as analysis speed, and ease of operation for on-line application.
It is used two-flow divided stages with an intermediate pressure flow-by region in order to obtain both fast response
and compositional accuracy (Fig. 2c). Each flow system has a
separated pumping device. Two pressure drop devices are used, a capillary and a molecular leak, to enter the gas in the
vacuum chamber at 10-7 torr, typically. A part of the gas flow
in MERARG sweeping line (at 1.2 bars) is drawn through the capillary into the intermediate chamber of small volume by means of rotary pump #2. The molecular leak located the
closest as possible to Qp flow allow us to ensure a fast
response to gas inlet without segregation. The main flow is Qp
while Qa is 100 times lower.
This part of the system is carefully designed to make sure that the sample gas is in laminar or viscous flow up to the molecular leak, while the sample flow is fast enough to assure rapid response. In the intermediate chamber the pressure is reduced to about 1 mbar. The sample is admitted into the mass spectrometer via the molecular leak, which is usually a thin laser drilled aperture. The gas flow at the leak is in the molecular flow regime.
(a)
(b)
(c)
Fig. 2 Residual Gas Analyser of Thermo Scientific, (a) Photography of the device, (b) view of Impact ion source (1), triple quadrupole (2), chaneltron (3), (c) Adaptation for gas sampling to the line of mass spectrometer
The modelling of gas sampling inlet device and its performance has been already presented. This approach focussed on the balance equations at the steady state for gas throughput to estimate pressures and flows for dimensioning the sampling device and the pumping system [21].
III. QUALIFICATION PHASE
The resolution, sensitivity and isotopic ratio will be presented in this experimental qualification phase for both static and dynamic gas inlets, which simulate respectively off-line and on-off-line MERARG measurements. Only results with Xe gas are presented, but similar results have been found for
other gases (mass ranges of 1-10 u for H2 and He and 80-90 u
for Kr).
A. Experimental procedure
The performance characterisation is performed with a
standard bottle containing H2, He, N2, Kr and Xe at 100 ppm
in Ar carrier gas provided by Air Products. The output pressure is calibrated at 1.2 bars, the same pressure than MERARG sweeping line.
In the source, positive ions are created by impact of electrons produced by heating a metal filament. The current of the filament is set at 1.7 A and the measured current of electron in the source is 1.2 µA. The potential difference between the filament (biased at -67 V) and the ion cage (3V) fixes the ionization energy (or the electron kinetic energy) at 70 eV. The electrons are maintained inside the cylindrical cage of the repeller biased at -100 V in order to increase the ionization rate. Only the ions created inside the ion cage at 3 eV will be directed towards the analyser trough a set of lenses. The second lens (denoted as “focus plate”) is supplied by the same potential value than the repeller in order to repulse the electrons, while the ions are extracted from the ion cage then focussed towards the filter.
During analysis, the ratio between the amplitudes of DC and RF voltages (U/V) is equal to 8.45. These two voltages cannot be set separately. The confinement frequency is fixed at 2000 kHz and never-changing.
B. Mass calibration
Careful and complete interpretation of the spectrum should reveal the identity, as well as the concentrations, of the various components that have produced the spectrum. The first step is to accurately identify the mass-to-charge ratio of all the peaks in the mass spectrum. In our case, mass calibration is
performed from isotopic Xe. In Fig. 3 the comparison of
theoretical and first experimental spectra reveals a mass-shift of about 0.5 u cancelled by mass calibration.
(a) (b)
Fig. 3. Isotopic Xe spectrum: reference NIST spectrum (a) and spectrum recorded before calibration (b).
C. Quantitative calibration
The instrument possesses two types of detectors: a Faraday cup and a secondary electron multiplier (SEM), used for detection of smaller quantities. The sensitivity is calculated from
A A
PP I
S= (A/torr), where
I
A(A) is the detector signalmeasured for Ar and
PP
A(torr) is typically Ar partial pressure.In that case,
PP
A is the total pressure of the vacuum chambermeasured by the gauge.
In order to separate the gain of the electron multiplier from the intrinsic sensitivity of the RGA head, the sensitivity factors of the RGA are defined for Faraday cup detection. The calibration is firstly performed for Faraday cup then for electron multiplier by adjusting its gain to an optimal value.
The partial pressure of a compound is deduced from the knowledge of the sensitivity of the used detector and the corresponding peak amplitude measured on the spectrum.
D. Results: Static mode
The valves are opened until a mass spectrometer chamber
pressure of about 5 10-6 torr is reached. Then inlet and bypass
valves are closed. Hence the gas volume between valves passes through the molecular leak. This process is slow due to
the low conductance of the leak of about 4-6 10-3 cm3/s for He.
This mode is suitable to analyse the total quantities released during annealing and retained in capacities.
As soon as the inlet and bypass valves are closed, the ion signal of each isotope is recorded every second over a period of some hours. Ion signal diminishes with gas quantity, while
the isotopic ratios are quasi-constant (Fig. 4). As a
consequence, segregation induced by emptying a finite volume through the molecular leak is not significant over the mass range of Xe isotopes.
Fig. 4. Xe isotope ion signals versus time.
In addition, 10 spectra are recorded with sample valve
closed with 10-7 torr in the vacuum chamber for the Xe mass
range. The mean value of these spectra is subtracted to each spectrum recorded at different instants with gas inlet on. For
spectra recorded at initial time (one example is given in Fig. 5),
[22] is less than 1.5 % for major isotopes and less than 10 % for isotope 128, the concentration of which is 2 ppm.
Fig. 5. Xe spectrum and isotopic ratio in static mode.
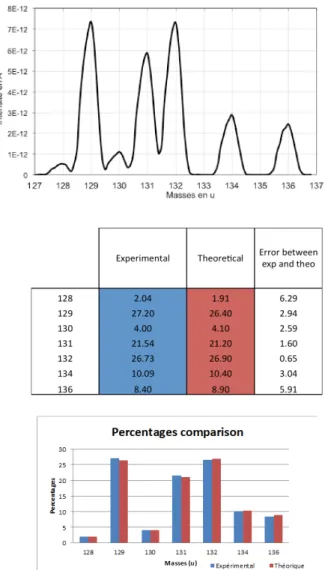
E. Results: Dynamic mode
For the dynamic mode the three valves are opened allowing a steady flow entering the vacuum chamber through the molecular leak. The opening of the bypass valve is adjusted to
have 2 10-6 torr in the vacuum chamber. 10 spectra are
recorded and the mean background spectrum is subtracted (as described in static mode).
The relative error between experimental and theoretical results ranges from 0.6 to 3 % for the major isotopes and is
less than 7 % for isotope 128 (Fig. 6).
Fig. 6. Xe spectrum and isotopic ratio in dynamic mode
Besides, in order to evaluate the measurement repeatability, 60 spectra are recorded with the same procedure. For each spectrum, the isotopic ratio is calculated as well as the corresponding average (over the 60 spectra) and standard deviation values. The corresponding results, displayed in Table 1, show the very good performance of the apparatus with standard deviation values around 3%, 6%, 11% and 21% respectively for concentration of 20-25 ppm, 9-10 ppm, 3 ppm and 2 ppm.
TABLE 1.REPEATABILITY CHARACTERISTICS FOR XE ISOTOPIC RATIO,S.D.
STANDS FOR STANDARD DEVIATION
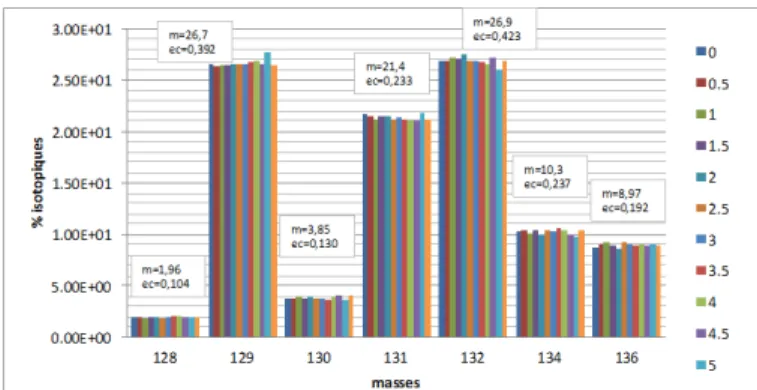
Finally, the last point which has been checked during this qualification phase corresponds to the signal intensity evolution as a function of time. In fact, a typical MERARG experiment is conducted over a period of 5-6 hours. As a
128 Xe 129 Xe 130 Xe 131 Xe 132 Xe 134 Xe 136 Xe Intensity(average) (x10-12) Concentration (ppm) 1,95 26,6 3,94 21,4 26,9 10,4 8,88 S.D. (x10-12 ) S.D. (%) 21.1 3.5 11.4 3.7 3.1 6.1 7.6 2,36 0,11 0,25 0,12 0,21 0,22 0,17 0,18 0,52 7,05 1,05 5,67 7,12 2,77
consequence, it is crucial that there is no intensity evolution,
for a same measurement, during this period of time. Fig. 7,
which shows Xe isotopic ratio evolution over a period of 5 hours, highlights the very good signal’s stability.
Fig. 7. Xe Isotopic ratio evolution as a function of time during 5 hours. (AV and SD stand for average et standard deviation respectively)
IV. CONCLUSION
The RGA including a quadrupole mass filter is certainly the mass spectrometer the most widely used in the world since thirty years in many areas, for analysing residual gases and more particularly for the isotopic or elemental analysis.
Technological advantages include low construction costs, the simplicity, the very compact size and robustness favourable for on-line process implantation in Hot Laboratory. The RGA has been adapted to sample gas at high pressure without mass segregation. The dynamic mode (corresponding to on-line sampling) and the static mode (corresponding to capacity analysis of the released total quantity) have been qualified. The sensitivity threshold is as low as 1 ppm. The error between experimental and theoretical isotopic ratios are lower than few % for the 3 major isotopes and less than 10 %
for isotope 128Xe at 1.9 ppm.
ACKNOWLEDGMENT
The authors would like to thank AREVA and EDF for the financial support of this conjoint research project between CEA and Aix-Marseille Université.
REFERENCES
[1] P. Lösönen, “Modelling intragranular fission gas release in irradiation of sintered LWR UO2 fuel,“ J. Nucl. Mater., vol. 304, pp. 29-49, 2002 [2] R.E. Voskoboinikov and A.E. Volkov, “Effect of point defect interaction
with bubble surface on the nucleation and growth of gas bubbles,“ J. Nucl. Mater., vol. 297, pp. 262-270, 2001
[3] A.E. Volkov and A.I. Ryazanov, “Theory of gas bubble nucleation in supersaturated solution of vacancies, interstitials and gas atoms,“ J. Nucl. Mater., vol. 273, pp. 155-163, 1999
[4] C. Wise, “Recoil release of fission products from nuclear fuel,“ J. Nucl. Mater., vol. 136, pp. 30-47, 1985
[5] B. J. Lewis, “Fission product release from nuclear fuel by recoil and knockout,“ J. Nucl. Mater., vol. 148, pp. 28-42, 1987
[6] J. Noirot, L. Desgranges, and P. Marimbeau, “Fission Gas Behaviour in Water Reactor Fuels,“ NEA and IAEA meeting, 2000, Cadarache, France, p. 223
[7] R. Manzel and R. Eberle, International Topical Meeting on LWR Fuel Performance, ANS/ENS, 21-24th April 1991, Avignon, France, Proceedings, p. 528
[8] J. Noirot, L. Noirot, L. Desgranges, J. Lamontagne, Th. Blay, and B. Pasquet, Proceedings of the 2004 International Meeting on LWR Fuel Performance, Orlando, Florida, September 19-22, 2004
[9] S. Ravel, G. Ducros, T. Petit, L. Caillot, and G. Eminet, European Working Group “Hot Laboratories and Remote Handling” Meeting, September, 21-23, 1998, Windscale (UK)
[10] Y. Pontillon, S. Ravel, D. Parrat, M.P. Ferroud-Plattet, and Y. Guérin, IAEA Technical Committee meeting, Halden, Norway, 10-14th, September, 2001
[11] P . Menegon,. Desgranges, Y. Pontillon, A. Poulesquen, J . Nucl. Mater., vol. 378, (2008), 1 ; Y. Pontillon, L. Desgranges, A. Poulesquen, J. Nucl. Mater. vol 385, issue 1, 2009, 137
[12] (a) C.E.L. Hunt, F.C. Iglesias, D.S. Cox, N.A. Keller, R.D. Barrand, R.F. O’Connor, J.R. Mitchel, G.W. Wood and R. Miksusch, CNS 10th Annual Conference, June 1989. Also as report AECL-10036; (b) P.H. Elder, D.S. Cox, L.W. Wilkinson and R.V. Murphy, CNS 10th Annual Conference, June 1989. Also as report AECL-10036
[13] S. Bernard et al, this proceeding, paper number 130
[14] W. Paul and H. Steinwedel, “Ein neues Massenspektrometer ohne Magnetfeld“, Z. Naturforsch. A, vol. 8, pp. 448-450, 1953
[15] For instance, MKS, Vision 2000-P™, RGA in-situ Process Monitoring; http://www.mksinst.com (accessed April 2015)
[16] Extrel’s MAX50™ and MAX120™, http://www.extrel.com (accessed April 2015)
[17] S. U. Syed, J. Sreekumar, B. Brkic, J. R. Gibson, and S. Taylor, “Effect of an Axial Magnetic Field on the Performance of a Quadrupole Mass Spectrometer”, J. Am. Soc. Mass Spectrom., vol. 21, pp. 2070-2076, 2010
[18] J. Sreekumar, T. J. Hogan, S. Taylor, P. Turner, and C. Knott, “A quadrupole mass spectrometer for resolution of low mass isotopes”, J. Am. Soc. Mass Spectrom., vol. 21, pp. 1364-1370, 2010
[19] S. U. Syed, J. Sreekumar, J. R. Gibson, and S. Taylor, “QMS in the third stability zone with a transverse magnetic field applied”, J. Am. Soc. Mass Spectrom., vol. 22, pp. 1381-1387, 2011
[20] C. C. Klepper, D. L. Hillis, J. Bucalossi, D. Douai, P. Oddon, S. Vartanian, L. Colas, L. Manenc, and B. Pegourie, “Residual gas analysis for long-pulse, advanced tokamak operation”, Rev. Sci. Instrum., vol. 81, pp. 10E104-1-4, 2010
[21] E. Guigues, A. Janulyte, Y. Zerega, Y. Pontillon, and J. Andre, “On-Line Mass Spectrometry Measurement of Fission Gas Release from Nuclear Fuels Submitted to Thermal Transients”, IEEE Trans. Nucl. Sci., Manuscript ID: TNS-00484-2013, accepted
[22] WebBook of Chemistry, NIST, Xe Mass spectrum (electron ionization), Copyright by the U.S. Secretary of Commerce on behalf of the United States of America. http://webbook.nist.gov/chemistry (accessed April 2015)