HAL Id: tel-03168303
https://tel.archives-ouvertes.fr/tel-03168303
Submitted on 12 Mar 2021
HAL is a multi-disciplinary open access archive for the deposit and dissemination of sci-entific research documents, whether they are pub-lished or not. The documents may come from teaching and research institutions in France or abroad, or from public or private research centers.
L’archive ouverte pluridisciplinaire HAL, est destinée au dépôt et à la diffusion de documents scientifiques de niveau recherche, publiés ou non, émanant des établissements d’enseignement et de recherche français ou étrangers, des laboratoires publics ou privés.
of Wealth
Clara Martinez-Toledano
To cite this version:
Clara Martinez-Toledano. Essays on the Accumulation, Distribution and Taxation of Wealth. Sociol-ogy. École des hautes études en sciences sociales (EHESS), 2020. English. �NNT : 2020EHES0074�. �tel-03168303�
´
Ecole des Hautes ´
Etudes en Sciences Sociales
EHESS Doctoral School
Doctoral School no. 465
´
Economie Panth´
eon Sorbonne
Analysis and Policy in Economics
Clara MART´INEZ-TOLEDANO
Essays on the Accumulation, Distribution
and Taxation of Wealth
Supervised by: Thomas PIKETTY
Defense date: July 1st, 2020
Referees : Daniel WALDENSTR ¨OM, Research Institute of Industrial Economics
Gabriel ZUCMAN, University of California, Berkeley
Jury : Facundo ALVAREDO, ´Ecole des Hautes ´Etudes en Sciences Sociales
Olympia BOVER, Banco de Espa˜na
Gabrielle FACK, Universit´e Dauphine
´
Ecole des Hautes ´
Etudes en Sciences Sociales
EHESS Doctoral School
Doctoral School no. 465
´
Economie Panth´
eon Sorbonne
Discipline : Analyse et Politique ´
Economique
Clara MART´INEZ-TOLEDANO
Essais sur l’Accumulation, Distribution
et Taxation du Patrimoine
Th`ese dirig´ee par : Thomas PIKETTY
Date de soutenance: le 1 juillet 2020
Rapporteurs : Daniel WALDENSTR ¨OM, Research Institute of Industrial Economics
Gabriel ZUCMAN, University of California, Berkeley
Jury : Facundo ALVAREDO, ´Ecole des Hautes ´Etudes en Sciences Sociales
Olympia BOVER, Banco de Espa˜na
Gabrielle FACK, Universit´e Dauphine
Acknowledgements
I express my sincere appreciation to those who have contributed to this thesis and supported me in one way or the other during this exciting journey for without any of them, this research work would not have been possible.
First and foremost, I am very grateful to my advisor, Thomas Piketty, for his constant guidance through the process of becoming a researcher. His focus on the big picture, his interest for policy-relevant research, his natural optimism and his intellectual rigor and curiosity are attributes that have deeply inspired me and I hope to take with me in the future. I have felt quite priviledged since the very first day he accepted to be my advisor.
I would also like to thank all the members of my jury: Facundo Alvaredo, Olympia
Bover, Gabrielle Fack, Daniel Waldenstr¨om and Gabriel Zucman. Facundo guided
me from the very beginning and I have greatly benefited from his encouragement, methodological rigor, empathy and honesty. Olympia welcomed me with open arms during my summer visits at the Bank of Spain and I have deeply benefited from her profound knowledge about household finance and the Spanish context. Gabrielle has always been very generous with her time to come to my seminars, discuss and give me very valuable advice. I started working on my dissertation the same year that Daniel arrived at Paris School of Economics and since then he became an excellent mentor and friend. Despite the distance, Gabriel has always been extremely supportive all these years and his work has greatly inspired my studies. He also kindly sponsored my visit at UC Berkeley, from which I enormously benefited. I am also very thankful to Camille Landais for sponsoring by visit at London School of Economics and his support and advice while in London and during the job market. I also want to thank Salvador Ortigueira for encouraging me to start a PhD. The last two chapters of this thesis would not exist without the generous help of Jorge Onrubia in accessing the Spanish administrative wealth tax records. Axelle Ferriere, Pedro Gete, V´eronique Guillotin, David Koll, Benjamin Moll and Emmanuel Saez were extremely helpful during the last phase of my PhD too.
I also owe a sincere amount of gratitude to the institutions that have financed the different phases of my doctoral studies: Fundaci´on Ram´on Areces, Banco de Espa˜na
and Fundaci´on Rafael del Pino. Banco de Espa˜na also gave me the opportunity to
visit its research department during two consecutive summers. I only have good memories from the many interactions with all the kind and excellent researchers working there. In addition, I want to thank the OECD and in particular, Pierre Beynet, A´ıda Caldera, David Haugh, David Law and Muge Adalet McGowan for counting on me as an additional support for the Spanish Desk.
This thesis owes a great deal to all the World Inequality Lab (WIL) team. What an incredibly stimulating and wonderful environment! I want to specially thank my officemates and colleagues Lydia Assouad, Luis Bauluz, Oscar Barrera, Yonatan
Berman, Thomas Blanchet, Lucas Chancel, Richard Clarke, L´eo Czajka, Carmen
Durrer, Ignacio Flores, Bertrand Garbinti, Amory Gethin, Shalmali Ghaisas, Yaz Govind, Jonathan Goupille, Marc Jenmana, Rowaida Khaled, Nitin Kumar, Ana
Leiva, Marc Morgan, Mathilde Mu˜noz, Theresa Neef, Tom Raster, Olivia Ronsain,
Mauricio de Rosa, Alice Sodano, Aur´elie Sotura, Joan Vil´a, Li Yang and ´Alvaro Z´u˜niga-Cordero. I have spent very nice moments with them in and outside the Lab (many at le chalet !).
The best part of research is teamwork. It is at the WIL where I have met my very first coauthors and now friends, Miguel Artola and Luis Bauluz, from which I have tremendously learned. Together with Amory Gethin and Thomas Piketty, we are currently embarked in the editing of an exciting book! I am very grateful to all of them and to my latest coauthors, David Agrawal and Dirk Foremny, for their patience and treating me as an equal despite their seniority. I really hope to continue learning from all of them in future projects.
During this exciting PhD journey between Paris, London and Berkeley I have also met many nice people with whom I did not only have productive research discussions, but also shared offices, appartments, funny coffee breaks, lunches, dinners, soir´ees, trips and soccer games! I am very thankful for all these moments to Vanda Almeida,
Cyprien Batut, Hamza Benhaddou, Paul Brandily, Cl´ement Brebion, Simon Briole,
Elias Bouacida, Lucas Buffard, Julien Combe, Julien Daviet, Quentin Daviot, Sarah Deschˆenes, Sof´ıa Dromundo, Salom´e Drouard, Paul Dutronc, Mart´ın Fern´andez, Se-basti´an Franco, Nolwenn Gontard, Alicia Hern´andez, Niklas Heusch, Giulio Iacobelli, Hunter Johnson, Laura Khoury, Justine Knebelmann, Fanny Landaud, Marion Ler-outier, Quentin Lippmann, Will Lobo, Juliana Londo˜no-V´elez, Emanuela Migliaccio,
´
7
Paolo Santini, Roberto Schiano, Shaden Shabayek, Mariona Seg´u, Sara Signorelli,
Juni Singh, Itziar Tamayo, Alessandro Tondini, Cl´ementine Van Effenterre and
Carmen Villa.
A special mention goes to Jos´e Montalb´an (Pep). We met during our first master
in Madrid, but our friendship kept growing throughout the PhD thanks to the nice days we have spent together both in London and Paris. My PhD life would not have been as beautiful without him, I am already missing all these moments. I also
want to thank Mariona Seg´u for her honest friendship, she has undoubtedly become
meu catalana preferida :) During the PhD it was not possible, but I am sure we will finally end up being not only good friends but also coauthors. I am also very grateful to Mart´ın Fern´andez. He was the best job market buddy one could think of and his energy and friendship were an incredible support. I do not forget that I still owe him and Pepe una mariscada!
Throughout the PhD, I have also benefited from the relaxing times spent in Spain together with my non-academic friends from kindergarten (Mar, Nuria and Raquel), from my old basketball days (Jorge and Luis), from my parents’ village Illana (all Los
Manolitros, but in particular ´Angela and Eva) and from my undergraduate studies
at Carlos III (Ester, Javier, Julia, Marta and Samuel). I also want to thank all the classmates of my first master at Carlos III, with whom I started this incredible academic adventure.
This thesis is largely indebted to my family—in particular, to my parents—for having supported me at every single stage of my long studies and having provided me with the most valuable asset one can hold: education. My father can sadly not see this thesis in its final shape, but knowing his interest in inequalities I am pretty sure he will be at least as excited as I am. His generosity, kindness and joy of life will always be sources of inspiration for me. I am extremely grateful to my mother for always guiding me and for taking care of my father when we and he most needed it. I cannot think of any better role model. I am also very thankful to my brother, Carlos, for making me laugh and always caring about me.
Finally, there are not enough words to thank ´Alvaro for his unconditional support. No matter how far we have been from each other, I have always felt him close. ¡Gracias de coraz´on!
Clara Mart´ınez-Toledano 6th April 2020
9
Summary
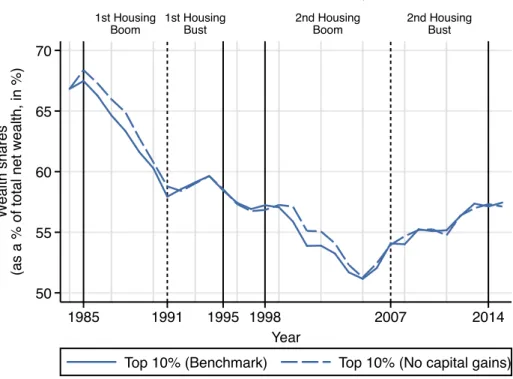
This thesis analyzes the accumulation, distribution and taxation of wealth, using the Spanish context as a laboratory. The first two chapters have a particular focus on housing. In the first chapter, we reconstruct Spain’s national wealth from 1900 to 2017. By combining new sources with existing accounts, we estimate the wealth of both private and government sectors and use a new asset-specific decomposition of the long-run accumulation of wealth. We find that during the 20th century, the national wealth-to-income ratio remained within a relatively narrow range—between 400 and 600%—until the housing boom of the early 2000s led to an unprecedented rise to 800% in 2007. Our results highlight the importance of land, housing capital gains and international capital flows as key elements of wealth accumulation. In the second chapter, I study the implications of housing booms and busts for wealth inequality, examining two episodes over the last four decades in Spain. I combine fiscal data with household surveys and national accounts to reconstruct the entire wealth distribution and develop a new asset-specific decomposition of wealth accumulation to disentangle the main forces behind wealth inequality dynamics (e.g., capital gains, saving rates). I find that the top 10% wealth share drops during housing booms, but the decreasing pattern reverts during busts. Differences in capital gains across wealth groups appear to be the main drivers of the decline in wealth concentration during booms. In contrast, persistent differences in saving rates across wealth groups and portfolio reshuffling towards financial assets among top wealth holders are the main explanatory forces behind the reverting evolution during housing busts. I show that the heterogeneity in saving responses is consistent with the existence of large differences in portfolio adjustment frictions across wealth groups and that tax incentives can exacerbate this differential saving behavior. These results provide novel empirical evidence to enrich macroeconomic theories of wealth inequality over the business cycle.
In the third chapter, we study the effect of annual wealth taxes on migration. We analyze the unique decentralization of the Spanish wealth tax system following the
reintroduction of the tax in 2011. Madrid is the only region that did not reintroduce the wealth tax. Using linked administrative wealth and income tax records, we exploit the quasi-experimental variation in tax rates generated by the reform to understand the mobility responses of high wealth individuals and the resulting effect on wealth tax revenue and wealth inequality. Aggregating the individual data to the region-year-wealth tax filer level, we find that five years after the reform, the stock of wealthy individuals and the stock of wealth “residing” in the region of Madrid increased, respectively, by 11% and 12% relative to other regions prior to the reform. Using an individual choice model, we show that conditional on moving, Madrid’s zero tax rate increased the probability of changing one’s fiscal residence to Madrid by 24 percentage points. We show that Madrid’s status as a tax haven exacerbates regional wealth inequalities and erodes the effectiveness of raising tax revenue and curving wealth concentration.
Keywords: wealth; housing; inequality; asset prices, saving; tax; mobility JEL codes: D31, H31, G51
Table of Contents
Acknowledgements 4 Summary 9 Table of Contents 12 List of Tables 16 List of Figures 18 General Introduction 231 Long-Run Wealth Accumulation in Spain 31
1.1 Literature review . . . 33
1.1.1 Long-run evolution of national wealth . . . 33
1.1.2 Determinants of the increase in housing prices since the late 1990s . . . 34
1.2 Concepts, methodology, and empirical estimate . . . 35
1.3 Results . . . 40
1.3.1 Personal wealth . . . 40
1.3.2 National wealth . . . 45
1.4 International capital flows and housing prices . . . 52
1.5 Concluding comments . . . 60
Bibliography . . . 61
2 Housing and Wealth Inequality in Spain 65 2.1 Concepts, Data and Methodology . . . 72
2.1.1 Aggregate Wealth: Concept and Data Sources . . . 72
2.1.2 Distribution of Wealth: The Mixed Capitalization-Survey Ap-proach . . . 74
2.2 House Price Cycles and the Wealth Distribution . . . 81 13
2.2.1 Evolution of Real House Prices and Aggregate Household Wealth 82
2.2.2 Wealth Inequality Dynamics during Housing Booms and Busts 85
2.2.3 Determinants of Wealth Inequality Dynamics during Housing
Booms and Busts . . . 90
2.3 Nature of Asset-Specific Saving Responses . . . 106
2.3.1 Portfolio Adjustment Frictions . . . 106
2.3.2 Real Estate Market Dynamics . . . 107
2.3.3 Tax incentives . . . 109
2.4 Concluding comments . . . 118
Bibliography . . . 120
3 Wealth Taxation and Mobility in Spain 123 3.1 Introduction . . . 123
3.2 Institutional Details . . . 130
3.3 Description of Data . . . 134
3.3.1 Wealth Extrapolation Method . . . 135
3.3.2 Tax Calculator . . . 136
3.3.3 Treatment and Comparison Groups . . . 138
3.4 Descriptive Evidence . . . 140
3.5 Aggregate Analysis . . . 144
3.5.1 Results . . . 147
3.6 Individual Choice Model . . . 157
3.6.1 Results . . . 161
3.6.2 Heterogeneity . . . 166
3.7 Implications for Revenue and Wealth Inequality . . . 168
3.7.1 Revenue Analysis . . . 168
3.7.2 Wealth Inequality Analysis . . . 170
3.8 Concluding comments . . . 175
Bibliography . . . 179
General Conclusion 182 A Long-run Wealth Accumulation in Spain 185 A.1 Introduction . . . 185
A.1.1 Concepts . . . 185
A.1.2 Asset classification . . . 186
A.1.3 Time coverage . . . 187
TABLE OF CONTENTS 15
A.2.1 Produced assets . . . 188
A.2.2 Non-produced assets . . . 196
A.3 Personal wealth . . . 200
A.3.1 Non-financial assets . . . 200
A.3.2 Financial assets . . . 205
A.3.3 Liabilities . . . 219
A.4 General government wealth . . . 221
A.4.1 Non-financial produced assets: public capital . . . 221
A.4.2 Non-financial non-produced assets . . . 221
A.4.3 Financial assets . . . 222
A.4.4 Liabilities . . . 225
A.5 Corporate wealth . . . 226
A.5.1 Non-financial assets of non-financial corporations . . . 227
A.5.2 Non-financial assets of financial institutions . . . 228
A.5.3 Financial assets and liabilities . . . 228
A.5.4 Tobin Q . . . 228
A.6 Foreign wealth . . . 229
A.7 Income and saving . . . 231
A.7.1 National income . . . 231
A.7.2 National savings and the current account balance . . . 233
A.7.3 Decomposition of wealth accumulation . . . 234
A.7.4 Interactions between international capital flows and housing prices . . . 237
A.8 Additional robustness checks . . . 239
A.8.1 Sensitivity of housing wealth series . . . 240
A.8.2 Housing assets decomposed into land and structures: the resid-ual approach . . . 243
A.8.3 Alternative measurement of book-value national wealth . . . . 245
A.8.4 The decomposition of national wealth accumulation with the book-value approach and the private wealth sub-component . 259 A.8.5 Capital gains and asset price changes . . . 261
A.8.6 Market vs. book-value wealth estimation . . . 262
Bibliography . . . 267
B Housing and Wealth Inequality in Spain 276 B.1 Imputation methods . . . 276
B.1.1 Bottom of the income distribution . . . 276
B.2 The Spanish Personal Income Tax and Wealth Tax . . . 280
B.2.1 A Recount of Personal Income Taxation in Spain . . . 280
B.2.2 A Recount of Wealth Taxation in Spain . . . 300
B.3 Accounting for Offshore Wealth . . . 303
B.4 Robustness Checks on the Distribution Series . . . 317
B.4.1 Comparison with Other Sources . . . 317
B.4.2 Testing the Mixed Capitalization-Survey Method . . . 320
B.5 Identifying Housing Booms and Busts . . . 320
B.6 Wealth Distribution in Spain by Age . . . 323
B.7 Wealth Mobility and Synthetic Saving Rates . . . 323
B.8 Alternative Explanations to Saving Responses . . . 325
B.8.1 Risk aversion . . . 325
B.8.2 Financial Knowledge and Financial advising . . . 325
B.8.3 Expectations on House Prices . . . 326
B.9 Appendix Figures and Tables . . . 326
Bibliography . . . 365
C Wealth Taxation and Mobility in Spain 368 C.1 Appendix . . . 368
C.1.1 Institutions Appendix . . . 368
C.1.2 Data Appendix . . . 374
List of Tables
1.1 Accumulation of national wealth in Spain, the US, the UK, Germany,
France, and Sweden, 1900-2016 (multiplicative decomposition) . . . . 49
1.2 Accumulation of national wealth in Spain, 1900-2017 (Additive de-composition) . . . 52
1.3 Net foreign asset position of the Spanish economy (as a percentage of national income), 1997-2017 . . . 54
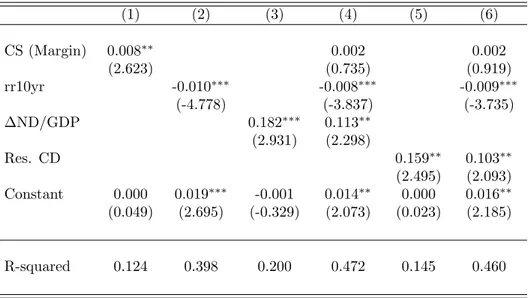
1.4 Quarterly regressions of real housing price growth on international capital flows growth, credit standards and real interest rates, 2002-2017 59 2.1 Average annual rates of return in Spain, 1984-2015 . . . 79
2.2 Wealth thresholds and shares in Spain, 2015 . . . 87
2.3 Real estate demand: Rich districts vs. Rest, 2009 . . . 108
2.4 Summary statistics, 2004-2006 . . . 113
2.5 Differences-in-differences results . . . 115
3.1 Summary Statistics, 2010 (2010 Wealthy Treatment Sample) . . . 140
3.2 Effect of Madrid’s Tax Haven Status: Evidence from the Event Study 150 3.3 Effect of Madrid’s Tax Haven Status: Evidence from a DDD . . . 152
3.4 Elasticities of the Stocks with Respect to the Net-of-Tax Rate . . . . 156
3.5 Individual Choice Model . . . 161
3.6 Individual Choice Model (Tax Differential) . . . 165
A.1 Regression of real housing price growth on international capital flows growth, 2002-2017 . . . 238
A.2 Accumulation of book-value national wealth in Spain, 1900-2017 (Mul-tiplicative decomposition) . . . 260
A.3 Accumulation of book-value national wealth in Spain, 1900-2017 (Ad-ditive decomposition) . . . 261
A.4 Accumulation of national wealth: comparison of national wealth measures (Multiplicative decomposition), 1950-2017 . . . 262
A.5 Accumulation of market value national and private wealth in Spain, with two ending years: 2010 and 2017 (Multiplicative decomposition) 263 A.6 A comparison between estimated and observed real capital gains.
Spain, 1980-2017 . . . 264
B1 Households (HH) and non-profit institutions serving households (NPISH) net wealth, 1995-2017 . . . 350
B2 Composition of household debt, 2002-2014 . . . 351
B3 Collectibles and consumer durables, 2002-2014 . . . 351
B4 Population in Basque Country and Navarre, 1984-2017 . . . 352
B5 GDP in Basque Country and Navarre, 1984-2016 . . . 353
B6 Personal income tax filers, 1999-2015 . . . 354
B7 Housing wealth in Basque Country and Navarre, 1991-2003 . . . 355
B8 Home ownership-ratios (primary residences) in Spain, 1970-2011 . . . 355
B9 Imputed net household wealth, 1984-2015 . . . 356
B10 Comparison of wealth aggregates in Spain, 2005 . . . 357
B11 Primary residence by wealth group in Spain, 2002-2014 . . . 358
B12 Other real estate properties by wealth group in Spain, 2002-2014 . . . 359
B12 Other real estate properties by wealth group in Spain, 2002-2014 (cont.)360 B13 Differences-in-differences results (using different treatment windows) . 361 B14 Differences-in-differences results (positive interest income prior to the reform) . . . 362
B15 Wealth mobility, 1999-2014 . . . 363
B16 Attitudes towards risk by wealth group in Spain, 2002-2014 . . . 363
B17 Financial knowledge and advice by income group in Spain, 2016 . . . 364
B1 Aggregate Model: Effect of Madrid (All 2007 Wealth Tax Filers) . . . 377
B2 Aggregate Model: Effect of Madrid on Wealth (Using Time-varying Wealth) . . . 378
B3 Aggregate Model: Elasticities for 2007 Wealth Tax Filers . . . 379
List of Figures
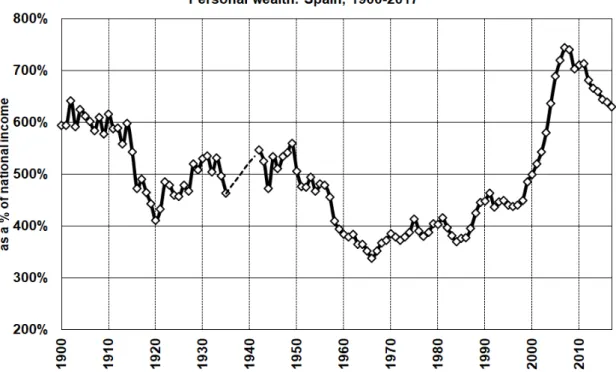
1.1 Personal wealth. Spain, 1900-2017 . . . 41
1.2 Portfolio composition of the personal sector, 1900-2017 . . . 43
1.3 Personal liabilities. Spain, 1900-2017 . . . 44
1.4 National wealth and domestic nonfinancial assets, 1900-2017 . . . 47
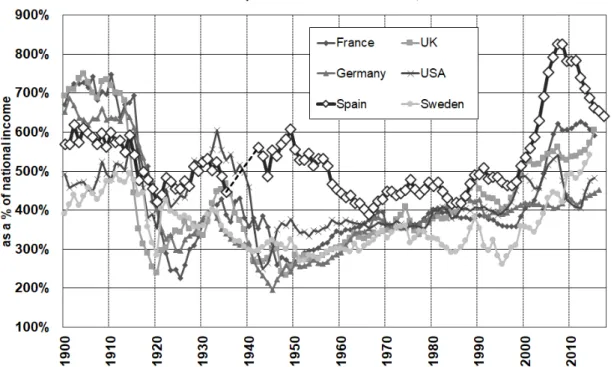
1.5 International comparison of national wealth, 1900-2017 . . . 48
1.6 International comparison of agricultural land and housing wealth, 1900-2017 . . . 50
1.7 Long-term evolution of the net foreign asset position . . . 51
1.8 Market for debt securities in Spain . . . 56
1.9 Selected assets and liabilities of Spanish monetary financial institutions 57 2.1 Real house price index in Spain, 1984-2015 . . . 83
2.2 Aggregate household wealth: Spain vs. Advanced economies . . . 84
2.3 Wealth distribution and its composition in Spain . . . 86
2.4 Asset composition across the wealth distribution in Spain, 1984-2015 89 2.5 Wealth accumulation decomposition by wealth group in Spain, 1984-2015 93 2.6 Simulated top 10% wealth share in Spain, 1984-2015 . . . 94
2.7 Average income by wealth group in Spain, 1984-2015 . . . 98
2.8 Consumption and debt by wealth group in Spain . . . 99
2.9 Asset-specific saving rates by wealth group in Spain, 1984-2014 . . . . 101
2.10 Stock of real estate by wealth group in Spain, 2002-2014 . . . 103
2.11 Simulated wealth distribution fixing 2002 asset composition, 1999-2015105 2.12 Mechanical changes in marginal net of tax rates on financial income . 112 2.13 Difference between tax cuts and tax increases among wealth taxpayers by pre-reform income bracket, 2004-2014 . . . 116
2.14 Simulated top 10% wealth share in Spain, 1999-2014 . . . 117
3.1 Madrid’s Zero Tax Rate Facilitates Tax-induced Mobility . . . 126
3.2 Marginal Tax Rates across Regions . . . 132 19
3.3 Transition Matrix: Flows by Region Pairs . . . 141 3.4 Net Migration Patterns . . . 142
3.5 Event Study of the Share of Individuals in Madrid, 2010 Wealthy . . 148
3.6 Event Study of the Share of Wealth in Madrid (2007 filers) . . . 149
3.7 Elasticity of Number of Individuals . . . 155
3.8 Probability of Moving to Madrid (Choice-Event-Study) . . . 163
3.9 Probability of Moving to a Region Relative to Castile-La Mancha . . 164
3.10 Heterogeneous Effects . . . 167 3.11 Heterogeneous Effects: Region of Origin . . . 168 3.12 Wealth tax revenue across Spanish regions, 2011-2015 . . . 170 3.13 Total wealth tax revenue, 2011-2015 (centralized vs. decentralized
wealth tax system) . . . 171 3.14 Distribution of wealth tax revenue across Spanish regions, 2011-2015 . 172
3.15 Top 1% wealth concentration across Spanish regions, 2003-2015 . . . 175
3.16 Top 1% Wealth Concentration, 2003-2015: Madrid vs. Rest of Spain . 176 A.1 Housing wealth in Spain: Alternative estimates, 1980-2014 . . . 240 A.2 Average growth rate in house prices by municipality population size . 241 A.3 Average growth rate in house prices: coastal vs. non-coastal
munici-palities . . . 242
A.4 International comparison of Jord`a et al. (2019) real housing price
indeces . . . 243 A.5 International comparison of housing wealth based on wealth surveys,
2007-2016 . . . 244 A.6 Real house prices indices, 1900-1934 . . . 244 A.7 Housing decomposition, 1900-2016 . . . 246 A.8 PIM estimates of produced assets: geometric vs. modified geometric
depreciation (with non-fixed assest lives), 1900-2017 . . . 248 A.9 PIM estimates of produced assets: geometric (with non-fixed assets
lives) vs modified geometric depreciation (with fixed assest lives), 1900-2017 . . . 248 A.10 PIM estimates of produced assets: geometric (with non-fixed assets
lives) vs modified geometric depreciation (with fixed assest lives), 1900-2017 . . . 249 A.11 Consumption of Fixed Capital based on smoothed service lives:
LIST OF FIGURES 21 A.12 Consumption of Fixed Capital: geometric and smoothed service lives
(benchmark) vs modified geometric and non-smoothed service lives, 1900-2017 . . . 251 A.13 Consumption of Fixed Capital using geometric depreciation: smoothed
(benchmark) vs non-smoothed service lives, 1900-2017 . . . 251 A.14 Consumption of Fixed Capital: geometric and smoothed service lives
vs. modified geometric depreciation and smoothed service lives vs. OECD, 1900-2016 . . . 252 A.15 Consumption of Fixed Capital: geometric and smoothed service lives
vs. Prados de la Escosura (2017) vs. OECD, 1900-2016 . . . 253 A.16 Book-value national wealth using PIM estimates of produced assets
A, 1900-2017 . . . 255 A.17 Book-value national wealth using PIM estimates of produced assets
B, 1900-2017 . . . 255 A.18 Book-value national wealth using PIM estimates of produced assets
C, 1900-2017 . . . 256 A.19 Composition of domestic non-financial assets: PIM using modified
geometric depreciation & smoothed service lives, 1900-2017 . . . 256 A.20 Composition of domestic non-financial assets: PIM using modified
geometric depreciation & non-smoothed service lives, 1900-2017 . . . 257 A.21 Composition of domestic non-financial assets: PIM using geometric
depreciation & non-smoothed service lives, 1900-2017 . . . 257 A.22 Tobin’s Q ratio: alternative measures A, 1981-2017 . . . 258 A.23 Tobin’s Q ratio: alternative measures B, 1981-2017 . . . 258 A.24 Tobin’s Q ratio: alternative measures C, 1981-2017 . . . 259 A.25 Consolidated balance sheet of the corporate sector . . . 265 A.26 Corporate non-financial assets . . . 265 A.27 Business assets . . . 266
B1 Personal Income Tax Form D-100, 2007 . . . 282
B1 Personal Income Tax Form D-100, 2007 (cont.) . . . 283
B1 Personal Income Tax Form D-100, 2007 (cont.) . . . 284
B1 Personal Income Tax Form D-100, 2007 (cont.) . . . 285
B1 Personal Income Tax Form D-100, 2007 (cont.) . . . 286
B1 Personal Income Tax Form D-100, 2007 (cont.) . . . 287
B1 Personal Income Tax Form D-100, 2007 (cont.) . . . 288
B1 Personal Income Tax Form D-100, 2007 (cont.) . . . 289
B1 Personal Income Tax Form D-100, 2007 (cont.) . . . 291
B1 Personal Income Tax Form D-100, 2007 (cont.) . . . 292
B1 Personal Income Tax Form D-100, 2007 (cont.) . . . 293
B1 Personal Income Tax Form D-100, 2007 (cont.) . . . 294
B1 Personal Income Tax Form D-100, 2007 (cont.) . . . 295
B1 Personal Income Tax Form D-100, 2007 (cont.) . . . 296
B1 Personal Income Tax Form D-100, 2007 (cont.) . . . 297
B1 Personal Income Tax Form D-100, 2007 (cont.) . . . 298
B1 Personal Income Tax Form D-100, 2007 (cont.) . . . 299
B2 Wealth Tax Form D-714, 2007 . . . 307
B2 Wealth Tax Form D-714, 2007 (cont.) . . . 308
B2 Wealth Tax Form D-714, 2007 (cont.) . . . 309
B2 Wealth Tax Form D-714, 2007 (cont.) . . . 310
B2 Wealth Tax Form D-714, 2007 (cont.) . . . 311
B2 Wealth Tax Form D-714, 2007 (cont.) . . . 312
B2 Wealth Tax Form D-714, 2007 (cont.) . . . 313
B2 Wealth Tax Form D-714, 2007 (cont.) . . . 314
B2 Wealth Tax Form D-714, 2007 (cont.) . . . 315
B2 Wealth Tax Form D-714, 2007 (cont.) . . . 316
B3 Real estate transactions and mortgage loans in Spain, 1980-2015 . . . 327
B4 International comparison of real house prices and top wealth shares . 328
B5 House price distribution in Spain . . . 329
B6 Saving rate on unincorporated business assets by wealth group in
Spain, 1985-2015 . . . 330 B7 Alternative asset-specific decomposition using group-and-asset specific
rates of capital gain for Spain, 1984-2015 . . . 331 B8 Attitudes towards saving, 2002-2014 . . . 332
B9 Composition of home-ownership ratios in Spain, 1999-2015 . . . 333
B10 Foreign housing transactions in Spain, 2006-2017 . . . 334 B11 Real capital gains and saving rates by wealth group in France, 1972-2011335 B12 Real capital gains and saving rates by wealth group in the US, 1994-2014336 B13 Dual personal income tax schedule before and after the reform in
Spain, 2003-2014 . . . 337 B14 Mechanical changes in marginal net of tax rates on financial income
by wealth group . . . 338 B15 Effects of the 2007 personal income tax reform among wealth taxpayers339
LIST OF FIGURES 23 B16 Composition of top 1% wealth share including unreported offshore
wealth in Spain, 1984-2015 . . . 340 B17 Offshore wealth in Spain, 1984-2015 . . . 341 B18 Wealth tax tabulations vs. Mixed capitalization-survey method in
Spain, 1984-2007 . . . 342 B19 Wealth shares: Mixed capitalization-survey method vs. SHF in Spain,
2002-2014 . . . 343 B20 Asset composition at the top of the wealth distribution in Spain,
2002-2014 . . . 344 B21 SHF wealth shares: Direct vs. Capitalized wealth in Spain, 2002-2014 345 B22 Wealth distribution by age, 1999-2015 . . . 346 B23 Wealth shares: Cross-section vs. Panel . . . 347 B24 Real capital gains and saving rates by wealth group in Spain, 2002-2015
(restricted sample) . . . 348 B25 Annual real capital gains in Spain, 1984-2014 . . . 349
B1 Cumulative Distribution of Wealth Tax Filers by Labor Income . . . 374
B2 Average taxable wealth across Spanish regions, 2011-2015 . . . 375
B3 Extrapolated vs. Actual taxable wealth, 2011-2015 (using Catalan
wealth tax records) . . . 376
B4 Event Study of the Share of Individuals in Madrid . . . 381
B5 Event Study of the Share of Wealth in Madrid . . . 382
B6 Elasticity of Number of Individuals (Top Marginal Rates) . . . 383
B7 Elasticity of Stock of Wealth . . . 384
B8 Probability of Moving to Madrid Relative to Each Region . . . 385
B9 Wealth Concentration in Spain, 2003-2015 . . . 386
B10 Top 1% Wealth Concentration across Spanish regions, 2003-2015 (with and without mobility) . . . 387
General Introduction
This thesis covers several topics at the intersection of contemporary macroeconomics, inequality and taxation research. In particular, it analyzes the accumulation, distri-bution and taxation of wealth, using the Spanish context as a laboratory. The three chapters follow an explicit logical progression and the first two have a particular focus on housing. In the first chapter, we reconstruct Spain’s national wealth from 1900 to 2017 and use the new series to better understand the determinants of long-run wealth accumulation. In the second chapter, I reconstruct wealth distribution series since the 1980’s for Spain and use them to study the implications of housing booms and busts for wealth inequality. In the third chapter, we study the effect of the decentralization of the Spanish annual wealth tax on mobility and how these migration responses affect regional wealth inequalities and revenues.
The importance of focusing on “Wealth”
Wealth has gained increasing attention from both the academic community and public opinion. This renewed interest is largely motivated by three recently established empirical facts. First, household wealth has grown faster than national income in the last four decades in advanced economies, with similar levels to those observed in the eighteenth and nineteenth centuries (Piketty and Zucman, 2014a). Second, wealth inequality among individuals has increased at different speeds across countries since the 1980’s, rising, for instance, much faster in the United States than in continental Europe (Alvaredo et al., 2018). Third, cross-border positions represent a significant fraction of total household wealth, in particular, assets held by households in offshore tax havens account for 8% of the global financial wealth (Zucman, 2013).
Despite this progress in documenting the evolution of aggregate wealth and its distribution, very little is still known on the determinants of both wealth accumulation and wealth inequality. This is likely due to the scarcity of countries for which both consistent long-run aggregate and distributional wealth data are available and
25 the difficulty to quantify the importance of each determinant. This thesis breaks new grounds on these issues by reconstructing harmonized long-run aggregate and distributional wealth series consistent with national accounts for the case of Spain. The new series are used to study the determinants of both wealth accumulation and wealth inequality. In particular, I analyze in great detail the role of housing in explaining wealth dynamics. I focus on housing since it is the main asset in most individual portfolios (Saez and Zucman, 2016; Garbinti, Goupille, and Piketty, 2019) and it forms the lion’s share of total return on aggregate wealth (Jord`a et al., 2019). Moreover, the recent rise in household wealth to national income ratios has been mainly driven by capital gains on housing (Piketty and Zucman, 2014a).
In this context of growing inequalities, progressive wealth taxation has received renewed interest as a tool to raise revenue and curb inequality. Following Piketty’s (2014) call for a global wealth tax and recent proposals to tax wealth in the United States, much of the academic and policy discussions have focused on whether wealth taxes are enforceable if taxpayers avoid or evade them. This thesis sheds new light on these issues by studying the role of wealth taxes for migration.
The Spanish case
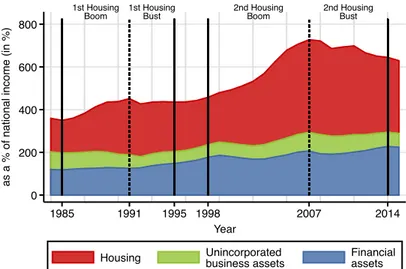
When analyzing the evolution and determinants of both wealth accumulation and wealth inequality, Spain is a country that clearly deserves international scholars’ attention for three main reasons. First, the Spanish economy has experienced large swings in asset prices, constituting an ideal laboratory to examine the determinants of aggregate wealth dynamics and its distribution. In particular, Spain has underwent two housing booms (1985-1991, 1998-2007) and busts (1992-1995, 2008-2014) in the last forty years.
Second, after entering the Eurozone in the late 1990s, together with Greece and Portugal, the country has experienced the largest deterioration in its net foreign asset position. Nonetheless, the factors driving the growth of Spain’s foreign liabilities are clearly distinctive. According to the IMF’s data on international investment positions, in Greece and Portugal the growth of public debt explained the increase in the negative foreign asset position, while in Spain this rise was mainly driven by the increase in private debt. Since this rise in private debt happened together with the recent housing boom and bust, we can study the complex interaction among the two. Third, Spain is one of the few countries in the world that has an annual wealth tax and publicly available statistics on individual incomes and asset ownership based on
tax records. Moreover, contrary to most countries, the wealth tax has been recently decentralized to the regions. Hence, Spain constitutes an ideal setting to study the role of taxation in inducing mobility of individuals across regions and in shaping wealth inequalities and tax revenues.
The evolution and determinants of long-run wealth
accumu-lation
For a long time, empirical research on the evolution and determinants of wealth accumulation was hampered by lack of data. It is not until the 1990s and 2000s that national statistical offices started to publish time series of national wealth, following the release of the 1993 System of National Accounts guidelines, that included wealth for the first time. This interest in estimating national wealth was a common practice until the early twentieth century, but it nearly disappeared following the 1914-1945 capital shocks due to first, the new emphasis on short-run output fluctuations following the Great Depression, and second, because of the difficulty to compute and make annual comparisons of the current market value of wealth given the large asset
price movements between the wars.1
Despite the absence of widespread national balance sheets, empirical research on wealth gained increasing attention from scholars and the public in recent decades. A first effort to put together historical balance sheets in recent decades was carried by Goldsmith in 1985 and 1991. The second major impetus came from the studies of Piketty, 2014 and Piketty and Zucman, 2014b who presented a new study of long-term dynamics of the wealth-to-income ratios for a set of advanced countries. The researchers’ key finding was that the relationship between wealth and income was not stable over time. On the contrary, wealth-to-income ratios followed a strong U-shaped pattern over the twentieth century, most prominently in Europe. Together, these results have incentivized researchers to reconstruct the dynamics of national wealth in other countries while adopting a long-term perspective (e.g., Waldenstr¨om, 2017, Kumar, 2019). The first chapter of this thesis contributes to this new wave of long-run studies of wealth by reconstructing for the first time a consistent national
1Piketty and Zucman, 2014b document that the first statistics on national wealth were published
in the late seventeenth and early eighteenth centuries in the United Kingdom (Petty (1664); King (1696)) and in France (Boisguillebert (1695); Vauban (1707)). The publication of national wealth estimates grew in the nineteenth and early twentieth centuries with new series in the United Kingdom (Colqhoun (1815), Giffen (1889); Bowley (1920)), France (Foville (1893); Colson (1903)), Germany (Helfferich (1913)) and the United States (King (1915)).
27 balance sheet for Spain from 1900-2017. The new series reveal hat Spain’s national wealth-to-income ratio has followed a J-shaped evolution during the twentieth century that differs from the U-shaped trends observed in other developed countries. The Spanish context also serves as a useful case-study to highlight the importance of land, housing capital gains and international capital flows as key drivers of long-run wealth accumulation.
Wealth inequality over the business cycle: Savings vs.
Capi-tal gains
Wealth has grown faster than national income in advanced countries in recent decades (Piketty and Zucman, 2014a) and at the same time, wealth concentration trends have diverged, rising, for instance, much faster in the US than in continental Europe (Alvaredo et al., 2018). Yet, very little is known on the complex interaction between
the evolution of aggregate household wealth and its distribution.
These interactions are of particular importance during asset booms and busts. Wealth levels and portfolio composition along the distribution might significantly change—either mechanically through asset price changes, saving responses, or a combination of both—and consequently, trends in medium to long-term wealth inequality could revert. Wealth inequality matters in the determination of aggregates such as consumption (Carroll, Slacalek, and Tokuoka, 2014, Krueger, Mitman, and Perri, 2016). Thus, understanding the determinants of wealth inequality dynamics at different phases of the economic cycle is of interest to gauge the risks of business cycles and set appropriate stabilization policies.
Thse second chapter of this thesis breaks new grounds on these issues by studying how large house price fluctuations shape the wealth distribution examining the Spanish context. I develop a novel asset-specific decomposition of wealth accumulation that I use to identify the key forces (e.g., capital gains, saving rates) behind the observed wealth inequality dynamics. This new decomposition is critical to better understand saving responses, which have attracted much less scrutiny than asset prices in the analysis of wealth inequality dynamics over the business cycle (Kuhn, Schularick, and Steins, 2018). This chapter provides novel ingredients to generate realistic wealth dynamics in quantitative models of wealth inequality (Achdou et al., 2017, Benhabib and Bisin, 2018, De Nardi and Fella, 2017, Gomez, 2019, Hubmer, Krusell, and Smith Jr., 2019).
The role of wealth taxes for mobility to tax havens
Rising capital shares of income and associated increases in inequality observed in many developed countries have spurred new interest in the taxation of wealth. Many of the academic and policy discussions have focused on whether wealth taxes are enforceable if taxpayers avoid or evade them. The reason is that taxpayers might respond by hiding assets in tax havens, as there is evidence that a significant fraction of financial assets owned by the wealthy is held offshore (Alstadsæter, Johannesen, and Zucman, 2019; Zucman, 2015). In part, this was a motivating factor in Piketty’s 2014 call for a global wealth tax: “if all countries do not implement a wealth tax, then mobile capital would simply flow to tax havens where wealth tax rates are zero”.
Despite the relevance of annual wealth taxes in recent policy debates, evidence on the behavioral responses to wealth taxes is relatively small (Br¨ulhart et al., 2016; Londo˜no-V´elez and ´Avila-Mahecha, 2018; Seim, 2017) and on migration, in particular, almost non-existent. Moreover, very little is known about how these behavioral responses might shape regional wealth inequalities between sending and receiving regions. The lack of studies on wealth taxes has been partly driven by limited sources of exogenous variation in wealth taxes, which often times are implemented at the national level. Given the difficulty of cross-country comparisons, little variation in wealth taxes exists across individuals or regions within a country. Furthermore, any study of migration must know where the taxpayer originated and migrated to, which requires potential harmonization of multiple countries’ administrative tax records. The third chapter of this thesis moves a step forward by studying the effect of annual wealth taxes on migration. We take advantange of the unique decentralization of the Spanish wealth tax system in 2011, after which all regions raised positive tax rates except from Madrid. Our findings reveal that Madrid’s status as a tax haven has attracted a disproportionally share of wealthy. We show that these migration responses have exacerbated regional wealth inequalities and eroded the effectiveness of raising tax revenue and curving wealth concentration.
Outline and Summary
Chapter 1 was written with Miguel Artola and Luis Bauluz, and is titled “Wealth in Spain, 1900-2017: A Country of Two Lands”. In this chapter, we take a historical perspective and reconstruct Spain’s national wealth from 1900 to 2017. By combining
29 new sources with existing accounts, we estimate the wealth of both private and government sectors and use a new asset-specific decomposition of the long-run accumulation of wealth. We find that during the 20th century, the national wealth-to-income ratio remained within a relatively narrow range—between 400 and 600%— until the housing boom of the early 2000s led to an unprecedented rise to 800% in 2007. Our results highlight the importance of land, housing capital gains and international capital flows as key elements of wealth accumulation. This first chapter has been accepted for publication at The Economic Journal.
Chapter 2 was my Job Market Paper, and is called “House Price Cycles, Wealth Inequality and Portfolio Reshuffling”. Business cycle dynamics shape the wealth distribution through asset price changes, saving responses, or a combination of both. The aim of this chapter is to study the implications of housing booms and busts for wealth inequality, examining two episodes over the last four decades in Spain. I combine fiscal data with household surveys and national accounts to reconstruct the entire wealth distribution and develop a new asset-specific decomposition of wealth accumulation to disentangle the main forces behind wealth inequality dynamics (e.g., capital gains, saving rates). I find that the top 10% wealth share drops during housing booms, but the decreasing pattern reverts during busts. Differences in capital gains across wealth groups appear to be the main drivers of the decline in wealth concentration during booms. In contrast, persistent differences in saving rates across wealth groups and portfolio reshuffling towards financial assets among top wealth holders are the main explanatory forces behind the reverting evolution during housing busts. I show that the heterogeneity in saving responses is consistent with the existence of large differences in portfolio adjustment frictions across wealth groups and that tax incentives can exacerbate this differential saving behavior. These results provide novel empirical evidence to enrich macroeconomic theories of wealth inequality over the business cycle.
Chapter 3 was written with David Agrawal and Dirk Foremny, and is named “Para´ısos Fiscales, Wealth Taxation and Mobility”. Wealth taxation has received renewed attention as a revenue source to fund public programs and to curb wealth inequality. Yet, evidence on the behavioral responses to wealth taxes is relatively small and on migration responses to wealth taxes, in particular, almost non-existent. The goal of this chapter is to shed new light on this topic and study the effect of annual wealth taxes on migration. We analyze the unique decentralization of the Spanish wealth tax system following the reintroduction of the tax in 2011. Madrid is the only region that did not reintroduce the wealth tax. Using linked administrative wealth and income tax records, we exploit the quasi-experimental variation in tax
rates generated by the reform to understand the mobility responses of high wealth individuals and the resulting effect on wealth tax revenue and wealth inequality. Aggregating the individual data to the region-year-wealth tax filer level, we find that five years after the reform, the stock of wealthy individuals and the stock of wealth “residing” in the region of Madrid increased, respectively, by 11% and 12% relative to other regions prior to the reform. Using an individual choice model, we show that conditional on moving, Madrid’s zero tax rate increased the probability of changing one’s fiscal residence to Madrid by 24 percentage points. We show that Madrid’s status as a tax haven exacerbates regional wealth inequalities and erodes the effectiveness of raising tax revenue and curving wealth concentration.
Chapter 1
Wealth in Spain, 1900-2017: A
Country of Two Lands
Wealth is gaining increasing attention from both the academic community and public opinion. Large swings in asset prices and the significance of cross-border positions within the Eurozone—to name just two recent significant economic trends—point to the importance of studying wealth aggregates. Thus, constructing and strengthening national wealth statistics based on sectoral balance sheets has been the object of increasing attention from various institutions (Financial Stability Board and International Monetary Fund, 2009). In this sense, Spain is a country that clearly deserves international scholars’ attention. Since entering the Eurozone in the late 1990s, the Spanish economy underwent a large housing boom followed by an equally exceptionally large bust. The country also experienced a sharp deterioration in its net foreign asset position and a more recent rise in public indebtedness. Although academics and the media have been quick to analyse this process, the truth is that many studies are limited by the lack of a complete set of national balance sheets. Additionally, the absence of long-run series makes it more difficult to determine the historical significance of recent developments.
This study tracks for the first time the historical evolution of Spanish national wealth since the beginning of the twentieth century. Our aim is to analyse and document the long-term dynamics of wealth, with a particular focus on the evolution and determinants of the recent housing boom and bust. We present two long-run series. The first, based on a market value approach, provides the net wealth of the personal and government sector using a census method. Following this approach, we construct a complete and detailed balance sheet including nonfinancial, financial
and offshore assets. The second consists of a book value approach, in which national wealth is derived by calculating the value of domestically produced assets through the perpetual inventory method, valuing non-produced assets through a census-like method, and adding the net foreign position. One of the advantages of this last approach is that it allows us to decompose housing wealth into that of buildings and underlying land, which is key to understanding the forces that have driven up the value of dwellings in recent decades. To our knowledge, this study is the first to compare the evolution of both measures of national wealth over a period covering more than a century. Furthermore, we not only decompose the accumulation of national wealth into a volume effect (through savings) and a price effect (capital gains/losses) but also go beyond previous studies and differentiate between wealth accumulation in housing and non-housing assets.
Our main finding is that Spain’s national wealth-to-income ratio has followed a J-shaped evolution during the twentieth century that differs from the U-J-shaped trends
observed in other developed countries (Piketty and Zucman, 2014, Waldenstr¨om,
2017). Both the market- and book value-based national wealth-to-income ratios for Spain remained for most of its history in a relatively narrow range—between 400 and 600%—until the housing boom of the early 2000s led to an unprecedented rise of almost 800% in 2007. In this manner, Spain’s national wealth-to-income ratio level was the highest among all countries with available records since the beginning of the twentieth century. The singular evolution of wealth in Spain is explained by different peculiarities.
First, we document that the shift from high agricultural land value to high urban land value, which occurred in other advanced countries, was particularly fast in Spain. Agricultural land constituted the most important wealth component in the early twentieth century, while urban land value became the most important component in the early twenty-first century. Second, we also present evidence that in Spain, contrary to other rich countries, capital gains based on a sustained increase in the relative price of assets were fundamental for wealth accumulation during the very long term, especially since the 1950s. Our results point to housing as the most important driver, accounting for 80% and 82% of total capital gains over the 1950-2017 and 1980-1950-2017 periods, respectively. Third, Spain was heavily dependent on foreign finance since the late nineties; namely, its increase in net foreign liabilities was the largest among developed countries. We present new empirical evidence that illustrates how the private sector contributed to the large decrease in net foreign assets, most importantly through the issuance of debt securities by Spanish monetary institutions. This process in turn fostered an increase in household indebtedness and
1.1. LITERATURE REVIEW 33 an unprecedented housing boom. We perform an empirical analysis that supports the hypothesis that international capital flows were significantly related to housing prices in Spain during the 2000s, even after controlling for credit demand and financial conditions (in particular, declining interest rates and loosening credit standards). We observe that access to international credit by Spanish credit institutions seems to have played a significant role in the evolution of the real estate market in Spain. The rest of the paper proceeds as follows. Section II discusses previous studies examining other countries and Spain. In Section III, we briefly introduce the key concepts, methods, and sources being used. Section IV presents the most important long-term trends in the evolution of wealth aggregates and considers the Spanish case from an international perspective. In Section V, we perform a quantitative analysis that relates foreign capital flows with the growth in household credit and the evolution of the real estate market. Finally, Section VII concludes. This study is accompanied by a methodological appendix (Spain Wealth Appendix ), and the complete set of results is provided in an Excel file (Spain Wealth Database).
1.1
Literature review
1.1.1
Long-run evolution of national wealth
The study of wealth based on the national accounts framework is a relatively new phenomenon. National statistical offices did not start to compute national wealth through sectoral balance sheets until 1993, and progress thus far remains uneven: some countries provide very complete and long sets of national balance sheets, while others offer only partial results.
This slow development occurred despite research on wealth drawing increasing interest from scholars and the public. A major stimulus arose from the study of the evolution, composition, and distributional patterns of household wealth. J. B. Davies et al., 2011 estimated household wealth for 39 economies as of 2000 using sectoral balance sheets and survey data; the cited study was extended to 2000-2018 using the Global Wealth Report series edited by Shorrocks, J. Davies, and Lluberas, 2018. The other major impetus in wealth research originated from the studies by Piketty, 2014 and Piketty and Zucman, 2014. Piketty and Zucman, 2014 presented a new study of long-term dynamics of the wealth-to-income ratios for a set of advanced countries. The researchers’ key finding was that the relationship between wealth and income
was not stable over time. On the contrary, wealth-to-income ratios followed a strong U-shaped pattern over the twentieth century, most prominently in Europe. Together, these results have incentivized researchers to reconstruct the dynamics of national wealth in other countries while adopting a long-term perspective (Waldenstr¨om, 2017, Kumar, 2019).
In Spain, the first reliable estimate of the wealth stock was obtained by a group of researchers at the Universidad de Deusto, 1968, who performed an impressive wealth census for 1965 that covered all nonfinancial assets (agricultural land, housing, business assets, etc.) in great depth. In recent decades, the literature examining Spain grew impressively through new estimates of the capital stock (e.g., Mas Ivars, Perez Garc´ıa, and Uriel Jim´enez, 2000, Prados de la Escosura and J. R. Ros´es, 2010). The other major development occurred after the Bank of Spain began to develop a modern system of financial accounts. This set of results later incentivised the development of some complementary sources of data on wealth aggregates, such as various estimates of the value of residential buildings and the creation of the Survey of Household Finances in 2002. Using these records, Naredo, Carpintero, and Marcos, 2008 built the first comprehensive balance sheet for various institutional sectors in Spain from 1995 to 2007. These sources, however, are limited in terms of time coverage and wealth definition. Moreover, as we detail in the following section, some assets—most importantly, dwellings—are substantially overvalued. We go one step forward from previous estimates and provide for the first time a comprehensive dataset on Spanish wealth consistent with national accounts since 1900.
1.1.2
Determinants of the increase in housing prices since
the late 1990s
The recent rise in wealth to national income ratios has been mostly related to the increase in housing assets’ prices (Piketty and Zucman, 2014; Rognlie, 2014; Bonnet et al., 2014). This literature corresponds to scholars’ increasing interest in understanding the long-term evolution of housing markets (Davis and Heathcote, 2007; Knoll, Schularick, and Steger, 2017) and in particular, the recent rise in housing prices (Mankiw and Weil, 1989; Favara and Imbs, 2015; Saiz, 2010; Glaeser, Gyourko, and Saks, 2005; Gyourko, Mayer, and Sinai, 2013). Scholars have pointed to various underlying mechanisms, and many explanations seem to apply to the Spanish housing boom of the early 2000s. The first strand of the literature has focused on the positive impact of population increases on housing prices (Mankiw
1.2. CONCEPTS, METHODOLOGY, AND EMPIRICAL ESTIMATE 35 and Weil, 1989; Combes, Duranton, and Gobillon, 2019). In Spain, the increase in the foreign-born population—from 2% of the working-age population in 2000 to 14% in 2008—seems to be one of the principal causes of the increase in housing prices. Gonz´alez and Ortega, 2013 and Sanch´ıs-Guarner, 2017 quantify this effect and show that between one-third and one-half of the increase in housing prices during the 2000s is explained by foreigners arriving in Spain. A second set of studies have related changes in the credit market—through loose monetary conditions and soft lending standards—to the housing boom. For example, Jord`a, Schularick, and Taylor, 2015 show the causal relationship between loose monetary conditions and the rise in housing prices due to the expansion of mortgage credit. The authors argue that Spain during the 2000s is a fruitful subject for a case study to analyse, given the significant difference between the Taylor rule’s policy rate and the actual interest rate set by the ECB. Jim´enez et al., 2014 and Akin et al., 2014 also present evidence of too relaxed lending standards and excessive risk-taking by financial institutions during the recent Spanish housing boom.
Other scholars have emphasized the importance of foreign capital flows and
hous-ing booms (S´a, Towbin, and Wieladek, 2014), especially with regard to the USA
(Bernanke, 2005; Himmelberg, Mayer, and Sinai, 2005; Favilukis et al., 2012; Ferrero, 2015). However, research examining European countries has been more limited, with most analyses focusing on the Eurozone’s current account imbalances (Belke and Dreger, 2013), and the relationship between debt inflows and domestic credit growth (Hale and Obstfeld, 2016; Lane and McQuade, 2014). The literature on Europe has
hardly considered the impact on housing prices. In Spain, Fern´andez-Villaverde,
Garicano, and Santos, 2013 and Jimeno and Santos, 2014 have already highlighted the importance of foreign capital inflows to understanding the recent credit and real estate boom. Nonetheless, these studies only briefly document the importance of capital flows, and neither perform a detailed analysis of the channel nor quantify its importance. In Section V, we build upon the research of this last group of scholars and conduct a descriptive and quantitative analysis that relates foreign capital flows with the growth in household credit and the evolution of the real estate market.
1.2
Concepts, methodology, and empirical
esti-mate
In this study, we use the concepts of national income and wealth from the international system of national accounts (SNA 2008, ESA 2010). Wealth is calculated by providing,
for a particular point in time, a balance sheet that records the economic value of assets owned and liabilities owed by an institutional unit or group of units at prevailing market prices. At the country level, national wealth can be defined by two related but different measures. The first follows what Piketty and Zucman, 2014 call the market value of wealth, which is the sum of personal and government net wealth. In this definition, corporate capital is captured mostly by the market value of equity holdings owned by households and the government. This approach differs from SNA standards, which are referred to by Piketty and Zucman as the book value of wealth, i.e., the sum of nonfinancial assets of all resident sectors and the net foreign wealth. We reconstruct national wealth comprehensively by adopting these different per-spectives1. First, we compute national wealth at market value during 1900-2017 by
calculating the household and government net worth positions. For both sectors, we estimate financial wealth—financial claims net of liabilities—to which we add nonfi-nancial assets. Households’ nonfinonfi-nancial assets are decomposed into three categories: housing (that includes the value of both the structure and the underlying land), agricultural land, and unincorporated business assets other than agricultural land. Similarly, for the government sector, we decompose nonfinancial assets into produced assets (buildings and constructions, machinery and equipment), land underlying public buildings, and forest land owned by local authorities.
In this procedure, we follow the SNA recommendation that uses the census-like method as the best valuation technique. Values of agricultural land and housing, which clearly constitute the two most important asset components in the long run, are estimated by multiplying the observed quantities (land areas or housing stock) by representative unit prices. For each period, we gathered the most refined data on prices to consider variations due to regional differences and diversity of uses (e.g., differentiating by crop types in agriculture, or between price-regulated and non-regulated houses). Both wealth aggregates include the value of the underlying land and produced assets (cultivated crops and dwellings, respectively). For housing, we combine and adjust various available sources (Bank of Spain, IVIE, and the Ministry of Public Works) of data on housing prices to produce a more accurate estimate. We perform thorough robustness checks for our housing wealth series, considering all other possible sources and methods. In particular, we compare our series to available estimates by Naredo, Carpintero, and Marcos, 2008, P´erez and Uriel, 2012, Bank of
1In this section, we briefly summarize our approach. The appendix provides a thorough and
more detailed discussion of the sources, concepts and methodology used to reconstruct our wealth series between 1900 and 2017. We also include therein several robustness checks we have performed to prove the reliability of our series.
1.2. CONCEPTS, METHODOLOGY, AND EMPIRICAL ESTIMATE 37
Spain and J. Carmona, Lampe, and J. Ros´es, 2014. We also consider Spain from an
international perspective, using the house price series in Jord`a, Knoll, et al., 2019 and the housing wealth series from household wealth surveys. Overall, regardless of which source or method we use, the trends and levels in housing wealth are broadly similar.
Values of nonfarm unincorporated business assets owned by the household sector are estimated by taking as a starting point the results of the Survey of Household Finances available for 2002-2014 and subsequently upgrading the declared values to account for undervaluation and top-coding. We extend the results until the early 1980s by assuming the evolution to be similar to that of assets of nonfinancial corporations. For the public sector, we use the series of Mas Ivars, P´erez Garc´ıa, et al., 2015 for government-produced assets and add the value of the underlying land and forests.
In the second step, we compute the net financial wealth for the public, personal, and foreign sectors since the early twentieth century. For all three sectors, reconstructing financial assets and liabilities from 1970 to the present is a straightforward exercise based on figures reported in Financial Accounts by the Bank of Spain. Our main addition, as we detail below, is to provide the first complete estimate of offshore wealth owned by Spanish households. Producing a consistent estimate for the rest of the twentieth century is a far more complex process, given the lack of official estimates. Our calculations for the personal sector are based on a two-stage approach. First, we calculate the aggregate market value of each asset type, which is simpler for claims (e.g., currency, deposits and loans) assessed at their nominal value than for assets (e.g., bonds and shares) that are valued at the prevailing market prices.2 The second step involves computing the share of each asset owned by households, deducting the holdings of other institutional sectors—mostly corporations or the government—using a wide variety of auxiliary accounts (e.g., financial yearbooks, balance sheets of banking and insurance companies, and government accounts). Estimates for the government sector before 1970 are much easier to obtain. We proxy public net financial wealth by computing the value of the asset side of all state-owned equity holdings (e.g., the public railway company RENFE) and deducting as liabilities the market values of public debt. Computing Spain’s net foreign wealth prior to 1970 cannot be performed through the census-like method, given the scarcity of sources;
2Corporate shares are the assets with the value that is most sensitive to changes in market
prices. Listed shares have been valued according to stock market prices, while the values of unlisted shares have been derived by applying similar valuation ratios and subsequently applying a 20% discount for illiquidity.
therefore, we calculate the current account balance and add the variation in foreign exchange reserves. This procedure is relatively widespread since a surplus in the current account makes a country a net creditor to the rest of the world, and vice versa. We perform one final correction by accounting for households’ offshore wealth. We construct our series following the methodology of Zucman, 2013 in combination with aggregate tax records on foreign holdings by Spanish residents. Nonetheless, due to the uncertainties related to these calculations, we do not include offshore assets in our benchmark series and present them only when decomposing total financial assets and the net foreign asset position.
Following a different approach, we compute the book value of national wealth for 1900-2017 by aggregating all types of nonfinancial assets in the Spanish economy, to which we add the net foreign wealth. The estimate is obtained regardless of the sector owning these assets. We decompose them into the following groups: agricultural land, housing, subsoil assets, non-residential constructions, machinery and equipment, transport equipment, and inventories. The values of the first two are calculated through the census approach, as noted previously, and produced assets are valued using the perpetual inventory method (PIM). We are not the first to use the PIM to reconstruct the stock of produced assets in Spain, and we benefited greatly from previous analyses (e.g., Prados de la Escosura and J. R. Ros´es, 2010, Mas Ivars, Perez Garc´ıa, and Uriel Jim´enez, 2000, Mas Ivars, P´erez Garc´ıa, et al., 2015). However, our estimates are slightly different, as we use geometric patterns of depreciation, and include the most recent data on Spain’s historical national accounts from Prados de la Escosura, 2017. We also go one step further by decomposing the value of housing and non-residential buildings between structures and the underlying land. We do so by following the residual approach, as detailed in Eurostat and OECD, 2015 and used in Davis and Heathcote, 2007 for the US housing stock during 1930-2000. Using this method, we calculate the value of land as a residual by deducting the PIM estimates of the values of residential structures from the market value of the housing stock. Estimates of produced assets’ values are sensitive to assumptions on depreciation rates and, therefore, so is the land residual. We use the depreciation pattern that puts us closest to official national accounts. In the appendix, we show that using substantially higher or lower depreciation rates does not alter in a significant manner the results of this paper3.
3The only assets that cannot be valued by either the census-like estimate or the perpetual
inventory method are mineral reserves. We estimate their values through the net price method, which is a second-best procedure. However, given the low levels of natural resources in Spain (e.g., the value-added share of extractive industries has been always below 2% of GDP), any inaccuracy should have a negligible effect on the top-line estimates of national wealth.
1.2. CONCEPTS, METHODOLOGY, AND EMPIRICAL ESTIMATE 39 Finally, from 1995 onwards, we also calculate the book value of national wealth using a second definition that computes the balance sheet of corporations—both financial and nonfinancial entities—and adding their net wealth to the market value definition of the national wealth. Data on corporate nonfinancial assets is derived from the Central Balance Sheet Data Office of the Bank of Spain.
In addition to building sectoral balance sheets and various measures of national wealth, we also present a decomposition of the accumulation of national wealth into a volume effect (through savings) and a price effect (through capital gains or losses) in both multiplicative and additive forms. We do this by following the methodology proposed by Piketty and Zucman, 2014 in the appendix to the cited paper, which relates the accumulation of national savings to the evolution of national wealth and obtains the capital gains component as a residual.
However, we also go one step further and perform the same decomposition for housing and non-housing wealth separately, therefore disentangling the influence of various wealth subcomponents in the aggregate. To this end, we start from the definition of national wealth as the sum of the value of domestic nonfinancial assets and the net
foreign wealth, WN = AN F + N F W , which we further decompose into housing and
non-housing wealth, WN = WH + WN H. In this expression, housing wealth is the
market value of dwellings, while non-housing wealth is the sum of values of other types of capital and the net foreign wealth. Similarly, we decompose national saving
into domestic investment (net of depreciation) and foreign saving, SN = I + SF,
which we then decompose into housing investment and non-housing national saving, SN = SH + SN H. Consequently, each component of national saving is mapped to its
corresponding component in the national wealth.
We consider the multiplicative and additive accumulation models (equations 1.1 and 3.4, respectively) separately for each of these two components of national wealth. Between two given years (t and t + 1), these decompositions can be specified as follows:
Wt+1i = (Wti+ Sti)(1 + qit) (1.1)
Wt+1i = Wti+ Sti+ KGit (1.2)
where i stands for housing or non-housing components of national wealth (W ) and national saving (S). In addition, (1 + qt) and KGt are the residual components that