Annals of Oncology 24: 193–201, 2013 doi:10.1093/annonc/mds209 Published online 11 September 2012
A new diagnostic algorithm for Burkitt and diffuse
large B-cell lymphomas based on the expression
of CSE1L and STAT3 and on MYC rearrangement
predicts outcome
D. Soldini
1,†, C. Montagna
1,†, P. Schüf
fler
2, V. Martin
3, A. Georgis
1, T. Thiesler
1,
A. Curioni-Fontecedro
4, P. Went
5, G. Bosshard
1, S. Dehler
6, L. Mazzuchelli
3& M. Tinguely
1*
1
Institute of Surgical Pathology, University Hospital Zurich;2
Department of Computer Science, ETH Zurich, Zurich;3
Institute of Pathology, Locarno;4
Department of Oncology, University Hospital Zurich, Zurich;5
Institute of Pathology, Town Hospital Triemli, Zurich;6
Cancer Registry, Institute of Surgical Pathology, University Hospital Zurich, Zurich, Switzerland
Received 29 March 2012; revised 22 May 2012; accepted 30 May 2012
Background:
Aggressive mature B-cell non-Hodgkin’s lymphomas (BCL) sharing features of Burkitt’s lymphoma (BL) and diffuse large B-cell lymphoma (DLBCL) (intermediate BL/DLBCL) but deviating with respect to one or more characteristics are increasingly recognized. The limited knowledge about these biologically heterogeneous lymphomas hampers their assignment to a known entity, raising incertitude about optimal treatment approaches. We therefore searched for discriminative, prognostic, and predictive factors for their better characterization.Patients and methods:
We analyzed 242 cytogenetically defined aggressive mature BCL for differential protein expression. Marker selection was based on recent gene-expression profile studies. Predictive models for diagnosis were established and validated by a different set of lymphomas.Results:
CSE1L- and inhibitor of DNA binding-3 (ID3)-overexpression was associated with the diagnosis of BL and signal transduction and transcription-3 (STAT3) with DLBCL (P < 0.001 for all markers). All three markers were associated with patient outcome in DLBCL. A new algorithm discriminating BL from DLBCL emerged, including the expression of CSE1L, STAT3, and MYC translocation. This‘new classifier’ enabled the identification of patients with intermediate BL/DLBCL who benefited from intensive chemotherapy regimens.Conclusion:
The proposed algorithm, which is based on markers with reliable staining properties for routine diagnostics, represents a novel valid tool in separating BL from DLBCL. Most interestingly, it allows segregating intermediate BL/DLBCL into groups with different treatment requirements.Key words: algorithm, BL, CSE1L, DLBCL, ID3, STAT3
introduction
Accurate diagnosis of aggressive mature B-cell non-Hodgkin's
lymphomas (BCL) is mandatory for the choice of an optimal
treatment approach. In particular, the distinction of Burkitt
’s
lymphoma (BL) from diffuse large B-cell lymphoma (DLBCL)
entails important prognostic and therapeutic implications.
Although both the entities are treated with curative intent,
different regimens are applied: most patients with DLBCL are
treated with rituximab plus cyclophosphamide,
hydroxydaunorubicin/doxorubicin, oncovin/vincristine and
prednisone (R-CHOP) chemotherapy, whereas a more
intensive chemotherapy (e.g. Hyper-cyclophosphamide,
vincristine, adriamycin/doxorubicin, dexamethasone) is
applied for the treatment of BL.
The de
finition of these two entities incorporates clinical
information, histomorphology, immunohistochemistry, as well
as genetic alterations including BCL2, BCL6, and MYC
translocations. With the advancement of molecular testing
widely applicable to formalin-
fixed, paraffin-embedded tissues,
lymphomas with overlapping morphological and genetic
features of both BL and DLBCL are increasingly recognized. In
the current World Health Organization (WHO) classification,
they are classi
fied as ‘B-cell lymphoma, unclassifiable, with
features intermediate between DLBCL and BL
’ (intermediate
BL/DLBCL) [
1
]. The inherent complexity of this ill-defined
group is re
flected by their very heterogeneous nature,
†These authors contributed equally to this work.
*Correspondence to: Dr M. Tinguely, Institute of Surgical Pathology; University Hospital Zurich; Schmelzbergstrasse 12; CH-8091 Zurich, Switzerland. Tel: +41-44-255-47-24; Fax: +41-44-255-44-16; E-mail: [email protected]
© The Author 2012. Published by Oxford University Press on behalf of the European Society for Medical Oncology. All rights reserved. For permissions, please email: [email protected].
comprising among others, double-hit lymphomas with MYC
aberration, with a particularly negative prognostic impact
[
2
,
3
]. From the clinical point of view, a major issue regarding
this aggressive group of lymphomas is the lack of an optimal
treatment approach, and all attempts to define the borders of
intermediate BL/DLBCL with known diagnostic markers, such
as CD10, MUM1, Bcl2, Bcl6 protein expression or FISH for
BCL2, BCL6 and MYC, remained unsatisfactory so far [
1
,
3
,
4
].
Therefore, the purpose of this study is to
find additional
diagnostic and predictive markers in order to further
characterize aggressive mature BCL, with particular regard to
intermediate BL/DLBCL. Based on the reported
gene-expression profiling studies, which in the recent years were
found to be an accurate method to distinguish BL from
DLBCL, we analyzed the expression of three genes
[chromosome segregation 1-like (CSE1L), inhibitor of DNA
binding-3 (ID3), and signal transduction and transcription-3
(STAT3)] on a tissue micro array (TMA) [
5
,
6
].
CSE1L is implicated in the nuclear-to-cytoplasmic traf
ficking
of importin-alpha relevant for the nuclear transport of several
proliferation-associated proteins, oncogenes, and tumor
suppressor genes, such as p53. Although CSE1L was shown to
be overexpressed in various carcinomas [
7
] and melanomas
[
8
], few studies have reported high expression in high-grade
B-NHL when compared with low-grade B-NHL [
9
], primary
cutaneous B-cell lymphomas [
10
], or acute myeloid leukemias
[
11
]. ID3 belongs to the inhibitor of DNA binding (ID) family
of proteins which negatively regulate basic helix–loop–helix
transcription factors known as E-proteins and control many
aspects of lymphocyte proliferation, differentiation, and
survival [
12
]. ID family proteins have been shown to be
overexpressed in several solid tumors [
13
]; however, very little
is known about the role of ID3 in human lymphomas [
14
,
15
].
Finally, STAT3 belongs to the signal transduction and
transcription (STAT) family of transcription factors and binds
to interleukin (IL)-6 and IL-10 responsive elements. In cell
culture assays, both cytokines and STAT3 were shown to be
expressed by non-germinal-center-B-cell (non-GCB)-derived
DLBCL cells. Moreover, a signature of STAT3 target genes
typifies a subset of non-GCB DLBCL tumor cells with high
STAT3 protein levels [
16
].
We investigated a cohort of 242 aggressive mature BCL for
the expression of the mentioned markers CSE1L, ID3, and
STAT3 on a TMA. Their diagnosis was initially established by
morphology with the support of known immunophenotypical,
and genetic markers. In a univariate analysis, all the three
new markers were able to signi
ficantly discriminate BL from
DLBCL, and their expression correlated with survival. Through
computational analysis, we developed a new algorithm for
aggressive mature BCL based on the combination of CSE1L
and STAT3 expression with MYC rearrangement by FISH,
which was superior in predicting the diagnosis of BL and
DLBCL than previous marker combinations. Finally, the use of
this algorithm appears to be of predictive value regarding the
therapeutic response. Based on these data, we propose the use
of these new markers as an additional diagnostic and predictive
tool, which, however, needs to be analyzed prospectively on a
larger number of cases before eventually being included in the
routine diagnostic procedures.
patients and methods
patients and biopsy specimen selection
A total of 288 patients with aggressive mature BCL diagnosed from 1990 to 2009 at the Institute of Surgical Pathology, University Hospital Zurich as well as 10 BL cases derived from an affiliated hospital (Town Hospital Triemli) in Zurich were included in the study. Twenty-three additional BL or DLBCL cases collected during 2010 were used successively to validate the diagnostic algorithm. All lymphomas were reviewed independently by two pathologists (DS and MT) and diagnosed, according to the current WHO 2008 classification [1] as outlined in the supplementary data. DLBCL were further subclassified into GCB and non-GCB types, according to the Hans algorithm [17].
This study was in accordance with Swiss laws and approved by the official authorities of the ethical committee of the Canton Zurich (StV2-2007).
treatment protocol
According to thefirst-line chemotherapy used after the histological diagnosis, four therapeutic groups were established (for details, see supplementary data). The‘first’ group (89 patients) consisted of ‘CHOP-like’ regimens, the ‘second’ group (16 patients) consisted of ‘intensive’ regimens, the‘third’ group (6 patients) comprised vincristine, adriamycin/ doxorubicin, cyclophosphamide, etoposide, and prednisone (VACOP), and the‘fourth’ group (6 patients) comprised ‘low-intensity’ regimens chlorambucil and prednisolone [18]. Each group was further subclassified
according to the use of rituximab.
immunohistochemistry
Based on gene-expression profiling [5,6], we searched for reported genes significantly overexpressed in either BL or DLBCL and selected the commercially available antibodies specific for CSE1L, ID3, and STAT3 which showed the best staining performance and reproducibility in normal and neoplastic lymphatic tissues. For antibodies used and their evaluation see supplementary Table S1, available at Annals of Oncology online. Immunohistochemistry on 2.5-μm-thick TMA sections was carried out using a Ventana ES instrument (Roche’s Ventana Medical Systems, Baar, Switzerland) according to the standard protocols.
western blotting
Protein extracts from human BL-derived Raji cells were subjected to Western blotting analysis. An anti-β-actin (mouse monoclonal, clone AC-15, code A5441, Sigma-Aldrich, Hamburg, Germany) antibody was used as a control for protein loading. (supplementary Figure S1, available at Annals of Oncology online).
fluorescence in situ hybridization (FISH)
FISH analysis was carried out as previously described [19,20] and evaluated by a cytogenetist (VM) who was blinded to the clinical evaluation and remaining results. See supplementary Table S2, available at Annals of Oncology online for probes used.diagnostic algorithm for decision trees
and their validation
Computational analysis of the protein expression data lead to predictive models for the diagnosis of interest. We chose binary decision trees, as these easily handle missing values of the predictor variables and have already been used in this context [17,21]. Several binary decision trees for the classification of BL versus DLBCL were trained with different datasets composed of protein expression and FISH results as predictor variables. The
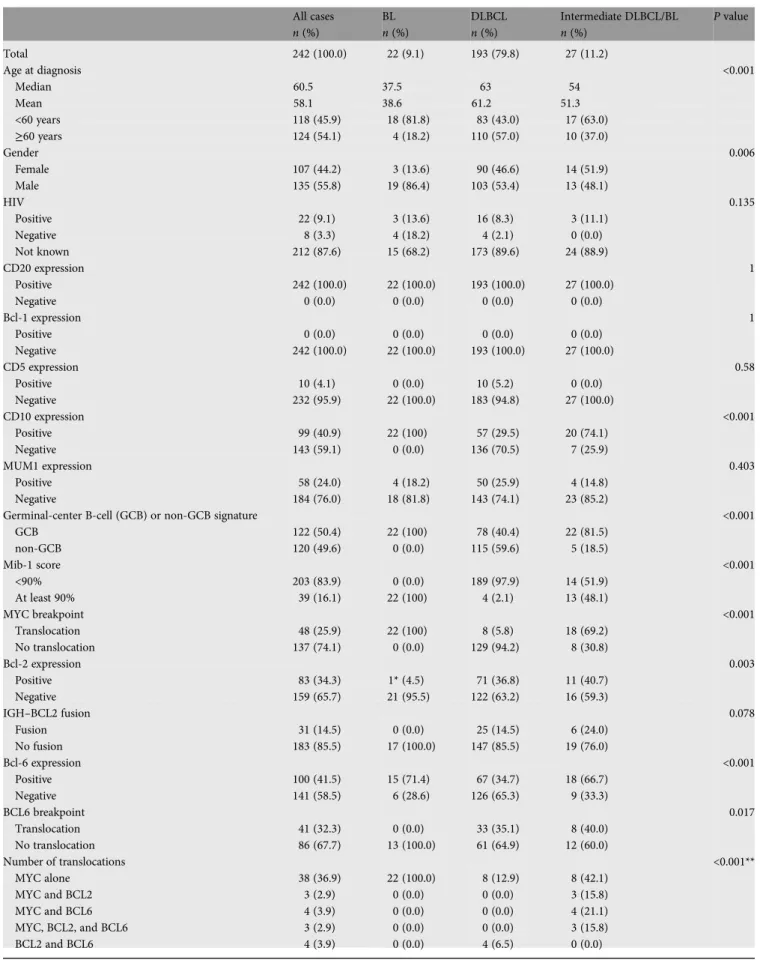
Table 1. Immunohistochemical and genetic characteristics of all cases All cases n (%) BL n (%) DLBCL n (%) Intermediate DLBCL/BL n (%) P value Total 242 (100.0) 22 (9.1) 193 (79.8) 27 (11.2) Age at diagnosis <0.001 Median 60.5 37.5 63 54 Mean 58.1 38.6 61.2 51.3 <60 years 118 (45.9) 18 (81.8) 83 (43.0) 17 (63.0) ≥60 years 124 (54.1) 4 (18.2) 110 (57.0) 10 (37.0) Gender 0.006 Female 107 (44.2) 3 (13.6) 90 (46.6) 14 (51.9) Male 135 (55.8) 19 (86.4) 103 (53.4) 13 (48.1) HIV 0.135 Positive 22 (9.1) 3 (13.6) 16 (8.3) 3 (11.1) Negative 8 (3.3) 4 (18.2) 4 (2.1) 0 (0.0) Not known 212 (87.6) 15 (68.2) 173 (89.6) 24 (88.9) CD20 expression 1 Positive 242 (100.0) 22 (100.0) 193 (100.0) 27 (100.0) Negative 0 (0.0) 0 (0.0) 0 (0.0) 0 (0.0) Bcl-1 expression 1 Positive 0 (0.0) 0 (0.0) 0 (0.0) 0 (0.0) Negative 242 (100.0) 22 (100.0) 193 (100.0) 27 (100.0) CD5 expression 0.58 Positive 10 (4.1) 0 (0.0) 10 (5.2) 0 (0.0) Negative 232 (95.9) 22 (100.0) 183 (94.8) 27 (100.0) CD10 expression <0.001 Positive 99 (40.9) 22 (100) 57 (29.5) 20 (74.1) Negative 143 (59.1) 0 (0.0) 136 (70.5) 7 (25.9) MUM1 expression 0.403 Positive 58 (24.0) 4 (18.2) 50 (25.9) 4 (14.8) Negative 184 (76.0) 18 (81.8) 143 (74.1) 23 (85.2)
Germinal-center B-cell (GCB) or non-GCB signature <0.001
GCB 122 (50.4) 22 (100) 78 (40.4) 22 (81.5) non-GCB 120 (49.6) 0 (0.0) 115 (59.6) 5 (18.5) Mib-1 score <0.001 <90% 203 (83.9) 0 (0.0) 189 (97.9) 14 (51.9) At least 90% 39 (16.1) 22 (100) 4 (2.1) 13 (48.1) MYC breakpoint <0.001 Translocation 48 (25.9) 22 (100) 8 (5.8) 18 (69.2) No translocation 137 (74.1) 0 (0.0) 129 (94.2) 8 (30.8) Bcl-2 expression 0.003 Positive 83 (34.3) 1* (4.5) 71 (36.8) 11 (40.7) Negative 159 (65.7) 21 (95.5) 122 (63.2) 16 (59.3) IGH–BCL2 fusion 0.078 Fusion 31 (14.5) 0 (0.0) 25 (14.5) 6 (24.0) No fusion 183 (85.5) 17 (100.0) 147 (85.5) 19 (76.0) Bcl-6 expression <0.001 Positive 100 (41.5) 15 (71.4) 67 (34.7) 18 (66.7) Negative 141 (58.5) 6 (28.6) 126 (65.3) 9 (33.3) BCL6 breakpoint 0.017 Translocation 41 (32.3) 0 (0.0) 33 (35.1) 8 (40.0) No translocation 86 (67.7) 13 (100.0) 61 (64.9) 12 (60.0) Number of translocations <0.001** MYC alone 38 (36.9) 22 (100.0) 8 (12.9) 8 (42.1) MYC and BCL2 3 (2.9) 0 (0.0) 0 (0.0) 3 (15.8) MYC and BCL6 4 (3.9) 0 (0.0) 0 (0.0) 4 (21.1) MYC, BCL2, and BCL6 3 (2.9) 0 (0.0) 0 (0.0) 3 (15.8) BCL2 and BCL6 4 (3.9) 0 (0.0) 4 (6.5) 0 (0.0) Continued
Table 1. Continued All cases n (%) BL n (%) DLBCL n (%) Intermediate DLBCL/BL n (%) P value BCL6 alone 30 (29.1) 0 (0.0) 29 (46.8) 1 (5.3) BCL2 alone 21 (20.4) 0 (0.0) 21 (33.9) 0 (0.0)
EBER (in situ) 0.02
Positive 17 (7.1) 5 (23.8) 11 (5.8) 1 (3.7)
Negative 222 (92.9) 16 (76.2) 180 (94.2) 26 (96.3)
Percentages were calculated on the basis of the number of evaluable cases (or on the basis of the total number of cases showing at least one translocation). Percentages may not total 100 because of rounding.
P values were calculated using Fisher’s exact test (or the chi-square test, for **) and refer to differences between the BL, DLBCL and intermediate BL/DLBCL cases.
The expression of CD20, CyclinD1, CD5, CD10, MUM1, Mib-1, Bcl-2, and Bcl-6 was determined by immunohistochemical analysis. The MYC and BCL6 breakpoints and the IGH-BCL2 fusions were analyzed by interphasefluorescence in situ hybridization (FISH). *Weak intensity (Bcl2 expression).
BL, Burkitt’s lymphoma; DLBCL, diffuse large B-cell lymphoma.
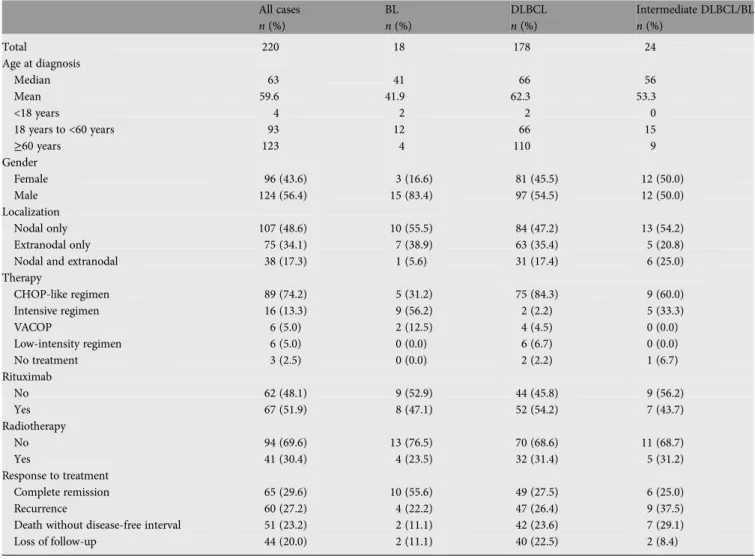
Table 2. Clinical characteristics of the patients
All cases n (%) BL n (%) DLBCL n (%) Intermediate DLBCL/BL n (%) Total 220 18 178 24 Age at diagnosis Median 63 41 66 56 Mean 59.6 41.9 62.3 53.3 <18 years 4 2 2 0 18 years to <60 years 93 12 66 15 ≥60 years 123 4 110 9 Gender Female 96 (43.6) 3 (16.6) 81 (45.5) 12 (50.0) Male 124 (56.4) 15 (83.4) 97 (54.5) 12 (50.0) Localization Nodal only 107 (48.6) 10 (55.5) 84 (47.2) 13 (54.2) Extranodal only 75 (34.1) 7 (38.9) 63 (35.4) 5 (20.8)
Nodal and extranodal 38 (17.3) 1 (5.6) 31 (17.4) 6 (25.0)
Therapy CHOP-like regimen 89 (74.2) 5 (31.2) 75 (84.3) 9 (60.0) Intensive regimen 16 (13.3) 9 (56.2) 2 (2.2) 5 (33.3) VACOP 6 (5.0) 2 (12.5) 4 (4.5) 0 (0.0) Low-intensity regimen 6 (5.0) 0 (0.0) 6 (6.7) 0 (0.0) No treatment 3 (2.5) 0 (0.0) 2 (2.2) 1 (6.7) Rituximab No 62 (48.1) 9 (52.9) 44 (45.8) 9 (56.2) Yes 67 (51.9) 8 (47.1) 52 (54.2) 7 (43.7) Radiotherapy No 94 (69.6) 13 (76.5) 70 (68.6) 11 (68.7) Yes 41 (30.4) 4 (23.5) 32 (31.4) 5 (31.2) Response to treatment Complete remission 65 (29.6) 10 (55.6) 49 (27.5) 6 (25.0) Recurrence 60 (27.2) 4 (22.2) 47 (26.4) 9 (37.5)
Death without disease-free interval 51 (23.2) 2 (11.1) 42 (23.6) 7 (29.1)
Loss of follow-up 44 (20.0) 2 (11.1) 40 (22.5) 2 (8.4)
Percentages were calculated on the basis of the number of cases with available information. The omission of cases without clinical information explains the difference in‘age at diagnosis’ and ‘gender’ existing between Tables1and2. Percentages may not reach a total of 100 because of rounding.
BL, Burkitt’s lymphoma; DLBCL, diffuse large B-cell lymphoma.
resulting decision trees were compared by their misclassification error of 100-fold bootstrapped cross-validation. The validation of the decision trees was carried out using a separate group of 23 new lymphomas, for which the same immunohistochemical and FISH analysis were carried out as in the initial cohort. This validation cohort was evaluated as before by a cytogeneticist (VM) and an assessor (CM) who were blinded to the diagnosis.
clinical data and survival analysis
The following patient characteristics were collected: age at diagnosis, gender, lymphoma site, and therapeutic strategy. The response to treatment and the occurrence of relapse or death was recorded. The Kaplan–Meier method was used to estimate overall (OS) and progression-free survival (PFS) (see supplementary data, available at Annals of Oncology online for definition).
The log-rank test, stratified by the diagnostic group, was used to compare the survival distributions. The differences between the strata were tested with the chi-square test.
results
patients and diagnosis
Out of the 288 biopsies, 242 ful
filled the requirement for
further analysis with a minimum of 30% of tumor cells on the
tissue core. Of these, 22 were classified as BL, 193 as DLBCL,
and 27 as intermediate BL/DLBCL. Clinical data were available
for 220 patients (18 BL, 178 DLBCL, and 24 intermediate BL/
DLBCL). The mean follow-up was 5.2 years for BL patients,
4.3 years for DLBCL patients, and 3.3 years for intermediate
BL/DLBCL patients. A summary of the characteristics of
tumors and patients is presented in Tables
1
and
2
.
expression of CSE1L, ID3, and STAT3 in normal
lymphatic tissues and in human BL-derived
raji cells
The specificity of these antibodies was confirmed in a Western
blot analysis (supplementary Figure S1, available at Annals of
Oncology online).
In non-neoplastic tissue, CSE1L and ID3 were
predominantly expressed in GCB cells, whereas STAT3 was
expressed in cells of the inter-follicular area (Figure
1
).
expression of CSE1L, ID3, and STAT3 in BL, DLBCL
and intermediate BL/DLBCL
A univariate analysis revealed a statistically signi
ficant
differential expression of CSE1L, ID3, and STAT3 in BL
Figure 1. Results of immunohistochemical markers. ’CSE1L’ in reactive lymphoid tissue at (A) low (20×) and (B) high power (40×) magnification with predominant, cytoplasmic reactivity in germinal-center dark cells and less strong in the light zone, but not in mantle zone cells or extra-follicular area. Examples (40×) of both (C) Burkitt’s lymphoma (BL) and (D) diffuse large B-cell lymphoma (DLBCL). Inhibitor of DNA binding-3 (ID3) in reactive lymphoid tissue at (E) low and (F) high power magnification with nuclear reactivity in both germinal-center and mantle zone cells. Lymphoma examples of both (G) BL and (H) DLBCL. Signal transduction and transcription-3 (STAT3) in reactive lymphoid tissue at (I) low and (J) high power with only few cells with cytoplasmic reactivity, mainly in the extra-follicular area. Examples of samples of both (K) BL and (L) DLBCL.
versus DLBCL (Figure
1
). CSE1L and ID3 were both found to
be more frequently expressed in BL than in DLBCL (for both P
< 0.001). STAT3, instead, was more frequently expressed in
DLBCL (P < 0.001), in particular more often in the non-GCB
than in the GCB subgroup (P < 0.001). For summary, see
supplementary Table S3, available at Annals of Oncology online.
survival analysis and correlation with marker
expression
For 220 patients, follow-up was available. Twenty-nine percent
of them relapsed and 23% of the patients had no disease-free
interval (supplementary Table S4, available at Annals of
Oncology online).
Overall, univariate survival analysis showed that ID3-positive
patients had significantly longer OS and PFS than ID3-negative
patients (P = 0.020, with 5-year OS of 63.5% versus 44.7%;
P = 0.033, with 5-year PFS of 56.3% versus 36.8%), and CSE1L
expression was associated with longer PFS (P = 0.044, with
5-year PFS of 61.0% versus 40.1%). Finally, considering only
the group of DLBCL, the expression of STAT3 was associated
with longer OS (P = 0.052, with 5-year OS of 53.0% versus
38.4%) and PFS (P = 0.023; with 5-year PFS of 44.7% versus
30.7%). Neither OS (P = 0.920) nor PFS (P = 0.796) differed in
GCB versus non-GCB assessed by Hans classi
fier.
diagnostic classi
fiers for BL and DLBCL
In order to evaluate whether the
‘combined’ expression of
CSE1L, ID3, and STAT3 enhances diagnostic precision, we
made use of binary decision trees to predict diagnosis. As this
computational approach is based on a binary system, the group
of insuf
ficiently defined intermediate BL/DLBCL was omitted,
and decision trees were trained to predict the diagnosis of either
BL or DLBCL. Different combination sets with the expression of
new markers, CSE1L, ID3, and STAT3, of conventional markers
(CD10, MUM1, Bcl-2, and Bcl-6), as well as FISH results for
BCL2, BCL6 and MYC translocations were introduced into the
algorithm, which in turn selected the markers to build the best
decision trees, also called classi
fiers (Figure
2
).
From all different combinations of datasets applied, the
algorithm selected STAT3 and CSE1L expression, as well as
MYC translocation to build the decision tree with the highest
performance. This decision tree, which we called
‘new
classi
fier’, showed the lowest misclassification error of 8.7%
[standard deviation (SD) = 5.6% in 100-fold bootstrapped
cross-validation with a random level of 50.0% as balanced
error] (see Figure
3
for all different classi
fiers).
validation of the new classi
fier
The validation of a predictive decision tree must be carried out
using a different set of cases than the ones used for their
training, and consists in the comparison of the original
diagnosis with the one predicted by the decision tree. For this
purpose, 23 additional aggressive mature BCL cases (5 BL and
18 DLBCL) recently diagnosed at the University Hospital
Zurich were employed. The
‘new classifier’ predicted a correct
diagnosis in all BL and DLBCL cases, with a sensitivity and
speci
ficity of 100% (see supplementary Table S5, available at
Annals of Oncology online).
impact of the new classi
fier on diagnosis and
prognosis, in particular for the intermediate BL/
DLBCL group of lymphomas
We
first added the whole cohort with all three lymphoma types
including intermediate BL/DLBCLs to the training set, as the
Figure 2. Decision trees trained to predict the diagnosis of either Burkitt’s lymphoma (BL) or diffuse large B-cell lymphoma (DLBCL) with different sets of markers and FISH results (n = 248). The‘conventional classifier without FISH data’ resulted when all conventional markers (CD10, MUM1, Bcl-2, and Bcl-6) were submitted to the algorithm. When the FISH data (BCL2, BCL6, and MYC translocations) were in addition applied, the algorithm chose the expression of CD10 and the data of FISH for MYC to build the‘conventional classifier with FISH data’. When the expression of new markers CSE1L, inhibitor of DNA binding-3 (ID3), and signal transduction and transcription-3 (STAT3) as well as conventional markers were submitted to the binary decision tree, only two new markers CSE1L and STAT3 were selected to build an algorithm, called‘classifier without FISH data’. Finally, the decision tree with the highest performance resulted when all (conventional and new) markers in addition to FISH data were applied. This‘new classifier’ was composed of the data of the expression of CSE1L and STAT3 and of the FISH data for MYC.
latter were excluded from the initial set. Over the whole cohort,
six DLBCL cases were reclassi
fied as predicted BL (pBL) and
two BL cases as predicted DLBCL ( pDLBCL). By running the
‘new classifier’ over the intermediate BL/DLBCL group only,
13/27 lymphomas were predicted as BL ( pBL) and 14/27 as
DLBCL ( pDLBCL). Interestingly, none of the pBL cases
showed MUM1 expression, in contrast to four positive (28.6%)
pDLBCL cases. GCB phenotype was present in 12/13 (92.3%)
pBL cases and 10/14 (71.4%) pDLBCL cases. All pBL carried a
MYC translocation (in contrast to 6/14 pDLBCL) and seven of
them presented with a simple karyotype (only 1/14 pDLBCL).
Both the groups presented
five cases with triple or double hits
each. Finally, STAT3 expression was more frequent in the
pDLBCL (71.4%) than in the pBL (7.7%) group.
We next analyzed the in
fluence of the new classifier on
prognosis. We compared OS and PFS of predicted groups
receiving an intensive therapy versus CHOP-like therapy with
or without rituximab, as these two therapeutic groups
represented >90% of all therapeutic approaches in our cohort.
Regarding all lymphoma subtypes, the
‘new classifier’ identified
patients with pBL showing a signi
ficantly longer cumulative OS
and PFS when treated with intensive therapy than pBL treated
with CHOP-like therapy, with or without rituximab (P = 0.015
and P = 0.007, respectively) (Figure
4
A). When the predicted
diagnoses were compared with the initial ones, the prognosis
for 4/6 pBL patients initially diagnosed as DLBCL was dismal
(no disease-free interval and disease-related death occurring
0.5, 1.2, 1.8, and 13.9 months after diagnosis). The therapeutic
approach was known in one case (R-CHOP, 1.2 months
survival). The remaining 2 pBL recurred after 22.56 and 77.5
months, respectively, and were treated with R-CHOP
chemotherapy. The two cases reclassified as pDLBCL,
originally diagnosed as BL, had an indolent course (recurrence
after 81 months, no recurrence after 192 months). Of note,
reclassified lymphomas presented with features otherwise
indistinguishable from the rest of the original diagnostic group.
Finally, the predictive value of the
‘new classifier’ was also
evident when applied to the intermediate BL/DLBCL. In
particular, the
‘new classifier’ was able to predict a significantly
longer OS and PFS in pBL treated with intensive regimen
compared with pBL treated with CHOP-like regimens, with or
without rituximab (P = 0.040 for both OS and PFS, clinical
data available for 14 patients,) (Figure
4
B).
discussion
In this report, we present three immunohistochemical markers
(CSE1, ID3, and STAT3) differentially expressed in BL and
DLBCL as well as a new decision tree, comprising the protein
expression of CSE1, STAT3, and MYC translocation, which
enables improved segregation of BL from DLBCL, and of
intermediate BL/DLBCL into two different prognostic groups.
CSE1L and ID3 were more frequently expressed in BL. In
contrast, STAT3 expression was associated with DLBCL,
especially the non-GCB subgroup. As expected, our
findings
correlate with the increased transcription levels previously
reported in gene-expression studies [
5
,
6
]. Moreover, we could
con
firm previous reports of STAT3 overexpression in
non-GCB-type DLBCL, both in a small series of primary
lymphomas and in cell lines [
16
,
22
]. Increased CSE1L
expression has also been reported in highly proliferating
lymphomas, including DLBCL, and a gain of the gene locus
was reported in primary cutaneous B-cell lymphomas. In the
case of ID3, a very limited data are available about its
expression and potential role in lymphomas [
9
,
10
,
14
,
15
].
Although the entity of BL is well characterized, its
distinction from DLBCL is not always unequivocal. In order to
improve the diagnostic accuracy of these entities, predictive
models were trained with different predictor sets (traditional
and new markers, FISH data) and cross-validated in 100-fold
bootstrapping, with the diagnosis of BL or DLBCL,
representing the prediction targets. The algorithm with highest
discriminative capacity comprised STAT3, CSE1L, and MYC
translocation. This algorithm, called
‘new classifier’,
demonstrates the lowest misclassification error for the
distinction of BL versus DLBCL when applied to the whole
cohort (Figures
2
and
3
). The validation of the proposed
predictive model on 23 recently diagnosed aggressive mature
Figure 3. Performance of the decision trees. Performance of the decision trees is based on the misclassification error (0%–100%). The misclassification error is lowered by adding the new markers to the conventional markers as indicated in Figure2. This holds true for strategies including FISH or not (A = conventional classifier without FISH data, B = classifier without FISH data, C = conventional classifier with FISH, and D = new classifier). Statistical significance is given for two of the three markers: P values from left to right for the differences between the two adjacent markers: P = 2.8e−20 (difference A to B), P = 4.4e−10 (difference B to C), P = 0.12 (difference C to D) (calculated with Welch’s two sample t-test).
BCL on the whole tissue sections displays a high agreement
with the results obtained on the TMA. Of note, the classifier
appears superior in instances where FISH is unavailable
(Figure
3
).
Most interestingly, the
‘new classifier’ emerged as the only
algorithm with the predictive value for all lymphomas.
Notably, when the
‘new classifier’ was applied to the whole
cohort including the intermediate BL/DLBCL group, it
predicted a more favorable outcome in patients identi
fied as
pBL if treated with intensive therapy rather than the
CHOP-like regimen (Figure
4
). The
‘new classifier’ presented seems
therefore to be very promising in identifying patients who
might bene
fit from high-dose chemotherapy regimens. This
stratification into groups of patients responding to intensive
chemotherapy appears particularly meaningful for two reasons.
First, no standardized treatment recommendations exist for
patients diagnosed as intermediate BL/DBCL. In particular,
recent studies showed a certain benefit for BL-oriented
therapies, but not for DLBCL-oriented R-CHOP regimens, in
patients with double-hit lymphomas with concurrent BCL2
and MYC translocations [
23
,
24
]. However, as the group of
intermediate BL/DLBCLs includes also cases which might not
require an intensive therapy [
24
], the identification of pDLBCL
cases will allow a more individualized therapeutic approach
even in patients with lymphomas with biological overlap.
Second, as shown by the few DLBCLs identified as pBLs, some
cases presenting with characteristic features of DLBCL carry a
very aggressive course and might require an intensive therapy.
Their identi
fication was not possible with conventional
methods, but with the proposed
‘new classifier’. Hence, the
additional, predictive approach to lymphomas by the
‘new
classi
fier’ might open new horizons in treatment planning and
allows affronting biologically overlapping lymphomas in an
alternative than the mere cell-of-origin-based way.
The validity of our study population is evidenced by the
significantly better OS and PFS of patients with an initial
diagnosis of BL than those with DLBCL, whereas patients
diagnosed as intermediate BL/DLBCL showed the poorest
outcome as reported in the literature (data not shown) [
23
,
24
].
Recent studies have suggested a potential role for CSE1L,
STAT3, and ID3 in oncology drug development. CSE1L
overexpression was shown to enhance apoptosis induced by
certain chemotherapeutic drugs [
25
,
26
]. For ID3, a number
of studies in solid tumors suggest a role as a putative target
[
27
–
29
]. STAT3 has been proposed as a putative therapeutic
target, either indirectly by proteasome inhibitors (e.g.
bortezomib) and histone deacetylase inhibitors, or as a direct
molecular target of drugs currently under development [
30
,
31
].
In summary, we present a new algorithm, which beyond its
diagnostic potency, bears predictive potential to treatment
response allowing tailored therapeutic approaches, in particular
for patients with intermediate BL/DLBCLs. Moreover, the
markers presented in this article represent easily detectable
molecules. Altogether, we believe that these data merit
con
firmation by prospective studies on larger cohorts.
acknowledgements
We are grateful to Silvia Behnke and Martina Storz for
excellent technical assistance, as well as to the team of the
cancer registry for invaluable support. We thank
E. Haralambieva and Th. Fuchs for fruitful discussions, and
J. Buhmann for pleasant collaboration and support.
funding
The work was in part supported by grants from the Helmut
Horten Stiftung (DS), the San Salvatore Foundation (DS),
Figure 4. Relationship of the treatment of predicted Burkitt’s lymphoma (BL) and overall survival (OS). OS of predicted BL treated with intensive therapy (red; (A) n = 12; (B) n = 3) versus CHOP-like regimens (black; (A) n = 13; (B) n = 6), when all cases are considered (A) and when only intermediate BL/DLBCLs are considered (B).
Fondazione Ticinese per la Ricerca sul Cancro (DS), and
Krebsliga Zurich (MT).
disclosure
The authors have declared no conflicts of interest.
references
1. Swerdlow SH, Campo E, Harris NL et al. WHO Classification of Tumours of Haematopoietic and Lymphoid Tissues. In World Health Organization Classification of Tumours, 4th Edition. Lyon: IARC 2008.
2. Aukema SM, Siebert R, Schuuring E et al. Double-hit B-cell lymphomas. Blood 2011; 117: 2319–2331.
3. Jaffe ES, Pittaluga S. Aggressive B-cell lymphomas: a review of new and old entities in the WHO classification. Hematology (Am Soc Hematol Educ Program) 2011; 2011: 506–514.
4. Salaverria I, Siebert R. The gray zone between Burkitt’s lymphoma and diffuse large B-cell lymphoma from a genetics perspective. J Clin Oncol 2011; 29: 1835–1843.
5. Hummel M, Bentink S, Berger H et al. A biologic definition of Burkitt’s lymphoma from transcriptional and genomic profiling. N Engl J Med 2006; 354:
2419–2430.
6. Dave SS, Fu K, Wright GW et al. Molecular diagnosis of Burkitt’s lymphoma. N Engl J Med 2006; 354: 2431–2442.
7. Brinkmann U. CAS, the human homologue of the yeast chromosome-segregation gene CSE1, in proliferation, apoptosis, and cancer. Am J Hum Genet 1998; 62: 509–513.
8. Boni R, Wellmann A, Man YG et al. Expression of the proliferation and apoptosis-associated CAS protein in benign and malignant cutaneous melanocytic lesions. Am J Dermatopathol 1999; 21: 125–128.
9. Wellmann A, Krenacs L, Fest T et al. Localization of the cell proliferation and apoptosis-associated CAS protein in lymphoid neoplasms. Am J Pathol 1997; 150: 25–30.
10. Mao X, Lillington D, Child F et al. Comparative genomic hybridization analysis of primary cutaneous B-cell lymphomas: identification of common genomic alterations in disease pathogenesis. Genes Chromosomes Cancer 2002; 35: 144–155.
11. Casas S, Ollila J, Aventin A et al. Changes in apoptosis-related pathways in acute myelocytic leukemia. Cancer Genet Cytogenet 2003; 146: 89–101.
12. Rivera R, Murre C. The regulation and function of the Id proteins in lymphocyte development. Oncogene 2001; 20: 8308–8316.
13. Lasorella A, Uo T, Iavarone A. Id proteins at the cross-road of development and cancer. Oncogene 2001; 20: 8326–8333.
14. Li XJ, Hata K, Mizuguchi J. Engagement of membrane immunoglobulin enhances Id3 promoter activity in WEHI-231 B lymphoma cells. Acta Pharmacol Sin 2005; 26: 486–491.
15. Li J, Maruyama T, Zhang P et al. Mutation of inhibitory helix–loop–helix protein Id3 causesγdelta T-cell lymphoma in mice. Blood 2010; 116: 5615–5621.
16. Lam LT, Wright G, Davis RE et al. Cooperative signaling through the signal transducer and activator of transcription 3 and nuclear factor-{kappa}B pathways in subtypes of diffuse large B-cell lymphoma. Blood 2008; 111: 3701–3713.
17. Hans CP, Weisenburger DD, Greiner TC et al. Confirmation of the molecular classification of diffuse large B-cell lymphoma by immunohistochemistry using a tissue microarray. Blood 2004; 103: 275–282.
18. Muwakkit SA, Razzouk BI, Shabb NS et al. Clinical presentation and treatment outcome of children with Burkitt lymphoma in Lebanon: a single institution’s experience. J Pediatr Hematol Oncol 2004; 26: 749–753.
19. Tibiletti MG, Martin V, Bernasconi B et al. BCL2, BCL6, MYC, MALT 1, and BCL10 rearrangements in nodal diffuse large B-cell lymphomas: a multicenter evaluation of a new set offluorescent in situ hybridization probes and correlation with clinical outcome. Hum Pathol 2009; 40: 645–652.
20. Ventura RA, Martin-Subero JI, Jones M et al. FISH analysis for the detection of lymphoma-associated chromosomal abnormalities in routine paraffin-embedded tissue. J Mol Diagn 2006; 8: 141–151.
21. Hastie T, Tibshirani R, Friedman J. The Elements of Statistical Learning: Data Mining, Inference, and Prediction. 2nd Edition. New York: Springer. 22. Ding BB, Yu JJ, Yu RY et al. Constitutively activated STAT3 promotes cell
proliferation and survival in the activated B-cell subtype of diffuse large B-cell lymphomas. Blood 2008; 111: 1515–1523.
23. Snuderl M, Kolman OK, Chen YB et al. B-cell lymphomas with concurrent IGH-BCL2 and MYC rearrangements are aggressive neoplasms with clinical and pathologic features distinct from Burkitt lymphoma and diffuse large B-cell lymphoma. Am J Surg Pathol 2010; 34: 327–340.
24. Savage KJ, Johnson NA, Ben-Neriah S et al. MYC gene rearrangements are associated with a poor prognosis in diffuse large B-cell lymphoma patients treated with R-CHOP chemotherapy. Blood 2009; 114: 3533–3537. 25. Liao CF, Luo SF, Shen TY et al. CSE1L/CAS, a microtubule-associated protein,
inhibits taxol ( paclitaxel)-induced apoptosis but enhances cancer cell apoptosis induced by various chemotherapeutic drugs. BMB Rep 2008; 41: 210–216. 26. Tai CJ, Hsu CH, Shen SC et al. Cellular apoptosis susceptibility (CSE1L/CAS) protein in cancer metastasis and chemotherapeutic drug-induced apoptosis. J Exp Clin Cancer Res 2010; 29: 110.
27. Mern DS, Hoppe-Seyler K, Hoppe-Seyler F et al. Targeting Id1 and Id3 by a specific peptide aptamer induces E-box promoter activity, cell cycle arrest, and apoptosis in breast cancer cells. Breast Cancer Res Treat 2010; 124: 623–633.
28. Kamalian L, Forootan SS, Bao ZZ et al. Inhibition of tumourigenicity of small cell lung cancer cells by suppressing Id3 expression. Int J Oncol 2010; 37: 595–603.
29. Shuno Y, Tsuno NH, Okaji Y et al. Id1/Id3 knockdown inhibits metastatic potential of pancreatic cancer. J Surg Res 2010; 161: 76–82.
30. Fletcher S, Drewry JA, Shahani VM et al. Molecular disruption of oncogenic signal transducer and activator of transcription 3 (STAT3) protein. Biochem Cell Biol 2009; 87: 825–833.
31. Borghouts C, Tittmann H, Delis N et al. The intracellular delivery of a recombinant peptide derived from the acidic domain of PIAS3 inhibits STAT3 transactivation and induces tumor cell death. Mol Cancer Res 2010; 8: 539–553.