Ion Abundances at the X Amino Acid in
RAAAA-X-AAAAK Peptides Correlate with
Amino Acid Polarity and Radical Stability
Aleksey Vorobyev, Hisham Ben Hamidane, and Yury O. Tsybin
Biomolecular Mass Spectrometry Laboratory, Ecole Polytechnique Fédérale de Lausanne, Lausanne, Switzerland
We present mechanistic studies aimed at improving the understanding of the product ion formation rules in electron capture dissociation (ECD) of peptides and proteins in Fourier transform ion cyclotron resonance mass spectrometry. In particular, we attempted to quantify the recently reported general correlation of ECD product ion abundance (PIA) with amino acid hydrophobicity. The results obtained on a series of model H-RAAAAXAAAAK-OH peptides confirm a direct correlation of ECD PIA with X amino acid hydrophobicity and polarity. The correlation factor (R) exceeds 0.9 for 12 amino acids (Ile, Val, His, Asn, Asp, Glu, Gln, Ser, Thr, Gly, Cys, and Ala). The deviation of ECD PIA for seven outliers (Pro is not taken into consideration) is explained by their specific radical stabilization properties (Phe, Trp, Tyr, Met, and Leu) and amino acid basicity (Lys, Arg). Phosphorylation of Ser, Thr, and Tyr decreases the efficiency of ECD around phosphorylated residues, as expected. The systematic arrangement of amino acids reported here indicates a possible route toward development of a predictive model for quantitative electron capture/transfer dissociation tandem mass spectrometry, with possible applications in proteomics. (J Am Soc Mass Spectrom 2009, 20, 2273–2283) Published by Elsevier Inc. on behalf of American Society for Mass Spectrometry
R
evealing peptide and protein structure-activityand structure-function relationships is an impor-tant and challenging step in the drug discovery process. Further insights into the influence of specific amino acids on molecular conformation and physico-chemical properties are needed to increase the through-put and accuracy of the methods and techniques used to investigate these critical relationships[1, 2]. Electron
capture dissociation (ECD) [3] and electron-transfer
dissociation (ETD) [4, 5] are generally employed to
determine peptide and protein primary structures and to characterize labile modifications in tandem mass spectrometry (MS/MS)-based proteomics. In addition, recent findings demonstrate that the probability of a
given N–C␣bond in a peptide backbone being cleaved
by ECD/ETD, which can be monitored by product ion abundance (PIA), is governed by peptide or protein
conformation [6 –9]. A number of experiments ranging
from targeted peptide analysis to statistical interpreta-tion of fragmentainterpreta-tion have been performed for several
thousand tryptic peptides [6, 7, 10 –13]to examine the
dependence of ECD PIA on peptide sequence. The experimental results have confirmed the complementa-rity of ECD and vibrationally induced dissociation, e.g.,
collision-induced dissociation (CID), but have failed to provide a general quantitative model for ECD. Enhanc-ing models to include intramolecular hydrogen bond-ing has provided the best quantitative description of ECD PIA to date, as shown by Zubarev and coworkers
[14]. However, their reported correlation is built upon
extensive molecular dynamics simulations performed for a specific case of a selected part of a small (20-amino acid) protein, Trp cage. Although general application of the model would be time-consuming, it demonstrates the importance of hydrogen bonds when attempting to quantitatively describe ECD. Recent molecular dynam-ics modeling complemented with quantum chemistry calculations on penta- and hexapeptides supports the hypothesis that ECD/ETD possess strong
conforma-tional selectivity[15]. The reported results demonstrate
the ability to find specific peptide conformations that lead to formation of a given product ion in ECD or ETD mass spectra. However, the extremely large size of a peptide’s conformational space and the fact that the same product ion can be formed from a number of conformers via different pathways limits the ability to quantitatively model ECD/ETD fragmentation pat-terns. Importantly, the performed calculations do not take into account peptide properties that influence peptide con-formation and dynamics, e.g., entropy and ion internal
energy[16, 17]. Therefore, an alternative, presumably
phe-Address reprint requests to Professor Y. O. Tsybin, Biomolecular Mass Spectrometry Laboratory, Ecole Polytechnique Fédérale de Lausanne, BCH 4307, 1015 Lausanne, Switzerland. E-mail:[email protected]
Published online September 3, 2009
Published by Elsevier Inc. on behalf of American Society for Mass Spectrometry. Received June 21, 2009
1044-0305/09/$32.00 Revised August 22, 2009
nomenological model may be helpful when developing a quantitative description of ECD/ETD.
Recently, we reported observation of
sequence-dependent ECD PIA of amphipathic peptides[12]. Due
to periodic variation of spatially separated hydrophobic and hydrophilic sequence regions in amphipathic pep-tides, their most probable conformational state in
solu-tion is an␣-helix. Distinguishing sequence and
confor-mational (e.g., secondary structure) effects on ECD PIA of amphipathic peptides is a complex task requiring extensive computational and experimental studies. Ne-vertheless, our observed correlation of ECD PIA with the amino acid hydrophobicity distribution represents a novel insight into the dependence of ECD on peptide sequence. Therefore, we have taken the suggested corre-lation between ECD PIA and amino acid hydrophobicity as a starting point in developing a quantitative phenom-enological description of ECD/ETD.
Here we present a mechanistic study on the influ-ence of amino acid properties, particularly hydropho-bicity/polarity and radical stability, on ECD PIA. ECD Fourier transform ion cyclotron resonance mass spec-trometry (FT-ICR MS) patterns of a complete series of model, single amino acid-substituted H-RAAAAXAAAAK-OH peptides involving all 20 naturally occurring and three phosphorylated amino acids are compared and correlated with various X amino acid physicochemical properties. The presented results can be considered an initial step toward development of a quantitative ECD/ETD model.
Experimental
Design and Synthesis of Model Peptides
A series of model peptides based on the general se-quence H-RAAAAXAAAAK-OH (where X is one of 20
natural amino acids or a phosphorylated T, Y or S) was produced by solid-state Fmoc chemistry on an Applied Biosystems 433 A Synthesizer with further purification by liquid chromatography (Protein and Peptide Synthe-sis Facility, Biochemistry Department, University of Lausanne, Switzerland). Peptides were dissolved in
water to a concentration of⬃1 mM and further diluted
in a standard spraying solution (H2O/CH3OH 50:50
volume ratio with 1% H3COOH) to a final peptide
concentration of⬃1M. Circular dichroism (CD)
spec-troscopy measurements were performed at 25 °C and
80 °C in either pure H2O or 50/50 H2O/ACN using a
J-810 CD system from Jasco (St. Michaels, MD, USA)
equipped with a 500-L cell.
The design of model peptides to probe the effect of amino acid properties on ECD PIA was performed based on ECD-specific experimental constraints (e.g., influence of charge location on ECD PIA) and custom structures of model peptides employed in amino acid hydrophobicity scale analysis (e.g., the translocon
insertion method).Scheme 1illustrates the structure
of H-RAAAAXAAAAK-OH peptides with an ex-changeable middle amino acid. The N-terminal Arg and C-terminal Lys define charge location and pro-vide sufficient ionization efficiency for multiply charged ion production. Although the N-terminal amide can compete with Arg and Lys for a proton, we believe that the side-chains of the basic amino acids located next to the termini were the primary locations of protonation. We confirmed proton location on Arg and Lys in peptides without a basic amino acid (e.g., Lys, Arg, and His) in the middle by joint theoretical peptide conformation landscaping with replica change molecular dynamics simulations and an ex-perimental ion mobility mass spectrometry-based
ap-H
+H
+- one of 20 amino acids
- phospho-modified T, S, Y
- non-natural amino acids,
spacer (Ala
4)
spacer (Ala
4)
c
h
a
r
g
e
e
g
r
a
h
c
modification
H
+H
+- one of 20 amino acids
- phospho-modified T, S, Y
- non-natural amino acids,
e.g. norleucine
spacer (Ala
4)
spacer (Ala
4)
c
h
a
r
g
e
e
g
r
a
h
c
modification
Scheme 1. Model peptides designed to probe the effect of a single amino acid substitution on product ion abundance in ECD. Polyalanine spacers separate protonated N-terminal and C-terminal basic amino acids from a centrally located modification. All 20 naturally occurring amino acid residues have been examined, as have phosphorylated Tyr, Ser, and Thr.
proach [18]. The substantial difference in mass between Lys and Arg side chains separates poten-tially overlapping C-terminal and N-terminal
prod-uct ions of poly-Ala peptides. (Ala)4 spacers were
designed to be long enough to keep a middle amino acid of interest far enough away from the protonated sites to reduce the potential for direct charge influ-ence. On the other hand, spacers longer than four amino acids may substantially reduce ECD efficiency in the central part of the sequence for doubly charged
precursor ions[12]. The model peptide with X⫽ Ala
may be considered as a reference molecule without a structural “defect” at the central amino acid.
ECD-Based Tandem Mass Spectrometry
ECD experiments were performed on a hybrid linear ion trap Fourier transform ion cyclotron resonance mass spec-trometer (LTQ FT-ICR MS) equipped with an 11 T
supercon-ducting magnet [12, 19]. Peptides were
electrospray-ionized with a TriVersa robot using a standard ESI chip
(10m i.d. capillaries) from Advion (Ithaca, NY, USA)
at a flow rate of ⬃200 nL/min. Doubly protonated
peptides were isolated in the LTQ (isolation window of 4 Th) and transferred to the ICR ion trap for subsequent tandem mass spectrometry following standard
proce-dures[20]. ECD was performed with low-energy
elec-trons for⬃70 ms using a pencil electron beam from a
dispenser cathode located in the homogenous region of
the magnetic field[21]. The variable delay before
elec-tron injection was optimized to account for ion
magnet-ron motion[22]. To improve the statistical validity of
the acquired data, 100 single-scan mass spectra were su-mmed to produce each mass spectrum. ECD PIA
ana-lysis was performed as previously described [12].
Briefly, isotopic peaks for each product ion were summed to provide a list of absolute abundances for product ions in a given tandem mass spectrum. Relative values for the ECD PIA were then obtained by dividing the absolute values of c-type or z-type product ions by the sum of abundances for all c-type ion series and
z-type ion series. Taking into account all isotopes for a
given product ion diminishes the discrepancy in ion internal energies between different experiments as iso-topes of both odd-electron (radical) and even-electron
(prime) product ions are considered [23]. Statistical
analysis of the relative ECD PIA variation within a single accumulated spectrum (100 summed scans) gives an estimated error of less than 1%. The error in repeat-ability and reproducibility of relative ECD PIA is more pronounced, with an estimated 5% to 10% day-to-day error for replicate experiments performed on the same instrumental set-up. The variation is presumably due to the influence of precursor ion and incoming electron energy sensitivity to experimental parameters during the ECD process. Despite the use of automatic gain control (AGC), electrospray instabilities modulate the amount of precursor ions in the ICR trap, thereby influencing the ion-electron beam overlap and the
am-plitude of space charge effects. Additional error is due to imperfect product ion excitation and detection re-peatability. Nevertheless, local maxima and minima of the reported ECD PIA distributions are reproducible even with the estimated errors.
Results and Discussions
ECD PIA of H-RAAAAXAAAAK-OH Peptide
Series
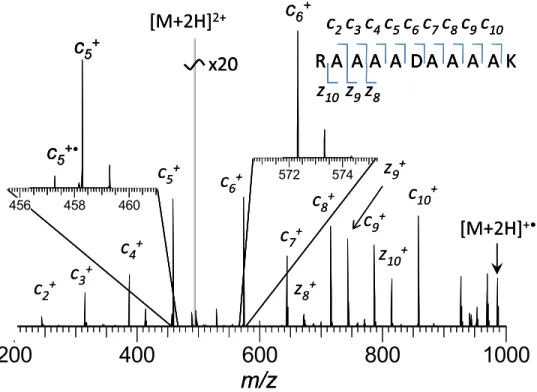
ECD FT-ICR mass spectra of the model peptide series demonstrate extensive sequence coverage by primarily
c-type ions for all peptides studied (Figure 1 and Supplemental Material Figure S1, which can be found in the electronic version of this article). Although sev-eral c-ions show radical components, yield of odd-electron c-ions is low. ECD PIA distributions show a characteristic response to the “defect” (e.g., amino acid substitution) incorporated into the polyAla chain, as
shown in Figure 2. The dominance of c-type ions is
presumably due to higher propensity of Lys compared
with Arg for charge neutralization in ECD[24].
Never-theless, z-type ions formed by N–C␣ cleavage near the
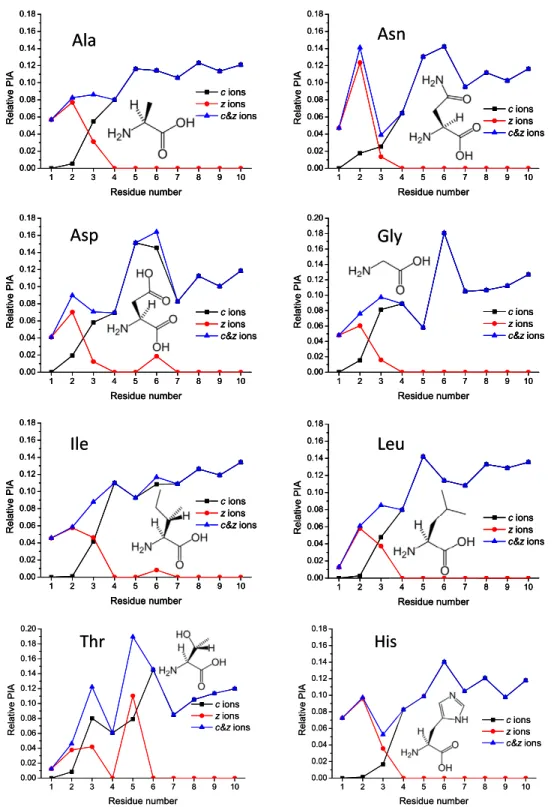
N-terminus were observed for all peptides. Addition-ally, several peptides demonstrate formation of z-ions around the substituted amino acid. To study the impact of the substituted amino acid on ECD PIA, difference
graphs were constructed. The difference graphs (Figure
3) demonstrate the variation of ECD PIA versus a
polyAla chain (e.g., the peptide where X⫽ Ala, also
referred to as the reference peptide). ECD of the refer-ence peptide demonstrates almost equal probability for
the N–C␣bond cleavage in the middle of the sequence,
with decreasing bond rupture efficiency toward the N-terminus. The N-terminus remains charged during
c-ion formation. A line is included at a value of zero
change in the ECD PIA shown in Figure 3 to help
highlight up- and down-regulation of the ECD PIA
when compared with the X⫽ Ala peptide. Amino acids
inFigure 3are grouped in regard to the fragmentation
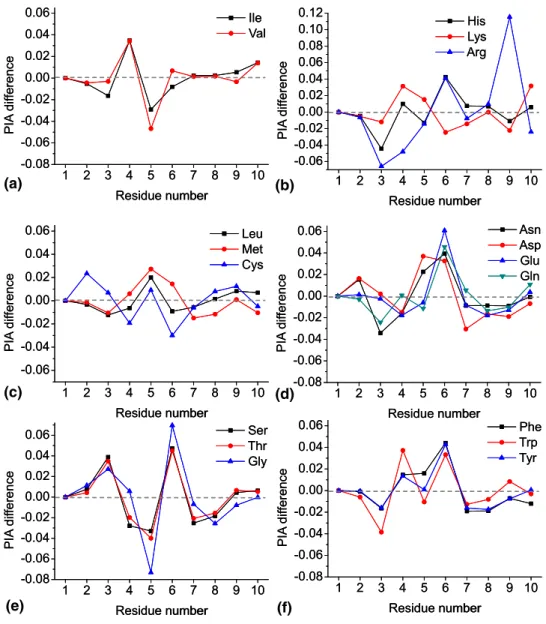
behavior they demonstrate. As shown in Figure 3d–f,
enhanced fragmentation generally occurs at the
C-terminal side of the inserted amino acid (at N–C␣bond
number 7). In contrast, ECD efficiency is enhanced at the N-terminal side of the inserted amino acid (e.g.,
N–C␣bond number 6) for Met and Leu residues (Figure
3c). Ile and Val, the most hydrophobic amino acids,
demonstrate enhanced ECD efficiency at N–C␣ bond
number 5, even further toward the N-terminus. A
symmetric decline in ECD PIA at N–C␣bond number 6
is observed for Ile and Val. Of the 3 basic amino acids, His demonstrates ECD PIA behavior similar to polar residues (e.g., Glu). Substitution with more basic Arg
and Lys (Figure 3b) yields drastic differences in the
ECD PIA distribution along the sequence. Presumably,
His is not charged in the X⫽ His peptide due to the
peptide termini, and thus His does not substantially impact charge location.
The secondary structure of the H-RAAAAXAAAAK-OH peptides were probed by circular dichroism (data not shown). No pronounced secondary structure ele-ments, e.g., an␣-helix or a -strand, could be assigned to any of the peptides in the series.
Correlation of ECD PIA with Amino Acid
Properties
We sought to determine the particular amino acid properties that influence the ECD PIA through correla-tion of amino acid hydrophobicity or polarity scales with the ECD PIA around the substituted amino acid, following recent reports of a correlation between the
ECD PIA and the amino acid hydrophobicity [12].
However, to distinguish the influence of hydrophobic-ity/polarity on ECD fragmentation pattern from other amino acid properties, we had to exclude a number of amino acids from the consideration. First, based on the previous knowledge on the influence of basic residues on peptide protonation and ECD fragmentation pattern, we excluded the basic amino acids (Lys and Arg) from
the correlation fit. The data reported inFigures 2and3
clearly suggest charge location perturbation within the
precursor ions for X⫽ Arg and X ⫽ Lys. Second, we
excluded the group of five amino acids, namely Leu, Phe, Tyr, Trp, and Met, which are known to provide strong radical stabilization that may dominate hydrogen-bonding properties reflected by hydrophobicity or
po-larity[25, 26]. Radical stabilization in molecular system
depends on the possibility of delocalization of the electron density excess on as many atoms or groups of atoms as possible to minimize its potential energy. To evaluate the extent of stabilization, two criteria should be taken into consideration: the degree of bonding of the atom on which the radical is initially located, and the proximity of stabilizing groups (such as electron withdrawing groups). As ECD and ETD are considered to be radical-driven, the extent of radical stabilization should play a crucial role in determining the Gibbs enthalpy of the reaction and the relative energy of the resulting product ions. A reasonable assumption is that
to form fragment ions, namely c and z•, not only the
activation barrier leading to the N–C␣ bond cleavage
has to be overcome but also the resulting radical has to be stable. From that perspective, leucine should provide higher radical stability than isoleucine despite its com-parable hydrophobicity/polarity values. That is be-cause leucine radical is stabilized on a tertiary carbon atom, whereas it is stabilized only on a secondary or a primary carbon for isoleucine. Substantial difference between impact of Leu and Ile on radical-driven pep-tide fragmentation was recently confirmed by Julian
and coworkers[25]. Similarly, although methionine and
cysteine are close on a hydrophobicity/polarity scale, methionine is characterized by stronger radical stabiliz-ing properties than cysteine. Methionine may form secondary sulfur radical upon ECD, enhancing product ion stabilization and decreasing its energy, whereas cysteine forms only primary sulfur radical that does not
200
400
600
800
1000
[M+2H]
2+[M+2H]
+•c
2+c
3+c
4+c
5+c
6+c
7+c
8+c
9+c
10+z
8+z
9+z
10+x20
R
A
A A
A
D
A
A
A
A K
c
2c
3c
4c
5c
6c
7c
8c
9c
10z
10z
9z
8m/z
456 458 460c
5+c
5+ 572 574c
6+200
400
600
800
1000
[M+2H]
2+[M+2H]
+•c
2+c
3+c
4+c
5+c
6+c
7+c
8+c
9+c
10+z
8+z
9+z
10+x20
x20
R
A
A A
A
D
A
A
A
A K
c
2c
3c
4c
5c
6c
7c
8c
9c
10z
10z
9z
8A
A
A
A
D
D
A
A
A K
RR
A
A A
A
A
A
A
c
2c
3c
4c
5c
6c
7c
8c
9c
10z
10z
9z
8m/z
456 458 460c
5+c
5+ 456 458 460c
5+c
5+• 572 574c
6+Figure 1. A typical tandem mass spectrum of peptide H-RAAAADAAAAK-OH, acquired under standard ECD FT-ICR MS conditions. Data for all other peptides are shown in the Supplementary material (Figure S1).
provide extensive radical stabilization. The remaining amino acids, Phe, Tyr, and Trp, are aromatic and, thus, provide strong radical stabilization due to their specific ring-associated radical-forming properties.
With the exception of five amino acids, which are excluded due to their known radical-stabilizing
prop-erties and two basic amino acids, excellent correlation is observed between the ECD PIA and the hydrophobicity and polarity of the substituted residue, Figure 4. The
top ofFigure 4 demonstrates a correlation of the ECD
PIA with Hessa’s amino acid hydrophobicity scale,
employed in [12]. The bottom of Figure 4 shows the
Ala
Asn
Asp
Ile
Gly
Leu
1 2 3 4 5 6 7 8 9 10 0.00 0.02 0.04 0.06 0.08 0.10 0.12 0.14 0.16 0.18 0.20 Relative PI A Residue number c ions z ions c&z ions 1 2 3 4 5 6 7 8 9 10 0.00 0.02 0.04 0.06 0.08 0.10 0.12 0.14 0.16 0.18 Relative PIA Residue number c ions z ions c&z ions 1 2 3 4 5 6 7 8 9 10 0.00 0.02 0.04 0.06 0.08 0.10 0.12 0.14 0.16 0.18 Relative PIA Residue number c ions z ions c&z ions 1 2 3 4 5 6 7 8 9 10 0.00 0.02 0.04 0.06 0.08 0.10 0.12 0.14 0.16 0.18 Relative PI A Residue number c ions z ions c&z ions 1 2 3 4 5 6 7 8 9 10 0.00 0.02 0.04 0.06 0.08 0.10 0.12 0.14 0.16 0.18 Re lative P IA Residue number c ions z ions c&z ions 1 2 3 4 5 6 7 8 9 10 0.00 0.02 0.04 0.06 0.08 0.10 0.12 0.14 0.16 0.18 Relative PI A Residue number c ions z ions c&z ionsAla
Asn
Asp
Ile
Gly
Leu
1 2 3 4 5 6 7 8 9 10 0.00 0.02 0.04 0.06 0.08 0.10 0.12 0.14 0.16 0.18 0.20 Relative PI A Residue number c ions z ions c&z ions 1 2 3 4 5 6 7 8 9 10 0.00 0.02 0.04 0.06 0.08 0.10 0.12 0.14 0.16 0.18 Relative PIA Residue number c ions z ions c&z ions 1 2 3 4 5 6 7 8 9 10 0.00 0.02 0.04 0.06 0.08 0.10 0.12 0.14 0.16 0.18 Relative PIA Residue number c ions z ions c&z ions 1 2 3 4 5 6 7 8 9 10 0.00 0.02 0.04 0.06 0.08 0.10 0.12 0.14 0.16 0.18 Relative PI A Residue number c ions z ions c&z ions 1 2 3 4 5 6 7 8 9 10 0.00 0.02 0.04 0.06 0.08 0.10 0.12 0.14 0.16 0.18 Re lative P IA Residue number c ions z ions c&z ions 1 2 3 4 5 6 7 8 9 10 0.00 0.02 0.04 0.06 0.08 0.10 0.12 0.14 0.16 0.18 Relative PI A Residue number c ions z ions c&z ions 1 2 3 4 5 6 7 8 9 10 0.00 0.02 0.04 0.06 0.08 0.10 0.12 0.14 0.16 0.18 0.20 Relative PI A Residue number c ions z ions c&z ions 1 2 3 4 5 6 7 8 9 10 0.00 0.02 0.04 0.06 0.08 0.10 0.12 0.14 0.16 0.18 Relative PIA Residue number c ions z ions c&z ions 1 2 3 4 5 6 7 8 9 10 0.00 0.02 0.04 0.06 0.08 0.10 0.12 0.14 0.16 0.18 Relative PIA Residue number c ions z ions c&z ions 1 2 3 4 5 6 7 8 9 10 0.00 0.02 0.04 0.06 0.08 0.10 0.12 0.14 0.16 0.18 Relative PI A Residue number c ions z ions c&z ions 1 2 3 4 5 6 7 8 9 10 0.00 0.02 0.04 0.06 0.08 0.10 0.12 0.14 0.16 0.18 Re lative P IA Residue number c ions z ions c&z ions 1 2 3 4 5 6 7 8 9 10 0.00 0.02 0.04 0.06 0.08 0.10 0.12 0.14 0.16 0.18 Relative PI A Residue number c ions z ions c&z ions 1 2 3 4 5 6 7 8 9 10 0.00 0.02 0.04 0.06 0.08 0.10 0.12 0.14 0.16 0.18 Relative PIA Residue number c ions z ions c&z ionss
i
H
r
h
T
1 2 3 4 5 6 7 8 9 10 0.00 0.02 0.04 0.06 0.08 0.10 0.12 0.14 0.16 0.18 0.20 Relative PIA Residue number c ions z ions c&z ions 1 2 3 4 5 6 7 8 9 10 0.00 0.02 0.04 0.06 0.08 0.10 0.12 0.14 0.16 0.18 Relative PIA Residue number c ions z ions c&z ionss
i
H
r
h
T
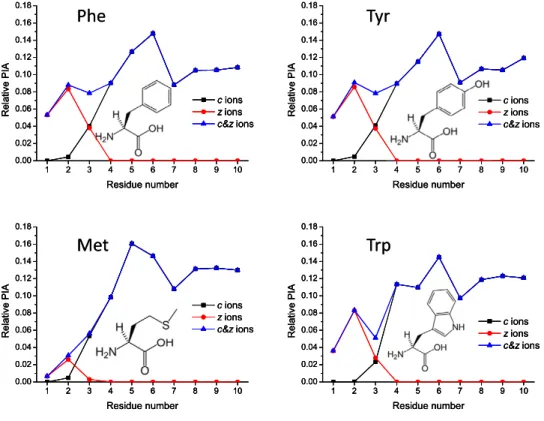
1 2 3 4 5 6 7 8 9 10 0.00 0.02 0.04 0.06 0.08 0.10 0.12 0.14 0.16 0.18 0.20 Relative PIA Residue number c ions z ions c&z ionsFigure 2. Product ion abundance distribution for c-ions, z-ions, and a sum of c- and z-ions obtained by ECD FT-ICR MS of peptides H-RAAAA-X-AAAAK-OH, where X is one of 20 naturally occurring amino acids. Product ion abundances are normalized to the sum of all c- and z-ions. The statistical error of the relative ECD PIA variation is less than 1%. C-terminal product ions (z-ions) are shown in inverse order to correlate with the corresponding c-ions.
ECD PIA plotted versus the amino acid polarity scale
introduced by Grantham[27]. A linear fit shows almost
direct correlation between the ECD PIA and amino acid
polarity with a correlation factor of R ⫽ 0.97 for the
remaining 12 amino acids (Figure 4, bottom). The ECD
PIA correlation with the Hessa amino acid hydropho-bicity obtained for the same 12 amino acids
demon-strates a slightly lower correlation factor of R ⫽ 0.93
(Figure 4, top). The direct correlation reported here
includes more amino acids and achieves a higher cor-relation factor than previously reported corcor-relations of cleavage frequencies in ECD versus amino acid prop-erties. The initial assumption that the ECD PIA corre-lates with amino acid hydrophobicity has been con-firmed for most of the amino acids.
We consider polarity scales here due to the direct relation of polarity to hydrophobicity, with polarity defined in a similar manner but for a broader range of
Ser
Glu
Gln
Val
1 2 3 4 5 6 7 8 9 10 0.00 0.02 0.04 0.06 0.08 0.10 0.12 0.14 0.16 0.18 Relative PIA Residue number c ions z ions c&z ions 1 2 3 4 5 6 7 8 9 10 0.00 0.02 0.04 0.06 0.08 0.10 0.12 0.14 0.16 0.18 Relativ e PIA Residue number c ions z ions c&z ions 1 2 3 4 5 6 7 8 9 10 0.00 0.02 0.04 0.06 0.08 0.10 0.12 0.14 0.16 0.18 Relativ e PIA Residue number c ions z ions c&z ions 1 2 3 4 5 6 7 8 9 10 0.00 0.02 0.04 0.06 0.08 0.10 0.12 0.14 0.16 0.18 Relative PIA Residue number c ions z ions c&z ionss
y
L
g
r
A
1 2 3 4 5 6 7 8 9 10 0.00 0.02 0.04 0.06 0.08 0.10 0.12 0.14 0.16 0.18 R elative PIA Residue number c ions z ions c&z ions 1 2 3 4 5 6 7 8 9 10 0.00 0.02 0.04 0.06 0.08 0.10 0.12 0.14 0.16 0.18 R elative PIA Residue number c ions z ions c&z ionsSer
Glu
Gln
Val
1 2 3 4 5 6 7 8 9 10 0.00 0.02 0.04 0.06 0.08 0.10 0.12 0.14 0.16 0.18 Relative PIA Residue number c ions z ions c&z ions 1 2 3 4 5 6 7 8 9 10 0.00 0.02 0.04 0.06 0.08 0.10 0.12 0.14 0.16 0.18 Relativ e PIA Residue number c ions z ions c&z ions 1 2 3 4 5 6 7 8 9 10 0.00 0.02 0.04 0.06 0.08 0.10 0.12 0.14 0.16 0.18 Relativ e PIA Residue number c ions z ions c&z ions 1 2 3 4 5 6 7 8 9 10 0.00 0.02 0.04 0.06 0.08 0.10 0.12 0.14 0.16 0.18 Relative PIA Residue number c ions z ions c&z ionss
y
L
g
r
A
1 2 3 4 5 6 7 8 9 10 0.00 0.02 0.04 0.06 0.08 0.10 0.12 0.14 0.16 0.18 R elative PIA Residue number c ions z ions c&z ions 1 2 3 4 5 6 7 8 9 10 0.00 0.02 0.04 0.06 0.08 0.10 0.12 0.14 0.16 0.18 R elative PIA Residue number c ions z ions c&z ions 1 2 3 4 5 6 7 8 9 10 0.00 0.02 0.04 0.06 0.08 0.10 0.12 0.14 0.16 0.18 R elative PIA Residue number c ions z ions c&z ions 1 2 3 4 5 6 7 8 9 10 0.00 0.02 0.04 0.06 0.08 0.10 0.12 0.14 0.16 0.18 R elative PIA Residue number c ions z ions c&z ionss
y
C
o
r
P
1 2 3 4 5 6 7 8 9 10 0.00 0.02 0.04 0.06 0.08 0.10 0.12 0.14 0.16 0.18 0.20 0.22 0.24 Relative PI A Residue number c ions z ions c&z ions 1 2 3 4 5 6 7 8 9 10 0.00 0.02 0.04 0.06 0.08 0.10 0.12 0.14 0.16 0.18 Relative PI A Residue number c ions z ions c&z ionss
y
C
o
r
P
1 2 3 4 5 6 7 8 9 10 0.00 0.02 0.04 0.06 0.08 0.10 0.12 0.14 0.16 0.18 0.20 0.22 0.24 Relative PI A Residue number c ions z ions c&z ions 1 2 3 4 5 6 7 8 9 10 0.00 0.02 0.04 0.06 0.08 0.10 0.12 0.14 0.16 0.18 Relative PI A Residue number c ions z ions c&z ions 1 2 3 4 5 6 7 8 9 10 0.00 0.02 0.04 0.06 0.08 0.10 0.12 0.14 0.16 0.18 0.20 0.22 0.24 Relative PI A Residue number c ions z ions c&z ions 1 2 3 4 5 6 7 8 9 10 0.00 0.02 0.04 0.06 0.08 0.10 0.12 0.14 0.16 0.18 Relative PI A Residue number c ions z ions c&z ions Figure 2. Continued.solvents than hydrophobicity. This particular scale of polarity is selected because it correlates best with the ECD PIA for most amino acids as described below. Only c-ions around the substituted amino acids are
taken into account in Figure 4. Normalization is done
on the sum of all c-ions, with the z-ions excluded from consideration. Interestingly, including z-ions into nor-malization slightly reduces the overall correlation (R
⬃0.8). Indeed, data inFigures 2 and 3clearly indicate
absence of z-ions for the N–C␣ cleavages around the
middle amino acid in most cases with the exception for Asp, Ile, Ser, Arg, and Thr. The most abundant z-ion is observed for Thr despite its lower hydrophobicity/ polarity compared with other amino acids from this
group, Figure 2. Although previously reported data
confirm correlation of z-ion abundance with amino acid hydrophobicity for ECD of doubly and triply charged
peptides [12], data presented here indicate different
reactivity of z-ions compared with the c-ions, presum-ably due to their radical nature. Furthermore, for the doubly charged peptide series employed in the current work, z-ions could only be formed accompanied by the charge neutralization at the N-terminal Arg. On the other hand, c-ions could only be formed accompanied by the charge neutralization at the C-terminal Lys. Therefore, differences in peptide conformations due to the interactions between Arg and Lys side chains with a middle amino acid side chain may also contribute to the observed behavior. Understanding the selectivity and specificity of ECD to the amino acid nature and peptide properties in the formation of z-ions requires further research.
Although incorporation of basic amino acids (Lys and Arg) drastically changes the ECD PIA distribution
compared with non-basic amino acids,Figures 2and3,
the ECD PIA for Arg is close to the main trend line,
Figure 4. We consider the location of Arg on the main trend to be a coincidence, as the fragmentation effi-ciency around the N-terminus and C-terminus in the
ECD of those peptides with X⫽ Arg is perturbed. The
re-ported data, however, do not allow estimation of the probability that the middle amino acid is protonated
when X ⫽ Lys or Arg. Complementary experimental
measurements (e.g., ion mobility mass spectrometry) combined with molecular dynamics simulations are needed. Importantly, all five amino acids that provide strong radical stabilization cluster outside the linear fit. They demonstrate higher ECD efficiency for the
back-bone cleavages around them, as expected,Figure 4.
Table 1summarizes both the reported values for the ECD PIA around substituted amino acids and the corresponding properties of the amino acids. The pro-line residue is not taken into account when examining the general correlation. Table 1 also shows that
phos-phorylation of a middle site in model peptides with X⫽
Thr, Tyr, and Ser reduces the likelihood that N–C␣
bonds located close to the modification will be cleaved. This decrease in the ECD efficiency is in agreement with the recent studies by Creese and Cooper, which suggest reduction in ECD efficiency of phosphopeptides due to the formation of salt-bridges between the
phosphor-groups and protonated amino acids [28]. Furthermore,
phosphorylation reduces radical stabilization of
tyro-sine [29]. Finally, phosphor groups may act as radical
Phe
Met
Tyr
Trp
1 2 3 4 5 6 7 8 9 10 0.00 0.02 0.04 0.06 0.08 0.10 0.12 0.14 0.16 0.18 Relative PIA Residue number c ions z ions c&z ions 1 2 3 4 5 6 7 8 9 10 0.00 0.02 0.04 0.06 0.08 0.10 0.12 0.14 0.16 0.18 Relative PIA Residue number c ions z ions c&z ions 1 2 3 4 5 6 7 8 9 10 0.00 0.02 0.04 0.06 0.08 0.10 0.12 0.14 0.16 0.18 Relative PIA Residue number c ions z ions c&z ions 1 2 3 4 5 6 7 8 9 10 0.00 0.02 0.04 0.06 0.08 0.10 0.12 0.14 0.16 0.18 Relative PIA Residue number c ions z ions c&z ionsPhe
Met
Tyr
Trp
1 2 3 4 5 6 7 8 9 10 0.00 0.02 0.04 0.06 0.08 0.10 0.12 0.14 0.16 0.18 Relative PIA Residue number c ions z ions c&z ions 1 2 3 4 5 6 7 8 9 10 0.00 0.02 0.04 0.06 0.08 0.10 0.12 0.14 0.16 0.18 Relative PIA Residue number c ions z ions c&z ions 1 2 3 4 5 6 7 8 9 10 0.00 0.02 0.04 0.06 0.08 0.10 0.12 0.14 0.16 0.18 Relative PIA Residue number c ions z ions c&z ions 1 2 3 4 5 6 7 8 9 10 0.00 0.02 0.04 0.06 0.08 0.10 0.12 0.14 0.16 0.18 Relative PIA Residue number c ions z ions c&z ions 1 2 3 4 5 6 7 8 9 10 0.00 0.02 0.04 0.06 0.08 0.10 0.12 0.14 0.16 0.18 Relative PIA Residue number c ions z ions c&z ions 1 2 3 4 5 6 7 8 9 10 0.00 0.02 0.04 0.06 0.08 0.10 0.12 0.14 0.16 0.18 Relative PIA Residue number c ions z ions c&z ions 1 2 3 4 5 6 7 8 9 10 0.00 0.02 0.04 0.06 0.08 0.10 0.12 0.14 0.16 0.18 Relative PIA Residue number c ions z ions c&z ions 1 2 3 4 5 6 7 8 9 10 0.00 0.02 0.04 0.06 0.08 0.10 0.12 0.14 0.16 0.18 Relative PIA Residue number c ions z ions c&z ions Figure 2. Continued.traps and inhibit radical-driven fragmentation reaction
[30]. Therefore, despite the liquid
chromatography-mass spectrometry-based experimental fact that phos-phorylation increases overall peptide hydrophilicity, other processes prohibit increase of ECD efficiency.
In total, a set of 17 amino acid property scales out of
the 60 probed[31]returned a correlation factor R higher
than 0.5 for all amino acids but Arg, Lys, His, Gly, Pro, Cys, and Leu. Among others, the following scales were
considered: hydrophobicity (Hessa[32], Kyte and
Doo-little [33], Black [34]), polarity (Grantham [27], and
Zimmerman et al. [35]), ␣-helix tendency [36], -turn
tendency [36], and transmembrane tendency [37]. In
addition, we correlated other physicochemical
proper-ties of amino acids with the ECD PIA, including [31]:
dipole moment [38], molecular weight, bulkiness[35],
average flexibility index [39], pKa, substituent effect
scale[40], and diverse electron properties of the amino
acid side chains [41]. High correlation factors were
observed when correlating the ECD PIA with the
trans-membrane tendency scale (R ⫽ 0.89), hydrophobicity
indices at pH 7.5 as determined by HPLC (R ⫽ 0.93)
[42], and Black hydrophobicity (R ⫽ 0.93) [34].
Exclu-sion of amino acids from consideration was based on their specific basicity or structural properties as de-scribed above.
Considerations for the ECD PIA Correlation with
Polarity
Correlation of the ECD PIA with amino acid polarity as a function of the amino acid sequence may be attributed to the ECD PIA dependence on specific conformations
1 2 3 4 5 6 7 8 9 10 -0.08 -0.06 -0.04 -0.02 0.00 0.02 0.04 0.06 PIA dif ference Residue number Ile Val 1 2 3 4 5 6 7 8 9 10 -0.06 -0.04 -0.02 0.00 0.02 0.04 0.06 0.08 0.10 0.12 PIA dif ference Residue number His Lys Arg 1 2 3 4 5 6 7 8 9 10 -0.06 -0.04 -0.02 0.00 0.02 0.04 0.06 PIA dif ference Residue number Leu Met Cys 1 2 3 4 5 6 7 8 9 10 -0.08 -0.06 -0.04 -0.02 0.00 0.02 0.04 0.06 PIA dif ference Residue number Asn Asp Glu Gln 1 2 3 4 5 6 7 8 9 10 -0.08 -0.06 -0.04 -0.02 0.00 0.02 0.04 0.06 PIA dif ference Residue number Ser Thr Gly 1 2 3 4 5 6 7 8 9 10 -0.08 -0.06 -0.04 -0.02 0.00 0.02 0.04 0.06 PIA dif ference Residue number Phe Trp Tyr 1 2 3 4 5 6 7 8 9 10 -0.08 -0.06 -0.04 -0.02 0.00 0.02 0.04 0.06 PIA dif ference Residue number Ile Val 1 2 3 4 5 6 7 8 9 10 -0.06 -0.04 -0.02 0.00 0.02 0.04 0.06 0.08 0.10 0.12 PIA dif ference Residue number His Lys Arg 1 2 3 4 5 6 7 8 9 10 -0.06 -0.04 -0.02 0.00 0.02 0.04 0.06 PIA dif ference Residue number Leu Met Cys 1 2 3 4 5 6 7 8 9 10 -0.08 -0.06 -0.04 -0.02 0.00 0.02 0.04 0.06 PIA dif ference Residue number Asn Asp Glu Gln 1 2 3 4 5 6 7 8 9 10 -0.08 -0.06 -0.04 -0.02 0.00 0.02 0.04 0.06 PIA dif ference Residue number Ser Thr Gly 1 2 3 4 5 6 7 8 9 10 -0.08 -0.06 -0.04 -0.02 0.00 0.02 0.04 0.06 PIA dif ference Residue number Phe Trp Tyr (a) (b) (c) (d) (e) (f)
Figure 3. Difference graphs for product ion abundance distribution versus X ⫽ Ala for c-ions obtained by ECD FT-ICR MS of H-RAAAA-X-AAAAK-OH, where X is (a) Ile and Val; (b) His, Lys, and Arg; (c) Leu, Met, and Cys; (d) Asn, Asp, Glu, and Gln; (e) Ser, Thr, and Gly; (f) Phe, Trp, and Tyr. The statistical error of the relative ECD PIA variation is less than 1%.
that precursor ions populate. The probability of forming hydrogen bonds to and from the substituted amino acid residue in solution is presumably directly related to amino acid hydrophobicity and polarity. In addition to hydrogen bonds, the peptide conformation is influ-enced by other effects, including interactions between the aromatic rings or interactions between an aromatic ring and a charge. Therefore, the observed linear corre-lation between the ECD PIA and the amino acid hydro-phobicity/polarity may indicate an amino acid-dependent peptide conformation preference and suggests that the tendency to form hydrogen bonds in the gas phase is similar to that observed in solution.
On the other hand, an alternative explanation should be entertained in which polarity is considered as a measure of electric charge separation in a peptide (e.g., the propensity to form electric dipoles). In the
homog-enous reference peptide with X ⫽ Ala, the structural
“defect” is absent and the ECD PIA is not perturbed (Figure 2a). For other peptides, the middle amino acid can be considered to be a defect for energy relaxation
along the peptide backbone and the hydrogen-bonded
network after electron capture [43]. For instance,
sub-stituted amino acids may modulate charge (electron) transfer along the peptide’s backbone and
hydrogen-bonding networks [44 – 47]. Presumably, excited
elec-trons or “hot elecelec-trons” created at the charge neutral-ization site may move along the peptide structure via the electron subsystem. Indeed, the electron orbitals of atoms near the charge-solvated site are polarized before charge neutralization. Increased density of electronic states around the protonation site results in an accumu-lation of electrostatic energy around that point in the peptide. Upon charge neutralization, the local electric potential suddenly drops. As we recently demonstr-ated, acoustic phonons may be formed due to this su-dden perturbation, and may distribute energy along the
peptide structure upon relaxation [43]. At the same
time, the electronic subsystem receives additional en-ergy, which may lead to formation of hot, energetic electrons. Hot electrons may move in the peptide struc-ture via covalent bonds and hydrogen bonding
net-Figure 4. Correlation of the ECD product ion abundance with (top) amino acid hydrophobicity32
and (bottom) amino acid polarity27. The ECD product ion abundance is the summed abundance of
c-ions due to cleavage of N–C␣bonds around the substituted amino acid at position 6 (N–C␣bonds number 6 and 7). Normalization of each ECD PIA value is performed using the sum of all detected
c-ions. Linear correlation is performed on 12 amino acids shown by open circles. The six outliers are
works toward the remaining charge sites, e.g., toward the N-terminal Arg for the studied peptide di-cation series[44, 47]. An electron approaching the substituted amino acid detects the difference in electronic proper-ties between Ala and the inserted amino acid. Enhanced fragmentation at the C-terminal side of the inserted
amino acid (Figure 3 d–f) can be rationalized as a
response to formation of an energetic (electrostatic) barrier for an electron to overcome. Similarly, ECD efficiency enhanced at the N-terminal side of the
in-serted amino acid (Figure 3c) may indicate formation of
an electrostatic well in the middle of a peptide by hydrophobic amino acids with specific radical
proper-ties. The created well would decrease the N–C␣ bond
strength inside the inserted amino acid, which corre-sponds to the N-terminal side of the amino acid residue.
Increased amino acid hydrophobicity (Figure 3a)
pro-motes ECD toward the N-terminus from the modifica-tion site. The probability of backbone cleavage de-creases as hot electrons travel away from the charged C-terminus due to energy dissipation.
Conclusions
Correlation of the ECD PIA with amino acid hydropho-bicity/polarity, a phenomenon that has recently been reported in ECD, has been quantified for the first time using a complete amino acid-substituted set of model
peptides. The high correlation factor found (R⬎ 0.9) for
most amino acids is somewhat surprising giving the solution phase-based definition of hydrophobicity/po-larity and the gas-phase-based ECD reactions. Distin-guishing three groups of amino acids (those that follow the main correlation with hydrophobicity/polarity, ba-sic amino acids, and amino acids with strong radical stabilization preference) is less surprising, given what is known from recent literature on radical stabilization effects in ECD/ETD, and earlier reports on the influ-ence of charge location on ECD/ETD fragmentation patterns. In accordance with the current understanding of the ECD/ETD mechanism, the reported results could be considered from two alternative directions: conformation-specific effects, and radical migration-conformation-specific effects. Both explanations require substantial theoretical calcu-lation efforts that are currently being undertaken not only by researchers in the ECD/ETD field but also in complementary fields, e.g., radical-driven UV
spectros-copy and electron photodetachment dissociation [29].
The simplicity of the model peptides selected in the current manuscript and the clear differences in the influence of different amino acids on the ECD PIA distribution may allow development of a better under-standing of not only ECD, but also of other techniques in radical-driven peptide chemistry. To complete the ECD PIA data and quantum chemistry calculations, probing the peptide conformational landscape and de-termination of the charge location can be performed by combined ion-mobility mass spectrometry and molecular
dynamics simulations[18]. Finally, the presented results
indicate a possible route toward the development of a general model for predicting ECD/ETD product ion abundances in a typical proteomics experiment.
Acknowledgments
The authors thank Catherine Servis for her help during peptide synthesis, and Oleg Tsybin for discussions. They acknowledge Ecole Polytechnique Federale de Lausanne and Swiss National Science Foundation (project 200021-125147/1) for financial support.
Appendix A
Supplementary Material
Supplementary material associated with this article
may be found in the online version at doi:10.1016/
j.jasms.2009.08.019.
References
1. Watt, P. M. Screening for Peptide Drugs from the Natural Repertoire of Biodiverse Protein Folds. Nat. Biotechnol. 2006, 24(2), 177–183. 2. Usui, K.; Tomizaki, K. Y.; Mihara, H. Screening of␣-Helical Peptide
Ligands Controlling a Calcineurin-Phosphatase Activity. Bioorg. Med.
Chem. Lett. 2007, 17(1), 167–171.
3. Zubarev, R. A. Electron Capture Dissociation and Other Ion-Electron Fragmentation Reactions. In Principles of Mass Spectrometry Applied to
Biomolecules, Lifshitz, C.; Laskin, J., Eds.; John Wiley and Sons Inc.:
Hoboken, NJ, 2006; p. 475–518.
4. Syka, J. E. P.; Coon, J. J.; Schroeder, M. J.; Shabanowitz, J.; Hunt, D. F. Peptide and Protein Sequence Analysis by Electron Transfer Dissocia-Table 1. Selected physicochemical properties of amino acids,
e.g., hydrophobicity (after Hessa et al.32) and polarity (after
Grantham27), versus the ECD PIA (summed abundances of c5
ions and c6ions). The order is alphabetical based on the single
amino acid nomenclature code. The statistical error of the relative ECD PIA variation is less than 1%
Amino acid Hydrophobicity Polarity
Transm.
tendency ECD PIA
Ala (A) 0.11 8.1 0.38 0.276 Cys (C) –0.13 5.5 –0.3 0.231 Asp (D) 3.49 13 –3.27 0.346 Glu (E) 2.68 12.3 –2.9 0.331 Phe (F) –0.32 5.2 1.98 0.336 Gly (G) 0.74 9 –0.19 0.274 His (H) 2.06 10.4 –1.44 0.314 Ile (I) –0.6 5.2 1.97 0.238 Lys (K) 2.71 11.3 –3.46 0.264 Leu (L) –0.55 4.9 1.82 0.287 Met (M) –0.1 5.7 1.4 0.318 Asn (N) 2.05 11.6 –1.62 0.347 Pro (P) 2.23 8 –1.44 0.087 Gln (Q) 2.36 10.5 –1.84 0.310 Arg (R) 2.58 10.5 –2.57 0.324 Ser (S) 0.84 9.2 –0.53 0.292 Thr (T) 0.52 8.6 –0.32 0.283 Val (V) –0.31 5.9 1.46 0.236 Trp (W) 0.3 5.4 1.53 0.300 Tyr (Y) 0.68 6.2 0.49 0.320 Phosphorylated Ser(pS) 0.202 Thr(pT) 0.163 Tyr(pY) 0.266
tion Mass Spectrometry. Proc. Nat. Acad. Sci. U.S.A. 2004, 101(26), 9528 –9533.
5. Coon, J. J.; Ueberheide, B.; Syka, J. E. P.; Dryhurst, D. D.; Ausio, J.; Shabanowitz, J.; Hunt, D. F. Protein Identification Using Sequential Ion/Ion Reactions and Tandem Mass Spectrometry. Proc. Nat. Acad. Sci.
U.S.A. 2005, 102(27), 9463–9468.
6. Budnik, B. A.; Nielsen, M. L.; Olsen, J. V.; Haselmann, K. F.; Horth, P.; Haehnel, W.; Zubarev, R. A. Can Relative Cleavage Frequencies in Peptides Provide Additional Sequence Information? Int. J. Mass
Spec-trom. 2002, 219(1), 283–294.
7. Breuker, K.; Oh, H. B.; Lin, C.; Carpenter, B. K.; McLafferty, F. W. Nonergodic and Conformational Control of the Electron Capture Dis-sociation of Protein Cations. Proc. Nat. Acad. Sci. U.S.A. 2004, 101(39), 14011–14016.
8. Adams, C. M.; Kjeldsen, F.; Zubarev, R. A.; Budnik, B. A.; Haselmann, K. F. Electron Capture Dissociation Distinguishes a Single D-Amino Acid in a Protein and Probes the Tertiary Structure. J. Am. Soc. Mass
Spectrom. 2004, 15(7), 1087–1098.
9. Oh, H.; Breuker, K.; Sze, S. K.; Ge, Y.; Carpenter, B. K.; McLafferty, F. W. Secondary and Tertiary Structures of Gaseous Protein Ions Character-ized by Electron Capture Dissociation Mass Spectrometry and Photo-fragment Spectroscopy. Proc. Nat. Acad. Sci. U.S.A. 2002, 99(25), 15863– 15868.
10. Lin, C.; Cournoyer, J. J.; O’Connor, P. B. Probing the Gas-Phase Folding Kinetics of Peptide Ions by IR Activated DR-ECD. J. Am. Soc. Mass
Spectrom. 2008, 19(6), 780 –789.
11. Savitski, M. M.; Kjeldsen, F.; Nielsen, M. L.; Zubarev, R. A. Comple-mentary Sequence Preferences of Electron-Capture Dissociation and Vibrational Excitation in Fragmentation of Polypeptide Polycations.
Angew. Chem. Int. Ed. 2006, 45(32), 5301–5303.
12. Ben Hamidane, H.; He, H.; Tsybin, O. Y.; Emmett, M. R.; Hendrickson, C. L.; Marshall, A. G.; Tsybin, Y. O. Periodic Sequence Distribution of Product Ion Abundances in Electron Capture Dissociation of Amphi-pathic Peptides and Proteins. J. Am. Soc. Mass Spectrom. 2009, 20(6), 1182–1192.
13. Polfer, N. C.; Haselmann, K. F.; Langridge-Smith, P. R. R.; Barran, P. E. Structural Investigation of Naturally Occurring Peptides by Electron Capture Dissociation and AMBER Force Field Modeling. Mol. Phys.
2005,103(11/12), 1481–1489.
14. Patriksson, A.; Adams, C.; Kjeldsen, F.; Raber, J.; van der Spoel, D.; Zubarev, R. A. Prediction of N–C␣ Bond Cleavage Frequencies in
Electron Capture Dissociation of Trp-Cage Dications by Force-Field Molecular Dynamics Simulations. Int. J. Mass Spectrom. 2006, 248(3), 124 –135.
15. Tsybin, Y. O.; Ben Hamidane, H.; Vorobyev, A.; Wodrich, M.; Cormin-boeuf, C. Peptide Conformation Selectivity in Electron Capture and Transfer Dissociation. Proceedings of the 57th ASMS Conference on Mass
Spectrometry and Allied Topics; Philadelphia, PA, June 2009.
16. Prell, J. S.; O’Brien, J. T.; Holm, A. I. S.; Leib, R. D.; Donald, W. A.; Williams, E. R. Electron Capture by a Hydrated Gaseous Peptide: Effects of Water on Fragmentation and Molecular Survival. J. Am. Chem.
Soc. 2008, 130(38), 12680 –12689.
17. Ben Hamidane, H.; Chiappe, D.; Hartmer, R.; Vorobyev, A.; Moniatte, M.; Tsybin, Y. O. Electron Capture and Transfer Dissociation: Peptide Structure Analysis at Different Ion Internal Energy Levels. J. Am. Soc.
Mass Spectrom. 2009, 20(4), 567–575.
18. Tsybin, Y. O.; Ben Hamidane, H.; Vorobyev, A.; Albrieux, F.; Antoine, R.; Calvo, F.; Chirot, F.; Lemoine, J.; Dugourd, P. A Systematic Ap-proach to Complementary Electron Capture Dissociation and Ion Mo-bility in Peptide Conformation Studies, unpublished.
19. Parks, B. A.; Jiang, L.; Thomas, P. M.; Wenger, C. D.; Roth, M. J.; Boyne, M. T.; Burke, P. V.; Kwast, K. E.; Kelleher, N. L. Top-Down Proteomics on a Chromatographic Time Scale Using Linear Ion Trap Fourier Transform Hybrid Mass Spectrometers. Anal. Chem. 2007, 79, 7984 – 7991.
20. Schaub, T. M.; Hendrickson, C. L.; Horning, S.; Quinn, J. P.; Senko, M. W.; Marshall, A. G. High-Performance Mass Spectrometry: Fourier Transform Ion Cyclotron Resonance at 14.5 Tesla. Anal. Chem. 2008,
80(11), 3985–3990.
21. Tsybin, Y. O.; Quinn, J. P.; Tsybin, O. Y.; Hendrickson, C. L.; Marshall, A. G. Electron Capture Dissociation Implementation Progress in Fourier Transform Ion Cyclotron Resonance Mass Spectrometry. J. Am. Soc.
Mass Spectrom. 2008, 19(6), 762–771.
22. Tsybin, Y. O.; Hendrickson, C. L.; Beu, S. C.; Marshall, A. G. Impact of Ion Magnetron Motion on Electron Capture Dissociation Fourier Trans-form Ion Cyclotron Resonance Mass Spectrometry. Int. J. Mass Spectrom.
2006,255, 144 –149.
23. Tsybin, Y. O.; He, H.; Emmett, M. R.; Hendrickson, C. L.; Marshall, A. G. Ion Activation in Electron Capture Dissociation to Distinguish Between N-Terminal and C-Terminal Productions. Anal. Chem. 2007, 79, 7596 – 7602.
24. Kjeldsen, F.; Savitski, M. M.; Adams, C. M.; Zubarev, R. A. Determina-tion of the LocaDetermina-tion of Positive Charges in Gas-Phase Polypeptide Polycations by Tandem Mass Spectrometry. Int. J. Mass Spectrom. 2006,
252(3), 204 –212.
25. Sun, Q. Y.; Nelson, H.; Ly, T.; Stoltz, B. M.; Julian, R. R. Side Chain Chemistry Mediates Backbone Fragmentation in Hydrogen Deficient Peptide Radicals. J. Proteome Res. 2009, 8(2), 958 –966.
26. Pazos, M.; Andersen, M. L.; Skibsted, L. H. Amino Acid and Protein Scavenging of Radicals Generated by Iron/Hydroperoxide System: An Electron Spin Resonance Spin Trapping Study. J. Agric. Food Chem. 2006,
54(26), 10215–10221.
27. Grantham, R. Amino-Acid Difference Formula to Help Explain Protein Evolution. Science 1974, 185(4154), 862– 864.
28. Creese, A. J.; Cooper, H. J. The Effect of Phosphorylation on the Electron Capture Dissociation of Peptide Ions. J. Am. Soc. Mass Spectrom. 2008,
19(9), 1263–1274.
29. Joly, L.; Antoine, R.; Allouche, A. R.; Dugourd, P. Formation and Spectroscopy of a Tryptophan Radical Containing Peptide in the Gas Phase. J. Am. Chem. Soc. 2008, 130(42), 13832–13833.
30. Belyayev, M. A.; Cournoyer, J. J.; Lin, C.; O’Connor, P. B. The Effect of Radical Trap Moieties on Electron Capture Dissociation Spectra of Substance P. J. Am. Soc. Mass Spectrom. 2006, 17(10), 1428 –1436. 31. Gasteiger, E.; Hoogland, C.; Gattiker, A.; Duvaud, S.; Wilkins, M. R.;
Appel, R. D.; Bairoch, A. Protein Identification and Analysis Tools on the ExPASy Server. In The Proteomics Protocols Handbook (Methods in
Molecular Biology), Walker, J. M., Ed.; Humana Press: Totowa, NJ, 2005;
pp 571– 607.
32. Hessa, T.; Kim, H.; Bihlmaier, K.; Lundin, C.; Boekel, J.; Andersson, H.; Nilsson, I.; White, S. H.; von Heijne, G. Recognition of Transmembrane Helices by the Endoplasmic Reticulum Translocon. Nature 2005,
433(7024), 377–381.
33. Kyte, J.; Doolittle, R. F. A Simple Method for Displaying the Hydro-pathic Character of a Protein. J. Mol. Biol. 1982, 157(1), 105–132. 34. Black, S. D.; Mould, D. R. Development of Hydrophobicity Parameters
to Analyze Proteins Which Bear Posttranslational or Cotranslational Modifications. Anal. Biochem. 1991, 193(1), 72– 82.
35. Zimmerman, J.; Eliezer, N.; Simha, R. Characterization of Amino Acid Sequences in Proteins by Statistical Methods. J. Theor. Biol. 1968, 21(2), 170–201.
36. Deleage, G.; Roux, B. An Algorithm for Protein Secondary Structure Prediction Based on Class Prediction. Protein Eng. 1987, 1(4), 289 –294. 37. Zhao, G.; London, E. An Amino Acid “Transmembrane Tendency”
Scale That Approaches the Theoretical Limit to Accuracy for Prediction of Transmembrane Helices: Relationship to Biological Hydrophobicity.
Protein Sci. 2006, 15(8), 1987–2001.
38. Bohorquez, H. J.; Obregon, M.; Cardenas, C.; Llanos, E.; Suarez, C.; Villaveces, J. L.; Patarroyo, M. E. Electronic Energy and Multipolar Moments Characterize Amino Acid Side Chains into Chemically Re-lated Groups. J. Phys. Chem. A 2003, 107(47), 10090 –10097.
39. Bhaskaran, R.; Ponnuswamy, P. K. Positional Flexibilities of Amino-Acid Residues in Globular-Proteins. Int. J. Pept. Protein Res. 1988, 32(4), 241–255.
40. Charton, M.; Charton, B. I. The Dependence of the Chou-Fasman Parameters on Amino-Acid Side-Chain Structure. J. Theor. Biol. 1983,
102(1), 121–134.
41. Dwyer, D. S. Electronic Properties of the Amino Acid Side Chains Contribute to the Structural Preferences in Protein Folding. J. Biomol.
Struct. Dynamics 2001, 18(6), 881– 892.
42. Cowan, R.; Whittaker, R. G. Hydrophobicity Indices for Amino Acid Residues as Determined by HPLC. Pept. Res. 1990, 3, 75– 80. 43. Pouthier, V.; Tsybin, Y. O. Amide-I Relaxation-Induced Hydrogen Bond
Distortion: An Intermediate in Electron Capture Dissociation Mass Spectrometry of␣-Helical Peptides? J. Chem. Phys. 2008, 129, 95–106. 44. Schlag, E. W.; Sheu, S. Y.; Yang, D. Y.; Selzle, H. L.; Lin, S. H. Distal
Charge Transport in Peptides. Angew. Chem. Int. Ed. 2007, 46(18), 3196 –3210.
45. Sheu, S. Y.; Schlag, E. W. Protein Charge Transport in Gas Phase. Int. J.
Mass Spectrom. 2002, 219(1), 73–77.
46. Hennig, D. Energy Transport in␣-Helical Protein Models: One-Strand Versus Three-Strand Systems. Phys. Rev. B 2002, 65(17).
47. Remacle, F.; Levine, R. D.; Schlag, E. W.; Weinkauf, R. Electronic Control of Site Selective Reactivity: A Model Combining Charge Migra-tion and DissociaMigra-tion. J. Phys. Chem. A 1999, 103(49), 10149 –10158.