Abstract A flow injection–capillary electrophoresis sys-tem with contactless conductivity detection and hydrostatic-pressure-generated flow was used for the fast and sensi-tive speciation of Se(IV) and Se(VI). The sample through-put was 25 samples per hour using a background elec-trolyte solution containing 8.75 mM L-histidine (His) ad-justed to pH 4.00 with acetic acid. The repeatability of peak areas (n=8) was better than 1.41% and the limits of detection were 190µg L–1 and 7.5µg L–1 for Se(IV) and Se(VI), respectively. The interference from carbonate, typically present in water samples, was eliminated by us-ing a low-pH electrolyte in which carbonate is uncharged and migrates at the EOF front. The method was applied to the analysis of Se(IV) and Se(VI) in soil samples that were spiked with both selenium species and the results for recovery of both selenium species were in good agree-ment with their introduced concentrations.
Keywords Flow injection analysis · Capillary electrophoresis · Contactless conductivity detection · Selenium · Inorganic anions · Speciation
Introduction
Selenium is generally recognized to be a trace mineral of great importance. It is a unique element in that there is a small margin of safety between levels of Se compounds
that will cause dietary deficiency and those that result in toxicity. It is found naturally in food and soils, the atmo-sphere, the aquatic environment and organisms. However a significant portion of the total selenium found in the en-vironment is anthropogenic. It is for instance used in elec-tronics, the manufacture of glass, drugs, as a fungicide and as a feed additive.
Selenium exists in both inorganic and organic forms. Inorganic forms of selenium include selenite and selenate anions, elemental selenium and sparingly soluble metal selenides. Organic selenium compounds, such as alkylse-lenides, selenoaminocarboxylic acids, selenium-contain-ing peptides and derivatives of nucleic acids are found in biological systems [1] and play important roles in cell biochemistry and nutrition. Their reactivity and bioavail-ability depends on the physicochemical form of existence and its concentration; inorganic selenium species are more toxic than organic species.
Selenates and selenites are among the most mobile Se compounds in the environment due to their high solubility in water and are characterized by high bioavailability to plants and animals. Se deficiency in soils, agricultural products and foodstuffs can cause serious diseases [2] and inorganic selenium compounds are often added to animal feeds and fertilizers in regions with selenium-deficient soils. The monitoring of the content of Se in the environ-ment and speciation of low concentrations of inorganic Se compounds is an important task, because it is the water-soluble, inorganic Se that contributes to the contamination of drinking and underground water sources.
Capillary electrophoresis (CE) proved to be an effi-cient tool in speciation analysis [3, 4] due to its high sep-aration efficiency and robustness to samples with compli-cated matrices, for instance bacterial suspensions [5]. Al-though coupling of CE with ICP-MS remains the main-stay in the electrophoretic selenium speciation/analysis due to its good sensitivity and selectivity [6, 7, 8, 9, 10], other detection methods such as UV [11, 12, 13, 14, 15, 16], fluorescence [17] or conductivity [18] can be alterna-tively used. Field-amplified sample stacking is often used to increase the detection sensitivity with UV methods [15, Pavel Kubáň · Petr Kubáň · Vlastimil Kubáň
Rapid speciation of Se(IV) and Se(VI)
by flow injection–capillary electrophoresis system
with contactless conductivity detection
DOI 10.1007/s00216-003-2207-4
Received: 16 May 2003 / Revised: 11 July 2003 / Accepted: 4 August 2003 / Published online: 11 September 2003
S H O RT C O M M U N I C AT I O N
P. Kubáň · P. Kubáň · V. Kubáň
Department of Chemistry and Biochemistry, Mendel University of Agriculture and Forestry, Brno, Czech Republic
P. Kubáň
Department of Chemistry and Biochemistry, Texas Tech University, Lubbock, TX, USA Present address:
P. Kubáň (✉)
Department of Chemistry, University of Basel, Spitalstrasse 51, 4004 Basel, Switzerland, e-mail: [email protected]
stacking and UV detection that are comparable to the flu-orescence [17] and direct conductivity [18] detection.
In this paper, a flow injection–capillary electrophoresis (FI-CE) system with contactless conductivity detection (CCD) is used for rapid, sensitive and selective speciation of inorganic selenium species. The method is then applied for quantitation of Se(IV) and Se(VI) in the spiked soil samples.
Experimental
Chemicals, solutions, samples and procedures
All chemicals were of reagent grade and deionised water was used throughout. Stock solutions (1 g L–1) of Se(IV) and Se(VI) were prepared from sodium selenite and sodium selenate decahydrate (both from Sigma-Aldrich, Steinheim, Germany), respectively. Stock solutions of other anions (1 g L–1) were prepared from the corresponding sodium or potassium salts (all chemicals were pur-chased from Pliva-Lachema Ltd., Brno, Czech Republic). All multi-ion standard solutions were then freshly prepared from these stock solutions.
The electrolyte solutions were prepared from 120 mM stock so-lution of L-histidine (His, Merck, Darmstadt, Germany). The pH of all His-based electrolyte solutions was adjusted with 4% or 10% (v/v) acetic acid (Pliva-Lachema Ltd., Brno, Czech Republic). For most of the analyses an electrolyte solution of pH 4.00 was used. All electrolyte solutions were degassed in an ultrasonic bath for 5 min prior to use.
Sample treatment
Aqueous samples and standard solutions were injected without any treatment except dilution. Soil samples were prepared as follows: 2 g of soil sample was mixed and homogenized with 2 mg of Se(IV) and 1 mg of Se(VI) and subsequently diluted in 1 L of deionised water. Solutions were stirred well and ultrasonicated for 30 min in an ultrasonic bath. The samples were filtered and small portions (typically 10 mL, used for the injection into the FI-CE system) were further filtered through a 0.45-µm nylon filter. A 9-mL por-tion of the filtered solupor-tion was mixed with 1 mL of 25 mg L–1 so-lution of NO2–(internal standard).
CE components
The CE part of the system comprised a high-voltage supply unit (Spellman CZE1000R, Spellman, USA) operated at a potential of 15 kV during all runs, a function generator (Model GFG 8219A, Goodwill Instruments Co. Ltd, Taiwan) providing a sinusoidal in-put signal to the detection cell of a contactless conductivity detec-tor of varying amplitude (typically 10 Vpp), peak to peak, and the contactless conductometric detector as described previously [19, 20, 21]. The function generator was operated at frequency of 290 kHz. The data were processed in a professional data system (CSW v. 1.7, Data Apex, Prague, Czech Republic). A polyimide-coated fused silica capillary (Supelco, Bellefonte, PA, USA; 50-µm i.d., 363-µm o.d.) of total length 65 cm was used; the effective capillary length from the injection end to the detection cell was 35 cm. The capillary was preconditioned with 1 M NaOH for 10 min, deionised water for 5 min, 1 M HCl for 10 min, deionised water for 10 min and finally with electrolyte solution for 15 min. Standard solutions in the electrolyte optimisation study were injected hydrodynami-cally (HD) by elevating one capillary end to the height of 20 cm
tion cell. The FI-CE interface was machined in a Plexiglass block (2×2×3 cm) as described elsewhere [22]. The flow rate of the elec-trolyte solution used in the FI system was 300µL min–1 and the volume of injected samples was 4µL.
Results and discussion
Choice of the background electrolyte for the separation of Se(IV), Se(VI) and other common inorganic anions
The electrophoretic separation of Se(IV) and Se(VI) with conductivity detection was previously demonstrated in al-kaline electrolytes containing 2-(cyclohexylamino)ethane-sulfonic acid (CHES) of pH 9.4, in which both species are fully ionised [18]. We have studied the electrophoretic be-haviour of a number of inorganic anions in acidic elec-trolytes containing His and acetic acid in the pH range 3–6 [23, 24, 25]. These electrolytes are suitable for the deter-mination of both fast-migrating anions (such as Cl–, NO
3–, SO42–) and slow-migrating anions (such as anions of or-ganic acids) without modification of the electroosmotic flow (EOF) as is commonly practiced in analysis of inor-ganic anions [26]. When electrophoretic speciation of Se(IV) and Se(VI) was performed in an alkaline back-ground electrolyte, serious problems were encountered due to the co-migration of Se(IV) and carbonate that is typically present in various aqueous samples in relatively high concentrations [12, 13]. One important property of acidic His-based electrolyte is that it efficiently eliminates the carbonate interference. At the pH used, carbonate is uncharged (pKa1=6.37, pKa2=10.25 [27]) and migrates at the EOF front and does not interfere with the determina-tion of other anions, including Se(IV).
Effect of pH of the electrolyte solution
A 10 mM concentration of His was initially chosen for the evaluation of different pH values on the migration order and behaviour of selected inorganic anions. The pH of the electrolyte solution was adjusted by addition of appropri-ate amount of 4% or 10% (v/v) acetic acid. Simultane-ously with Se(IV) and Se(VI), other anions were analysed (Cl–, SO
42–, NO3–, NO2–) that are likely to be present in the real samples. Nitrite was included in this set of anions as an internal standard for the quantitative analysis by the FI-CE system. A standard solution containing 15 mg L–1 of Se(IV) and 2.5 mg L–1 of another five anions was pre-pared and used in all experiments.
Figure 1 shows the effect of pH in the range 3.5–5.5. The electrophoretic behaviour of Cl–, NO
3–, SO42– and Se(VI) is similar in the whole pH range and the migration times decrease slightly with decreasing pH due to the de-crease in the EOF velocity. The pH of the electrolyte does not influence the charge of these anions, since they all are
anions of strong acids (for instance, the pKa2 of selenic acid is 1.92 [27]). Since the electrolyte does not contain any EOF modifier, the anions migrate against the EOF. Lowering the pH will cause the EOF decrease due to the protonation of the capillary wall and consequently the ef-fective velocity of the anions will increase.
The behaviour of selenite and nitrite was significantly different from that observed for other anions. The migra-tion time for selenite in the studied pH range was about twice the migration time of selenate, which indicates that it migrates as a monovalent anion, HSeO3–. This observa-tion is in agreement with the pKavalues for selenious acid (pKa1=2.46, pKa2=7.31 [27]) and indeed in the pH range 3.5–5.5 the dominant Se(IV) species is HSeO3–. Similarly the migration behaviour of NO2– can be explained by us-ing the pKaof nitrous acid (pKa=3.37 [27]) and the effec-tive ionic mobility and acid–base equilibria according to ref. [28]. The shortest migration times of Se(IV) were achieved in the pH range 4.25–3.5. When resolution of sulfate and Se(VI) and the resolution of Se(VI) and NO2– were considered, the best results (Rs≥1.7) were achieved at pH 4.00 and therefore this pH was used in further opti-misation procedures.
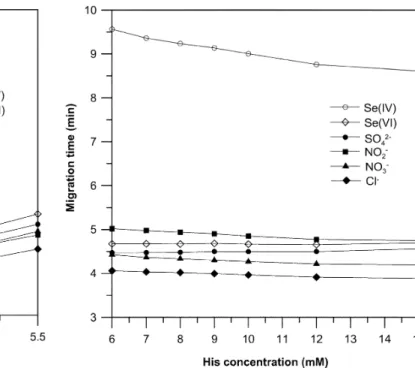
Effect of His concentration
The effect of the concentration of His in the electrolyte solution on separation selectivity of selenium species and other anions was studied in the range 6–15 mM. The pH of each electrolyte solution was adjusted to 4.00 with 10% (v/v) acetic acid.
The results are presented in Fig. 2. Partial co-migration of Se(VI) and SO42– and Se(VI) and NO2–occurred in the electrolyte solutions containing concentrations of His higher than 12 mM. The concentration of His below 7 mM re-sulted in co-migration of nitrate and sulfate peaks, and ad-ditionally the peak shape of Se(IV) was slightly deterio-rated. The optimal concentration of His was found to be 8.75 mM. The electrolyte solution consisting of 8.75 mM His adjusted to pH 4.00 with acetic acid was used for the quantitative determination of both selenium species with the FI-CE system.
Parameters of the method for FI-CE determination of Se(IV) and Se(VI)
For the determination of inorganic selenium species an FI-CE system with hydrostatic-pressure-generated flow was used [23]. This system allows automated, repeated in-jections of samples in one electrophoretic run that results in lowering the total analysis time. Further, on-line sam-pling from a solution can be performed in an automated fashion by using an FI-CE system and may be useful in monitoring studies such as sorption or bacterial intake/re-duction of selenium anions [5].
First we evaluated the repeatability of the FI-CE sys-tem by sequential injections of a standard solution con-taining 15 mg L–1of Se(IV) and 2.5 mg L–1of another five inorganic anions. The injection-overlapping technique de-scribed in ref. [29] was used to increase the sample throughput. Briefly, the injection of a subsequent sample
Fig. 1 The effect of the pH on the migration behaviour of selected
anions. Electrolyte composition 10 mM His; separation voltage + 15 kV; hydrodynamic injection, capillary end elevated to a height of 20 cm for 20 s
Fig. 2 The effect of the concentration of His on migration
behav-iour of selected anions. Electrolyte pH 4.00 (adjusted with 10% (v/v) acetic acid). Injection and separation conditions for anions are the same as in Fig. 1
can be performed before all the analytes from the previous injection had migrated through the detector. Thus, four in-jections of the standard solution containing six anions were performed every 62 s. Then, the injection sequence was interrupted for 255 s, the time needed for the slowest analyte (Se(IV)) from the previous four injections to mi-grate through the detection cell. A typical electrophero-gram of eight consecutive injections of standard solution is depicted in Fig. 3. Note that peak 6 (Se(IV)), belonging to the first injection, appears after the five peaks that be-long to the fourth injection. The sample throughput using this injection technique was calculated to be 25 samples per hour, which represents approximately three- to five-fold reduction in analysis time compared to the previously published methods [12, 13, 18].
The parameters of the method for the determination of Se(IV) and Se(VI) are summarized in Table 1. The re-peatability was evaluated as the relative standard devia-tion (RSD) of peak heights (PH) and peak areas (PA) for eight consecutive injections of standard solution. The RSD values were better than 1.5% and 1.4% for the peak height and peak area, respectively. An internal standard (IS) method was used for quantitative evaluation to com-pensate for the bias in the electrokinetic injection
intro-duced in the FI-CE system [23]. The relationship between the concentration and IS-corrected peak area was calculated for both selenium species. The calibration curves (using NO2–as IS) were found to be linear (five point calibration, r2=0.9997 and 0.9998, respectively) over the range 1– 15 mg L–1 for Se(IV) and 0.165–2.5 mg L–1 for Se(VI).
The limit of detection (LOD) values, defined as the con-centration of analyte giving a signal equal to three times the standard deviation for the blank (3 S/N) were esti-mated for Se(IV) and Se(VI). The LOD values were ob-tained through repetitive runs of model solutions, which were diluted with deionised water in steps until the condi-tion of the LOD definicondi-tion was fulfilled. The standard de-viation calculation for the blank was based on more than 100 data points. The LODs are summarized in Table 1.
Analysis of soil samples
The method for the determination of Se(IV) and Se(VI) was applied to the analysis of pretreated soil samples (see “Experimental” section) that were spiked with both inor-ganic selenium species and internal standard (IS).
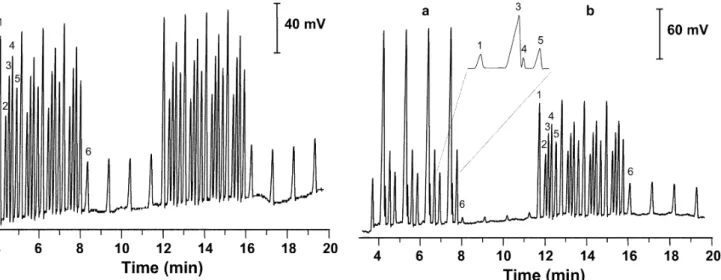
The concentrations of both selenium species were cal-culated. Four consecutive injections of a soil sample spiked with Se(IV) and Se(VI) (panel a) and four injec-tions of a standard solution (panel b) used for the quanti-tative analysis are depicted in Fig. 4.
The results obtained for the two selenium species by the FI-CE system were in good agreement with the con-centrations introduced into the samples; the recovery for the Se(IV) and Se(VI) was 90–98% and 96–101% (n=4), respectively. The method allowed precise determination of both selenium species in the presence of other inor-ganic anions and can potentially be used for the rapid screening of inorganic selenium in soil samples.
Table 1 Analytical parameters for the determination of Se(IV)
and Se(VI)a Anion RSD (%), n=8 RSD (%), n=8 LOD r2 (µg L–1) PH PA PH (IS)b PA (IS) Se(IV) 1.1 1.41 1.5 1.13 190 0.9997 Se(VI) 0.57 1.26 0.68 0.66 7.5 0.9998 aConcentration of anions is 2.5 mg L–1 except Se(IV), 15 mg L–1 bPH (IS) and PA (IS) are the corrected peak height and peak area calculated using internal standard (NO2–), respectively
Fig. 3 FI-CE determination of Se(IV) and Se(VI) and common
in-organic anions. Concentration of Se(IV) 15 mg L–1,concentration of all other anions 2.5 mg L–1. Electrolyte composition 8.75 mM His, pH 4.00, separation voltage + 15 kV. Peak description: 1 chlo-ride, 2 nitrate, 3 sulfate, 4 selenate, 5 nitrite (IS), 6 selenite
Fig. 4a,b FI-CE analysis of Se(IV) and Se(VI) in spiked soil
sam-ple (a) and analysis of standard solution (b) for the quantitative de-termination of selenium species in soil sample. CE and FI condi-tions are the same as in Fig. 3
Adsorption of Se(IV) and Se(VI) onto soil particles
The presence of Se(IV) and Se(VI) species in alkaline and acidic soils, respectively, and fast equilibrium establish-ment among selenium species (Se(II), Se(0), Se(IV) and Se(VI)) and fast and irreversible sorption of Se species on Mn and Fe sesquioxides in soils were reported [30, 31]. In a preliminary study the adsorption of both selenium spe-cies onto the soil particles was investigated. The dissolved soil sample spiked with Se(IV) and Se(VI) was stirred us-ing a magnetic stirrer for 24 h and five samples were taken at different times. The first sample was taken at 30 min and the next samples 1, 2.5, 4 and 24 h after the spiked soil was dissolved. The sample was filtered using an in-line filter, mixed with an internal standard and injected in the FI-CE interface. Concentrations of Se(IV) and Se(VI) were calculated. However, it was found that no adsorption of selenium species occurred within 24 h. The adsorption of selenium anions depends on the type of soil and pH. For instance kaolinite, montmorillonite and calcite-con-taining soils were shown to readily adsorb selenium an-ions [32]. An on-line monitoring of sorption of Se in dif-ferent types of soil using the FI-CE system is underway.
Conclusions
The proposed flow injection–capillary electrophoresis sys-tem with contactless conductivity detection and hydrosta-tic-pressure-generated flow provides a sensitive, rapid and inexpensive method for speciation of Se(IV) and Se(VI) and simultaneous determination of other common inor-ganic anions. The interference from carbonate typically present in water samples is eliminated by using a low-pH electrolyte, in which carbonate is uncharged and migrates at the EOF front. The system can potentially be used for on-line sampling and allow continuous monitoring of the content of inorganic selenium species, as required for in-stance in oxidation/reduction studies or determination of the adsorption rate of the analytes.
Acknowledgements The financial support from the Grant Agency
of the Ministry of Education, Youth and Sports of the Czech Re-public (MŠMT ČR, Grant Reg. No. MSM 432100001) is grate-fully acknowledged.
References
1. Pyrzynska K (2001) Talanta 55:657–667
2. Reilly C (1996) Selenium in food and health. Blackie Acade-mic and Professional, London, UK
3. Timerbaev AR, Dabek-Zlotorzynska E, van den Hoop MAGT (1999) Analyst 124:811–826
4. Timerbaev AR (2000) Talanta 52:573–606
5. Walker EB, Walker JC, Zaugg SE, Davidson R (1996) J Chro-matogr A 745:111–115
6. Polec-Pawlak K, Jarosz M (2002) Chem Anal (Warsaw) 47: 783–805
7. Casiot C, Donard OFX, Potin-Gautier M (2002) Spectrochim Acta B 57:173–187
8. Mounicou S, McSheehy S, Szpunar J, Potin-Gautier M, Lobin-ski R (2002) J Anal At Spectrom 17:15–20
9. Bendahl L, Gammelgaard B, Jons O, Farver O, Hansen SH (2001) J Anal At Spectrom 16:38–42
10. Michalke B, Schramel P (1998) J Chromatogr A 807:71–80 11. Casiot C, Baricela Alonso MC, Boisson J, Donard OFX,
Potin-Gautier M (1998) Analyst 123:2887–2893
12. Dziergowska M, Pyrzynska K, Pobozy E (2003) J Chromatogr A 984:291–295
13. Gilon N, Potin-Gautier M (1996) J Chromatogr A 732:369–376 14. Liu W, Lee HK (1998) J Chromatogr A 796:385–395 15. Liu W, Lee HK (1999) Electrophoresis 20:2475–2483 16. Li K, Li SFY (1995) Analyst 120:361–366
17. Chang SY, Chiang HT (2002) Electrophoresis 23:2913–2917 18. Schlegel D, Mattusch J, Wennrich R (1996) Fresenius J Anal
Chem 354:535–539
19. Zemann AJ, Schnell E, Volgger D, Bonn GK (1998) Anal Chem 70:563–567
20. Fracassi da Silva JA, do Lago CL (1999) Anal Chem 70:4339– 4343
21. Kubáň P, Karlberg B, Kubáň P, Kubáň V (2002) J Chromatogr A 964:227–241
22. Kubáň P, Karlberg B (1998) Talanta 45:477–484
23. Kubáň P, Kubáň P, Kubáň V (2002) Electrophoresis 24:1935– 1943
24. Kubáň P, Kubáň P, Kubáň V (2003) Electrophoresis 23:3725– 3734
25. Kubáň P, Kubáň P, Kubáň V (2003) Electrophoresis 24:1397– 1403
26. Jandik P, Jones WR (1991) J Chromatogr 546:431–445 27. CRC handbook of chemistry and physics, 55th edn (1975)
CRC Press, USA
28. Foret F, Krivankova L, Bocek P (1993) Capillary zone electro-horesis. VCH Weiheim, Germany, pp 15–19
29. Kubáň P, Engström A, Olsson JC, Thorsén G, Karlberg B (1997) Anal Chim Acta 337:117–124
30. Beneš S (1994) Contents and distribution of elements in envi-ronment, vol 2. UZPI Prague
31. Sima P, Gissel-Nielsen G (1985) Acta Agric Scand 35:161– 165