ORIGINAL ARTICLE
Comparative trends in hospitalizations for osteoporotic
fractures and other frequent diseases between 2000 and 2008
K. Lippuner&S. Grifone&M. Schwenkglenks&
P. Schwab&A. W. Popp&C. Senn&R. Perrelet
Received: 7 March 2011 / Accepted: 2 May 2011 / Published online: 28 May 2011 # International Osteoporosis Foundation and National Osteoporosis Foundation 2011 Abstract
Summary In Switzerland, the number, incidence, and cost of acute hospitalizations for major osteoporotic fractures (MOF) and major cardiovascular events (MCE) increased in both women and men between 2000 and 2008, although the mean length of stay (LOS) was significantly reduced. Similar trend patterns were observed for hip fractures and strokes (decrease) and nonhip fractures and acute myocardial infarctions (increase).
Introduction The purpose of this study was to compare the trends and epidemiological characteristics of hospitalizations for MOF and other frequent diseases between years 2000 and 2008 in Switzerland.
Methods Trends in the number, age-standardized incidence, mean LOS, and cost of hospitalized MOF and MCE (acute myocardial infarction, stroke, and heart failure) were
compared in women and men aged ≥45 years, based on
data from the Swiss Federal Statistical Office.
Results Between 2000 and 2008, the incidence of acute hospitalizations for MOF increased by 3.4% in women and
0.3% in men. In both sexes, a significant decrease in hip fractures (−15.0% and −11.0%) was compensated by a concomitant, significant increase in nonhip fractures (+24.8% and +13.8%). Similarly, the incidence of acute hospitalizations for MCE increased by 4.4% in women and 8.2% in men, as an aggregated result from significantly increasing acute myocardial infarctions and significantly decreasing strokes. While the mean LOS in the acute inpatient setting decreased almost linearly between years 2000 and 2008 in all indications, the inpatient costs increased significantly (p<0.001) for MOF (+30.1% and +42.7%) and MCE (+22.6% and +47.1%) in women and men, respectively.
Conclusions Between years 2000 and 2008, the burden of hospitalized osteoporotic fractures to the Swiss healthcare system has continued to increase in both sexes. In women, this burden was significantly higher than that of MCE and the gap widened over time.
Keywords Acute myocardial infarction . Breast cancer . Chronic obstructive pulmonary disease . Clinical spine fracture . Cost . Distal radius fracture . Epidemiology . Heart failure . Hip fracture . Osteoporosis . Proximal humerus fracture . Stroke . Switzerland
Introduction
Osteoporotic fractures are one of the leading causes of
morbidity and mortality in industrialized countries [1].
While virtually any fracture may result as a complication
from underlying osteoporosis, “typical” osteoporotic
frac-tures occur at the hip, spine, distal forearm, and proximal humerus. Together, they are traditionally referred to as
major osteoporotic fractures (MOF) [1–3].
K. Lippuner (*)
:
S. Grifone:
A. W. Popp:
C. Senn:
R. Perrelet Osteoporosis Policlinic, Inselspital,Bern University Hospital and University of Bern, CH-3010 Bern, Switzerland
e-mail: kurt.lippuner@insel.ch M. Schwenkglenks
Institute of Pharmaceutical Medicine/ECPM, University of Basel, Basel, Switzerland
M. Schwenkglenks
Institute of Social and Preventive Medicine, Bern, Switzerland
P. Schwab
Swiss Federal Statistical Office, Neuchâtel, Switzerland
In year 2000, in all women living in Switzerland, the overall incidence of hospitalizations for any osteoporotic fracture was twice as high as that for breast cancer and pooled major cardiovascular events (MCE: acute myocardial infarction, stroke, and heart failure) and almost three times that of chronic
obstruc-tive pulmonary disease (COPD) [4]. In Swiss men, the
overall incidence of hospitalizations for any osteoporotic fracture was half that of pooled MCE and two thirds that
of COPD [4]. As recently published, the age-standardized
incidences of hospitalized MOF continued to increase in Swiss women and men aged 45 years and older between the years 2000 and 2007, driven by an increasing number and incidence of hospitalizations for nonhip fractures, although the number of hip fractures was on the decline
[5].
The aim of the present analysis was to compare the trends and epidemiological characteristics, in female and male patients aged 45 years or older, of MOF, MCE, COPD, and breast carcinoma (women only) in Switzerland, between the years 2000 and 2008. Predefined parameters of interest were absolute number and incidence of hospital-izations, number of hospital days due to fractures, and cost of hospitalizations.
Methods
A summary of the data processing flow and relevant data
sources is shown in Fig.1.
Selected ICD-10 codes
Diseases were selected according to the 10th Edition of the International Classification of Diseases (ICD-10)
issued by the World Health Organization [6]. MOF were
divided into two categories: hip (ICD-10 codes S72.0 (fracture of the femoral neck), S72.1 (pertrochanteric fracture), and S72.2 (subtrochanteric fracture)) and non-hip. Nonhip fractures were defined as: spine fractures coded as S22.0 (fracture of the thoracic spine), S22.1 (multiple fractures of the thoracic spine), S32.0 (fracture of the lumbar spine), S32.7 (multiple fractures of the lumbar spine), and S32.8 (other fractures of the lumbar spine); fractures of the distal forearm coded as S52.5 (fracture of the distal radius) and S52.6 (combined fracture of the distal radius/ulna); fractures of the proximal humerus coded as S42.2 (fracture of the proximal humerus).
MCE were defined as myocardial infarction coded as I21 (acute myocardial infarction) and I22 (subsequent myocar-dial infarction); stroke coded as I63 (cerebral infarction), I64 (stroke, not specified as hemorrhage or infarction), I65 (occlusion and stenosis of precerebral arteries, not resulting in cerebral infarction), and I66 (occlusion and stenosis of cerebral arteries, not resulting in cerebral infarction); heart failure coded as I50 (heart failure). COPD were defined as codes J40 (bronchitis, not specified as acute or chronic), J41 (simple and mucopurulent chronic bronchitis), J42 (unspecified chronic bronchitis), J43 (emphysema), J44 (other COPD), J45 (asthma), J46 (status asthmaticus), and
Selected ICD-10 codes (primary diagnosis only)
Major osteoporotic fractures Hip fractures (S72.0, S72.1, S72.2) Non-hip fractures
Spine fractures
(S22.0, S22.1, S32.0, S32.7, S32.8) Distal radius fractures (S52.5, S52.6) Proximal humerus fractures (S42.2)
Major CV events
Acute myocardial infarction (I21 and I22) Stroke (I63 to I66)
Heart failure (I50) COPD (J40 to J47)
Breast carcinoma (C50)
SFSO hospital database: Number of hospitalizations Number of days of hospitalization
( by ICD-10 code, by 10-year age groups, by sex, and by year between 2000 and 2008. Restricted to Swiss acute hospital settings)
SFSO population database: Swiss population structure (by 10-year age groups and by sex, in years 2000 through 2008)
Outcomes by ICD-10 code between year 2000 and 2008 Incidences by 10-year age group and sex Age-standardized incidences
Mean length of hospital stay (LOS) Cost of hospitalizations in the acute setting
SFSO standard tables: Mean cost per day of hospitalization in the Swiss acute care setting (in years 2000 through 2008)
Fig. 1 Data sources and data processing flow. SFSO Swiss Federal Statistical Office, ICD International Classification of Diseases, COPD chronic obstructive pulmonary diseases
J47 (bronchiectasis). Breast carcinoma corresponded to the ICD-10 code C50 (malignant neoplasm of breast).
Source of hospital statistics
The administrative and medical statistics database of the Swiss Federal Statistical Office (SFSO) was used. All Swiss acute care hospitals, rehabilitation centers, and specialized clinics are obliged to supply their medical data to the SFSO (age, sex, number of hospitalizations coded according to the ICD-10 requirements, and duration of hospitalization). Data collection is coordinated by the SFSO. Data consistency and quality are ensured at the individual hospital, cantonal, and federal level through the mandatory use of a
plausibil-ity testing software developed by the SFSO [7]. This
software performs more than 700 plausibility checks on single and pooled variables, including multiple interdepen-dent variable testing and diagnostic code vs. treatment code testing. Inconsistencies and errors indicated in the log files are corrected at the appropriate level (individual hospital for source data, canton for inconsistencies across hospitals, and confederation for inconsistencies across cantons) following a feedback loop. This process ensures low error rates so that the level of plausibility of the reported diagnostic codes
exceeds 95% [8]. Only medical data from Swiss acute
hospital settings were retained for the present analysis. Data from rehabilitation centers and specialized clinics were excluded to prevent double counting. The degree of completeness for all records for years 2000 to 2008 was 81.2%, 84.9%, 95.0%, 94.1%, 96.2%, 98.2%, 98.5%, 98.6%, and 98.8%, respectively.
Raw data for the number of hospitalizations for the selected ICD-10 codes and corresponding duration of
hospi-talization were obtained for women and men aged≥45 years.
Only the primary diagnostic code, i.e., the reason for hospitalization, was considered for each patient to prevent double counting. All raw data were extrapolated pro rata to 100% to compensate for incomplete coverage and to become representative for Switzerland as a whole.
Data on the Swiss population structure between 2000 and 2008, split by 10-year age groups and sex, were also obtained from the SFSO.
Epidemiological characteristics of hospitalizations
The age-standardized incidence of hospitalizations, the number of patient-days spent in hospital, and the mean hospital length of stay (LOS) per patient were calculated by 10-year age groups starting from age 45 onwards and by sex for all selected ICD-10 codes grouped into the categories defined above. Annual crude incidences and 95% confidence intervals per 100,000 persons in years 2000 to 2008 were calculated by sex and 10-year age groups
starting from age 45 onwards. Annual age-standardized incidences per 100,000 persons and 95% confidence intervals were calculated by sex based on 10-year age groups and adjusted for the age structure of the Swiss population in year 2000 according to a method published
earlier [9]. Standardized incidence rate ratios and 95%
confidence intervals were calculated to assess the change in incidence over time. As the goodness-of-fit of tentative Poisson regression models could not be confirmed, related time trends were assessed by fitting gender-specific negative binomial models with ICD-10 code and year as covariates.
The mean hospital LOS was estimated by dividing the total number of patient-days spent in hospital by the number of hospitalizations. The cost of hospitalizations was estimated by multiplying the number of patient-days spent in hospital by the yearly average cost of 1 day in hospital in Swiss Francs (CHF) between 2000 and 2008. The latter was obtained from yearly summary tables derived from the hospital statistics database of the SFSO for each
year of analysis and was not inflation adjusted [10]. The
effects of time on mean LOS and hospitalization cost were tested for statistical significance by the two-way analysis of variance method. All calculations were done with the statistical software StatsDirect version 2.7.8 (StatsDirect Ltd., Altrincham, Cheshire, UK). Negative binomial re-gression was performed in Stata/MP version 11.1 (Stata Corporation, College Station, TX, USA).
Results
Swiss population structure
Between years 2000 and 2008, the number of women and men aged 45 years and older increased by 13.3% and 17.4%, respectively.
Number of hospitalizations
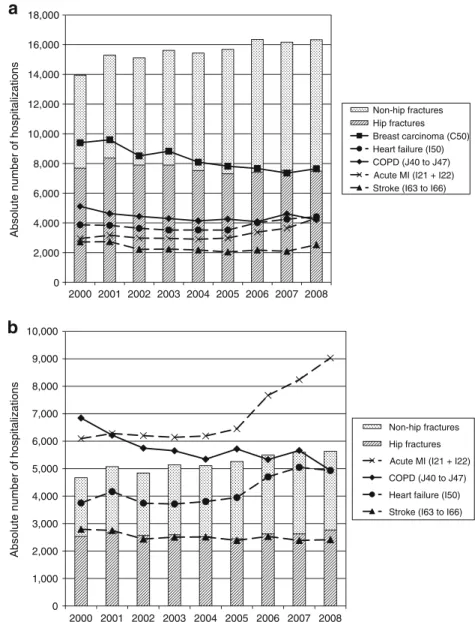
Between 2000 and 2008, the absolute number of acute care
hospitalizations for MOF in patients aged ≥45 years
increased from 13,948 to 16,339 (+17.1%) in women and from 4,670 to 5,634 (+20.6%) in men, essentially driven by nonhip fractures (+41.3% and +34.6%, respectively)
(Fig.2). During the same time, the number of hip fractures
decreased from 7,684 to 7,485 (−2.6%) in women and remained stable in men (from 2,538 to 2,765, +1%). Similarly, the number of hospitalizations for MCE in-creased from 9,530 to 11,271 (+18.3%) and from 12,634 to 16,378 (+29.6%) in women and men, respectively. In contrast, the number of hospitalizations for COPD
4,934 (−27.9%) in women and men, respectively. Finally, the number of hospitalizations for breast cancer decreased
from 9,400 to 7,650 (−18.6%) in women.
Age-standardized incidence of hospitalizations
In women, as shown in Table 1, the age-standardized
incidence of hospitalized MOF increased by 3.4% between 2000 and 2008 (p for trend, 0.121), the significant decrease in hip fractures (−15.0%; p for trend, <0.001) being fully compensated by a concomitant significant increase in hospitalized nonhip fractures (+24.8%; p for trend, 0.002). The latter resulted from an increase in hospitalized fractures of the spine (+32.2%; p for trend, 0.008), the distal radius (+31.8%; p for trend, 0.005), and the proximal humerus (+10.3%, p for trend, 0.141). Similarly, the incidence of acute hospitalizations for MCE increased by 4.4% (p for trend, 0.558) during the observation period, as an
aggre-gated result of a significant increase in acute myocardial infarctions (+29.5%; p for trend, 0.016) opposed by a
significant decrease in hospitalized strokes (−17.8%; p for
trend, 0.016), and with no change in the incidence of hospitalizations for heart failure (+0.8%; p for trend, 0.926). Finally, the incidence of hospitalizations for COPD and breast cancer decreased significantly by 27.3% (p for trend, 0.016) and 28.2% (p for trend, <0.001), respectively.
In men, as shown in Table 1, the incidence of
hospitalized MOF did not change between 2000 and 2008 (+0.3%; p for trend, 0.918). The significant reduction in incident hip fractures (−11.0%; p for trend, 0.031) was totally offset by a significant increase in nonhip fractures (+13.8%; p for trend, 0.032), mainly driven by fractures of the distal radius (+29.2%; p for trend, <0.001) and the proximal humerus (+12.5%; p for trend, 0.295). The incidence of acute hospitalizations for MCE increased significantly by 8.2% (p for trend, 0.019).
0 2,000 4,000 6,000 8,000 10,000 12,000 14,000 16,000 18,000 2000 2001 2002 2003 2004 2005 2006 2007 2008 2000 2001 2002 2003 2004 2005 2006 2007 2008
Absolute number of hospitalizations
Non-hip fractures Hip fractures Breast carcinoma (C50) Heart failure (I50) COPD (J40 to J47) Acute MI (I21 + I22) Stroke (I63 to I66)
0 1,000 2,000 3,000 4,000 5,000 6,000 7,000 8,000 9,000 10,000
Absolute number of hospitalizations
Non-hip fractures Hip fractures Acute MI (I21 + I22) COPD (J40 to J47) Heart failure (I50) Stroke (I63 to I66)
a
b
Fig. 2 Number of acute carehospitalizations in women (a) and men (b) for selected diseases between years 2000 and 2008
T able 1 Age-standardized incidence of hospitalizations per 100,000 women and men aged 45 years or more (95% confidence interval) 2000 2001 2002 2003 2004 2005 2006 2007 2008 Incidence rate ratio 2008 vs. 2000 (95% CI) W omen Major osteoporotic fractures 901 (886 –916) 976 (961 –992) 955 (940 –970) 965 (950 –980) 942 (928 –957) 942 (927 –956) 964 (949 –978) 933 (919 –948) 925 (91 1– 939) 1.03 (1.00 –1.05) Hip fractures 496 (485 –507) 535 (524 –546) 500 (489 –51 1) 488 (478 –499) 460 (450 –471) 439 (429 –449) 435 (425 –445) 433 (423 –443) 421 (41 1– 430) 0.85 (0.82 –0.87) Nonhip fractures 405 (395 –415) 441 (431 –452) 455 (444 –465) 477 (466 –488) 482 (471 –493) 503 (492 –513) 529 (518 –540) 500 (490 –51 1) 504 (494 –515) 1.25 (1.21 –1.29) Spine fractures 84 (79 –88) 93 (88 –97) 93 (88 –98) 95 (90 –100) 91 (86 –95) 95 (90 –98) 97 (92 –102) 107 (102 –1 12) 1 10 (105 –1 15) 1.32 (1.23 –1.41) Distal radius fractures 187 (180 –194) 207 (200 –214) 216 (209 –223) 240 (233 –248) 236 (299 –244) 263 (255 –271) 276 (268 –284) 246 (238 –253) 246 (239 –254) 1.32 (1.26 –1.38) Proximal humerus fractures 134 (128 –140) 141 (135 –147) 145 (139 –151) 141 (136 –147) 155 (149 –161) 145 (139 –150) 156 (150 –161) 148 (142 –154) 148 (142 –153) 1.10 (1.04 –1.17) Major CV events 615 (603 –628) 622 (610 –634) 558 (546 –569) 539 (527 –550) 525 (514 –536) 514 (503 –525) 564 (552 –575) 577 (565 –590) 639 (627 –651) 1.04 (1.01 –1.07) Acute myocardial infarction 190 (183 –197) 202 (195 –209) 188 (181 –194) 183 (176 –189) 177 (170 –183) 179 (173 –186) 200 (193 –206) 21 1 (204 –218) 246 (239 –254) 1.29 (1.23 –1.36) Stroke 175 (169 –182) 175 (168 –181) 140 (134 –146) 138 (132 –144) 132 (127 –138) 123 (1 18 –128) 128 (123 –133) 121 (1 16 –126) 143 (138 –149) 0.82 (0.78 –0.86) Heart failure 250 (242 –258) 245 (237 –253) 230 (223 –237) 218 (21 1– 225) 215 (208 –222) 21 1 (205 –218) 236 (229 –243) 245 (238 –252) 249 (242 –257) 1.00 (0.96 –1.04) COPD 330 (321 –339) 295 (286 –303) 279 (271 –287) 265 (257 –273) 252 (244 –260) 256 (248 –263) 241 (234 –249) 268 (261 –276) 241 (234 –248) 0.73 (0.70 –0.76) Breast carcinoma 607 (595 –619) 612 (600 –624) 535 (523 –546) 546 (535 –557) 493 (483 –504) 470 (459 –480) 453 (443 –463) 428 (419 –438) 438 (428 –447) 0.72 (0.70 –0.74) Men Major osteoporotic fractures 351 (341 –361) 375 (364 –385) 351 (341 –361) 366 (353 –373) 354 (344 –364) 356 (347 –366) 362 (353 –372) 360 (350 –369) 352 (343 –361) 1.00 (0.96 –1.04) Hip fractures 191 (183 –198) 197 (189 –204) 186 (179 –193) 182 (175 –189) 174 (168 –181) 164 (158 –171) 176 (164 –178) 166 (160 –172) 170 (163 –176) 0.89 (0.84 –0.94) Nonhip fractures 160 (153 –167) 178 (171 –185) 165 (158 –171) 181 (174 –188) 180 (173 –187) 192 (185 –199) 191 (184 –198) 194 (187 –201) 182 (175 –189) 1.14 (1.07 –1.20) Spine fractures 64 (60 –68) 67 (63 –72) 60 (56 –64) 66 (62 –70) 67 (63 –71) 65 (61 –69) 67 (63 –71) 74 (70 –79) 67 (63 –71) 1.04 (0.95 –1.14) Distal radius fractures 48 (44 –51) 53 (49 –57) 55 (51 –58) 61 (57 –65) 58 (54 –62) 64 (60 –68) 68 (63 –72) 63 (59 –67) 62 (58 –66) 1.29 (1.17 –1.43) Proximal humerus fractures 48 (45 –52) 57 (53 –61) 51 (47 –54) 54 (50 –58) 55 (51 –59) 63 (59 –67) 57 (53 –61) 57 (53 –60) 54 (50 –57) 1.1 1 (1.00 –1.23) Major cardiovascular events 949 (932 –965) 972 (956 –989) 896 (880 –912) 873 (857 –888) 865 (850 –880) 864 (850 –879) 984 (969 –1,000) 1,009 993 –1,024) 1,027 (1,01 1– 1,042) 1.08 (1.06 –1.1 1) Acute myocardial infarction 458 (446 –469) 463 (452 –474) 449 (438 –460) 435 (424 –445) 429 (419 –440) 438 (427 –448) 510 (498 –521) 535 (523 –546) 571 (560 –583) 1.25 (1.21 –1.29) Stroke 210 (202 –217) 203 (195 –210) 176 (169 –183) 177 (170 –184) 173 (167 –180) 161 (155 –168) 167 (160 –173) 153 (147 –159) 151 (145 –157) 0.72 (0.68 –0.76) Heart failure 281 (272 –290) 307 (298 –316) 271 (262 –280) 261 (253 –270) 262 (253 –270) 266 (257 –274) 308 (299 –316) 321 (312 –330) 305 (296 –313) 1.08 (1.04 –1.13) COPD 514 (502 –526) 458 (447 –469) 415 (404 –426) 399 (388 –409) 369 (359 –379) 386 (376 –396) 353 (343 –362) 365 (355 –374) 310 (301 –319) 0.60 (0.58 –0.63)
Interestingly, this overall increase resulted from an increase in hospitalizations for myocardial infarctions (+24.7%; p for trend, <0.001) and heart failure (+8.5%; p for trend, 0.208) opposed by a significant reduction in the incidence of stroke (−28.1%; p for trend, 0.006). Finally, incident hospitalizations for COPD were signifi-cantly reduced by 39.7% (p for trend, 0.002).
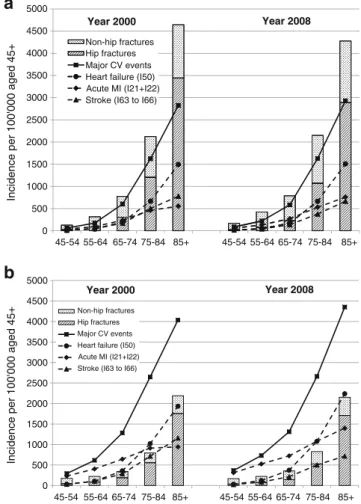
The overall pattern of changes in age-standardized incidences was consistent across sexes: decreasing inciden-ces of hospitalizations for hip fractures and stroke, increasing incidences in hospitalizations for nonhip MOF and acute myocardial infarctions, and decreasing incidence in hospitalizations for COPD. The observed increasing or decreasing trends in any disease category went in the same direction and were of similar magnitude in all age groups
(Fig.3).
Patient-days in hospital and mean length of stay
The total number of days spent during the acute hospital-ization phase decreased almost linearly between years 2000 and 2008 in all indications of interest and in both sexes. In
women, the highest relative decrease was observed for
COPD (from 89,554 to 56,099 days,−37.4%), followed by
breast carcinoma (from 90,951 to 57,842 days, −36.4%),
MCE (from 164,685 to 124,384 days, −24.5%), and MOF
(from 224,244 to 179,461 days, −19.9%). Therefore,
hospitalization for MOF remains a major contributor of days spent in hospital by women aged 45 years or more, responsible for three times more days of hospitalization than COPD and breast cancer and 1.5 times more days than any MCE.
In men, the highest relative decrease in days spent in hospital
was observed for COPD (from 107,329 to 60,663,−43.5%)
followed by MOF (from 71,477 to 62,828,−12.1%) and MCE
(from 174,858 to 158,441,−9.4%). Therefore, in 2008, there
were as many days spent in hospital by men for COPD, acute myocardial infarction (67,997 days), and heart failure (57,822 days) as for MOF.
These considerable reductions in total days spent in hospital for all indications of interest were essentially due to a relevant and statistically significant reduction of the
mean LOS as shown in Table 2.
Cost of hospitalizations
As described above, the mean LOS for patients hospitalized because of fractures decreased substantially between 2000 and 2008. The effect of this was counterbalanced, however, by rising hospital costs: the mean cost per day of hospitalization increased from CHF 996.00 to CHF 1,618.00 over the same period, a rise of 62%. The effects on hospitalization costs by selected diagnostic codes are
shown in Fig.4.
In women, hospitalization cost for MOF increased from CHF 223 to 291 million (mio; +30.1%, p<0.001 for time trend) and from 164 to 201 mio (+22.6%, p<0.001) for MCE. The cost of hospitalizations for COPD and breast cancer remained almost unchanged (from CHF 89 to 91 mio, +1.7%, p=0.168 and from 91 to 94 mio, +3.3%, p= 0.003, respectively). Overall, in women in 2008, the cost of acute hospitalizations was more than threefold higher for MOF than for COPD and breast cancer and 1.5-fold higher
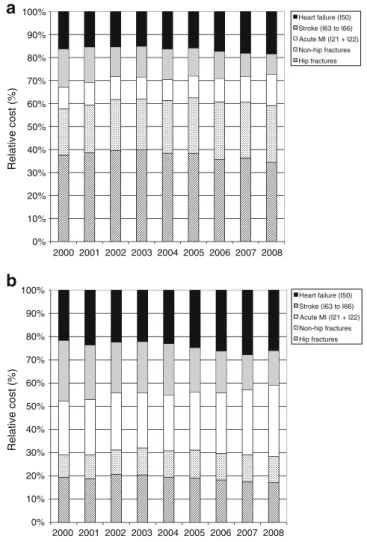
than for any MCE. As shown in Fig. 5, osteoporotic
fractures contributed to approximately 60% of the total costs of MOF and MCE in women.
In men, the cost of acute hospitalizations for MOF and MCE between 2000 and 2008 increased by 42.7% (from CHF 71 to 102 mio, p<0.001 for time trend) and by 47.1% (from CHF 174 to 256 mio, p<0.001), respectively. Therewhile, the cost of hospitalizations for COPD was reduced by 8.2% (from CHF 107 to 98 mio, p=0.078). Overall, in men in 2008, the cost of acute hospitalizations for MOF was comparable to that of COPD, acute myocardial infarction (CHF 110 mio), and heart failure 0 500 1000 1500 2000 2500 3000 3500 4000 4500 5000 45-54 55-64 65-74 75-84 85+ 45-54 55-64 65-74 75-84 85+
Incidence per 100'000 aged 45+
Non-hip fractures Hip fractures Major CV events Heart failure (I50) Acute MI (I21+I22) Stroke (I63 to I66)
Year 2000 Year 2008
a
b
0 500 1000 1500 2000 2500 3000 3500 4000 4500 5000 45-54 55-64 65-74 75-84 85+ 45-54 55-64 65-74 75-84 85+Incidence per 100'000 aged 45+
Non-hip fractures Hip fractures Major CV events Heart failure (I50) Acute MI (I21+I22) Stroke (I63 to I66)
Year 2000 Year 2008
Fig. 3 Age-standardized incidence of hospitalizations per 100,000 in women (a) and men (b) aged 45 years or more by 10-year age groups
(CHF 94 mio). As shown in Fig. 5, osteoporotic fractures represented approximately 30% of the total costs of MOF and MCE in men.
Discussion
The present analysis reports the epidemiological character-istics of hospitalizations in the acute care setting of patients with MOF, MCE, COPD, or breast carcinoma in Switzer-land between years 2000 and 2008. For the first time, time trends were established by using a nationwide database of medical records following an identical methodology, which ensures the highest possible homogeneity in results and should allow for comparisons with only little potential for bias. In this analysis, the age-standardized rates of hospital-izations for MOF and MCE increased during the observa-tion period, driven by an increase in nonhip fractures and acute myocardial infarctions, respectively. In addition, the mean hospital LOS decreased significantly in all indications of interest, the cost effect of which was offset by the increase in cost per day of hospitalization. Overall, the total
cost of hospitalizations, which aggregates the cost effect of the number of hospitalizations, mean hospital LOS, and cost per day of hospitalization, increased by 30% and 43% for MOF and 23% and 47% for MCE in women and men, respectively. The total cost incurred by hospitalizations for COPD and breast cancer remained virtually unchanged. During the same time, hospitalizations for hip fractures, stroke, COPD, and breast cancer decreased significantly. Reported changes followed similar patterns in both sexes, although of different orders of magnitude.
In Swiss women, during the 9 years of observation, osteoporosis and its complications, as measured by the characteristics of hospitalizations for MOF, remained a key contributor to the economic burden of healthcare. As confirmed by the present analysis, hip fractures seem to decline in Swiss women, which confirm earlier findings
from our group [5] and others [11, 12]. This possible
reversal of a secular trend is consistent with reports from
other countries such as USA [13–15], Canada [16, 17],
Japan [18], Finland [19], and Denmark [20]. Similar
observations were made in neighbor countries such as
France [21] and Austria [22] but not in Italy [23] and
Table 2 Changes in mean hospital LOS (days) in women and men
2000 2001 2002 2003 2004 2005 2006 2007 2008 Change 2008
vs. 2000 (%)
p value for time effect Women
Major osteoporotic fractures 16.1 15.0 14.6 13.8 12.9 12.2 11.5 11.4 11.0 −31.6 <0.001
Hip fractures 19.0 17.8 17.9 17.6 16.5 16.0 14.9 14.7 14.0 −26.5 <0.001
Nonhip fractures 12.4 11.5 11.0 9.9 9.4 8.8 8.7 8.6 8.5 −32.1 <0.001
Spine fractures 16.7 14.8 16.7 15.6 13.9 13.4 13.4 12.3 12.6 −24.5 <0.001
Distal radius fractures 8.7 8.3 7.0 6.2 6.3 5.7 5.5 5.6 5.4 −38.3 <0.001
Proximal humerus fractures 15.0 14.2 13.2 12.4 11.6 11.5 11.3 10.9 10.5 −30.1 <0.001
Major CV events 17.3 16.1 15.4 15.2 14.6 13.4 12.7 12.0 11.0 −36.1 <0.001 Acute MI 12.6 12.1 11.9 11.2 10.2 9.6 9.4 9.3 9.5 −24.1 <0.001 Stroke 23.7 21.6 20.7 20.7 19.8 18.2 16.7 14.8 10.7 −55.1 <0.001 Heart failure 16.4 15.6 15.2 15.0 15.0 13.8 13.4 13.1 12.7 −22.2 0.006 COPD 17.5 16.8 16.8 15.3 14.7 13.6 13.8 13.3 13.3 −23.9 <0.001 Breast carcinoma 9.7 9.2 8.9 8.7 8.2 7.7 7.7 7.6 7.6 −21.9 <0.001 Men
Major osteoporotic fractures 15.3 14.0 13.9 13.3 12.5 11.5 11.7 11.2 11.2 −27.1 <0.001
Hip fractures 18.8 17.2 17.4 16.7 15.9 15.2 15.1 14.4 13.8 −27.0 <0.001
Nonhip fractures 11.1 10.5 10.0 9.7 9.2 8.3 8.6 8.4 8.6 −22.1 <0.001
Spine fractures 13.9 13.5 13.7 12.3 11.5 10.5 11.3 10.3 11.0 −20.9 <0.001
Distal radius fractures 6.0 6.1 5.5 5.7 5.3 5.3 5.0 4.8 5.3 −12.0 0.184
Proximal humerus fractures 12.4 11.1 10.4 11.1 10.4 9.2 9.6 10.0 9.6 −23.1 0.004
Major CV events 13.8 13.1 12.0 11.7 11.4 10.5 10.2 9.8 9.7 −30.1 <0.001
Acute MI 9.4 9.3 8.6 8.2 8.0 7.5 7.4 7.3 7.5 −19.8 <0.001
Stroke 23.0 20.8 19.2 18.6 18.1 15.6 15.3 13.7 13.5 −41.3 <0.001
Heart failure 14.3 13.9 12.9 12.7 12.6 12.2 12.0 11.9 11.7 −17.7 0.225
Germany [24, 25]. In contrast, the incidence of hospital-izations for nonhip fractures steadily increased between years 2000 and 2008 in Swiss women. This effect was observed for all localizations of nonhip fractures (spine, distal radius, and proximal humerus). Possible explanations
will remain speculative and were detailed elsewhere [5]. We
are not aware of other publications confirming or infirming this observation, with the exception of earlier reports from
Finland which indicated that low-trauma knee [26], ankle
[27], and distal humeral [28] fractures may be stabilizing or
even declining in this country. Importantly, the present analysis reports hospitalized fractures only. Whether the total incidence of hospitalized and nonhospitalized nonhip fractures has increased cannot be concluded from the present data. However, as ongoing healthcare reform efforts have led to a global shift from inpatient to outpatient care
[29], the matter deserves further investigation. The
age-standardized incidence of hospitalizations for hip and nonhip fractures in men followed a similar pattern as in women but with a lower magnitude of change.
Interestingly, in women, the incidence of hospitalizations for acute myocardial infarctions increased strongly, while they stagnated for heart failure and decreased for stroke, with a similar pattern in men. Although a milestone regarding the characteristics of acute coronary syndromes in the real world was achieved already in 1997 by launching the Acute Myocardial Infarction in Switzerland
(AMIS) and AMIS Plus registry [30], we are not aware of
previously published trend patterns for hospitalized MCE in Switzerland. An increasing number of publications report the association between cardiovascular diseases and osteo-porotic fractures. Among the very first indices in this regard, a Swedish registry collected 273,288 strokes and 24,666 fractures, of which 14,263 were hip fractures,
0 50 100 150 200 250 300 350 2000 2001 2002 2003 2004 2005 2006 2007 2008 Cost (mio. CHF) Non-hip fractures Hip fractures Breast carcinoma (C50) COPD (J40 to J47) Heart failure (I50) Acute MI (I21 + I22) Stroke (I63 to I66)
0 20 40 60 80 100 120 2000 2001 2002 2003 2004 2005 2006 2007 2008 Cost (mio. CHF) Non-hip fractures Hip fractures Acute MI (I21 + I22) COPD (J40 to J47) Heart failure (I50) Stroke (I63 to I66)
a
b
Fig. 4 Cost of acutehospitalizations in women (a) and men (b) aged 45 years and older (mio CHF)
between 1987 and 1996 and concluded that, after a hospitalization for stroke, there was a more than sevenfold increase in fracture risk during the first year after
hospitalization for stroke [31]. In 2007, Sennerby et al.
showed that women with cardiovascular disease had a substantially increased risk of hip fracture, suggesting possible common pathologic pathways for osteoporotic
fractures and cardiovascular diseases [32]. In addition, in
a cohort of 31,936 Swedish twins born in 1914–1944
followed up from the age of 50 years, the same authors reported that a diagnosis of cardiovascular disease was significantly associated with risk of subsequent hip fracture within the same individual and in his or her co-twin without
index diagnosis [33]. In the present analysis, we report an
increasing incidence of both MOF and major cardiovascular diseases between 2000 and 2008 in Switzerland, which is consistent with a possible association between both disease entities. We also report decreasing trends in hip fractures and stroke and increasing trends in nonhip fractures and acute myocardial infarctions, which raises the question whether the supposed association between osteoporosis and
cardiovascular diseases might be more multifaceted than suggested to date.
The present analysis based on data of the medical database of the SFSO did not allow for identification of potential underlying associations or causes for the reported time trends. The earlier mentioned prospective AMIS Plus registry collects 230 variables of patients hospitalized for acute coronary syndromes in 76 Swiss hospitals participat-ing on a voluntary basis. If a similar registry existed for osteoporotic fractures, ideally in the same or a subset of the AMIS hospitals, database linkages could offer a unique opportunity for exploring further the associations between fractures and cardiovascular diseases. Furthermore, both fractures and MCE often lead to patient discharge to a rehabilitation center. Here again, a fracture registry com-bined with AMIS Plus could possibly contribute to identify common prognostic factors and to improve outcomes.
The present analysis reports hospitalized clinical events only. It is well known that many osteoporotic fractures are treated in the outpatient setting. Based on data from the Swiss nationwide survey in the OsteoCare cohort, which included 3,667 consecutive women and men aged 50 years and older and presenting to the emergency ward of
participating hospitals with a fragility fracture [34],
virtu-ally all hip fractures, approximately half of proximal humerus fractures, one third of distal radius fractures, and one fourth of clinical spine fractures were hospitalized in
Switzerland [3]. These observations are broadly consistent
with reports from other countries [35]. On the other hand,
as many as 25% of all coronary events are lethal before the patient reaches the hospital, a proportion that continues to increase as a result of the decline in in-hospital deaths
observed during the past decades [36]. Therefore, the
proposed comparisons across diseases should be considered as restricted to hospitalizations only.
We reported on MOF, i.e., of a subset of all hospitalized osteoporotic fractures. Achieving complete-ness would have required the very cumbersome use of osteoporosis attribution rates, as was exemplified earlier
[4,37]. Using the present approach, MOF were estimated
to represent only 77% and 72% of attributable fractures in
women and men in year 2000, respectively [3–5].
Therefore, absolute numbers, incidences, hospital days, and related costs reported in the analysis should be considered conservative. Data completeness was 81.2% and 84.9% in years 2000 and 2001, respectively, and exceeded 95.0% thereafter. The extrapolation to 100% could have induced a selection bias when comparing year 2008 with 2000. However, the trends observed over the 9 years were consistent year over year in all diseases of interest and no outliers were identified.
Of note, the total cost estimate for osteoporotic fractures (CHF 393 mio) reported in the present analysis refers to 0% 10% 20% 30% 40% 50% 60% 70% 80% 90% 100% 0% 10% 20% 30% 40% 50% 60% 70% 80% 90% 100% 2000 2001 2002 2003 2004 2005 2006 2007 2008 2000 2001 2002 2003 2004 2005 2006 2007 2008 Relative cost (%)
Heart failure (I50) Stroke (I63 to I66) Acute MI (I21 + I22) Non-hip fractures Hip fractures
Relative cost (%)
Heart failure (I50) Stroke (I63 to I66) Acute MI (I21 + I22) Non-hip fractures Hip fractures
b
a
Fig. 5 Relative cost contribution of MOF and MCE in women (a) and men (b) aged 45 years and older between years 2000 and 2008
direct medical costs of acute hospitalizations for MOFs only. The total direct medical cost of all hospitalized osteoporotic fractures can be extrapolated to CHF 524 mio, to which the inpatient rehabilitation and nursing home costs should be added. These represent approximately 50% of the total cost of the inpatient management of osteopo-rotic fractures, as already published earlier by our group
[38], so that the total cost of treating hospitalized
osteoporotic fractures in Switzerland exceeded CHF 1 billion in 2008. Cost estimates calculated in the present analysis are based on the nationwide average real cost per day of hospitalization and not on discipline-specific costs or diagnosis-related groups (DRGs). Therefore, cost estimates should be regarded as approximations, until the introduc-tion of the DRG system will allow more precise estimates. Finally, we did not attempt a projection based on observed trends. According to demographic scenarios from the SFSO, the Swiss population older than 65 years of age
will almost have doubled in 2050 [39]. Therefore, assuming
that the current time trends remain unchanged, the declining incidence of hip fractures and strokes will not be sufficient to reduce the absolute number of hospitalizations for these diseases in the coming decades. A representative cohort or a fracture registry linked to the AMIS Plus registry would contribute to better anticipation of future trends and allow for monitoring the effects of public health measures aimed at reducing fracture and cardiovascular risk.
In conclusion, between years 2000 and 2008, the burden of hospitalized osteoporotic fractures to the Swiss health-care system has continued to increase in both sexes. In women, this burden was significantly higher than that of MCE and the gap between both disease groups widened over time. More research is warranted to better understand the causal drivers behind these trends.
Acknowledgements This work was supported by an unrestricted research grant from MSD Switzerland AG. The sponsor had no influence on the design, analysis, or interpretation of the data. We are grateful to Dr. Philippe Kress, Kressmed, Glattbrugg, Switzerland for his contribution to data analysis and his critical review of the manuscript.
Conflicts of interest None.
References
1. Kanis JA, Burlet N, Cooper C, Delmas PD, Reginster JY, Borgstrom F, Rizzoli R (2008) European guidance for the diagnosis and management of osteoporosis in postmenopausal women. Osteoporos Int 19:399–428
2. Lippuner K, Johansson H, Kanis JA, Rizzoli R (2010) FRAX assessment of osteoporotic fracture probability in Switzerland. Osteoporos Int 21:381–389
3. Lippuner K, Johansson H, Kanis JA, Rizzoli R (2009) Remaining lifetime and absolute 10-year probabilities of osteoporotic fracture in Swiss men and women. Osteoporos Int 20:1131–1140 4. Lippuner K, Golder M, Greiner R (2005) Epidemiology and direct
medical costs of osteoporotic fractures in men and women in Switzerland. Osteoporos Int 16(Suppl 2):S8–S17
5. Lippuner K, Popp AW, Schwab P, Gitlin M, Schaufler T, Senn C, Perrelet R (2010) Fracture hospitalizations between years 2000 and 2007 in Switzerland: a trend analysis. Osteoporos Int (in press)
6. World Health Organization (2007) International statistical classi-fication of diseases and related health problems, 10th revision. Online version 2007. Available athttp://apps.who.int/classifications/ apps/icd/icd10online/. Accessed 12 January 2011
7. Swiss Federal Statistical Office (2009) Plausibility of medical statistics: the MedPlaus 5.0 concept. Available at http://www. freudiger.com/download/mp5_konzept_D_20091029.pdf. Accessed October 2010
8. Swiss Federal Statistical Office (2004) Data quality evaluation of medical statistics in 1998–2001. Available athttp://www.bfs.admin. ch/bfs/portal/de/index/themen/14/22/publ.html?publicationID=1306. Accessed October 2010
9. Lewinnek GE, Kelsey J, White AA 3rd, Kreiger NJ (1980) The significance and a comparative analysis of the epidemiology of hip fractures. Clin Orthop Relat Res (152):35–43
10. Swiss Federal Statistical Office (2010) Hospital statistics between year 2000 and year 2008. Available athttp://www.bfs.admin.ch/ bfs/portal/de/index/themen/14/03/01/data/01.htmlandhttp://www. bfs.admin.ch/bfs/portal/de/index/themen/14/03/01/key/01.html. Accessed 12 January 2011
11. Chevalley T, Guilley E, Herrmann FR, Hoffmeyer P, Rapin CH, Rizzoli R (2007) Incidence of hip fracture over a 10-year period (1991–2000): reversal of a secular trend. Bone 40:1284–1289 12. Guilley E, Chevalley T, Herrmann F, Baccino D, Hoffmeyer P,
Rapin CH, Rizzoli R (2008) Reversal of the hip fracture secular trend is related to a decrease in the incidence in institution-dwelling elderly women. Osteoporos Int 19:1741–1747
13. Melton LJ 3rd, Kearns AE, Atkinson EJ, Bolander ME, Achenbach SJ, Huddleston JM, Therneau TM, Leibson CL (2009) Secular trends in hip fracture incidence and recurrence. Osteoporos Int 20:687–694
14. Gehlbach SH, Avrunin JS, Puleo E (2007) Trends in hospital care for hip fractures. Osteoporos Int 18:585–591
15. Brauer CA, Coca-Perraillon M, Cutler DM, Rosen AB (2009) Incidence and mortality of hip fractures in the United States. Jama 302:1573–1579
16. Leslie WD, O’Donnell S, Jean S, Lagace C, Walsh P, Bancej C, Morin S, Hanley DA, Papaioannou A (2009) Trends in hip fracture rates in Canada. Jama 302:883–889
17. Jaglal S (2007) Falling hip fracture rates. J Bone Miner Res 22:1098, Author reply 1099
18. Orimo H, Yaegashi Y, Onoda T, Fukushima Y, Hosoi T, Sakata K (2009) Hip fracture incidence in Japan: estimates of new patients in 2007 and 20-year trends. Arch Osteoporos 4:71–77
19. Kannus P, Niemi S, Parkkari J, Palvanen M, Vuori I, Jarvinen M (2006) Nationwide decline in incidence of hip fracture. J Bone Miner Res 21:1836–1838
20. Abrahamsen B, Vestergaard P (2010) Declining incidence of hip fractures and the extent of use of anti-osteoporotic therapy in Denmark 1997–2006. Osteoporos Int 21:373–380
21. Maravic M, Taupin P, Landais P, Roux C (2011) Change in hip fracture incidence over the last 6 years in France. Osteoporos Int 22:797–801
22. Dimai HP, Svedbom A, Fahrleitner-Pammer A, Pieber T, Resch H, Zwettler E, Chandran M, Borgstrom F (2011) Epidemiology of
hip fractures in Austria: evidence for a change in the secular trend. Osteoporos Int 22:685–692
23. Piscitelli P, Gimigliano F, Gatto S et al (2010) Hip fractures in Italy: 2000–2005 extension study. Osteoporos Int 21:1323– 1330
24. Wildner M, Clark DE (2001) Hip fracture incidence in East and West Germany: reassessment ten years after unification. Osteoporos Int 12:136–139
25. Icks A, Haastert B, Wildner M, Becker C, Meyer G (2008) Trend of hip fracture incidence in Germany 1995–2004: a population-based study. Osteoporos Int 19:1139–1145
26. Kannus P, Niemi S, Parkkari J, Sievanen H, Palvanen M (2009) Declining incidence of low-trauma knee fractures in elderly women: nationwide statistics in Finland between 1970 and 2006. Osteoporos Int 20:43–46
27. Kannus P, Palvanen M, Niemi S, Parkkari J, Jarvinen M (2008) Stabilizing incidence of low-trauma ankle fractures in elderly people Finnish statistics in 1970–2006 and prediction for the future. Bone 43:340–342
28. Palvanen M, Kannus P, Niemi S, Parkkari J (2009) Secular trends in distal humeral fractures of elderly women: nationwide statistics in Finland between 1970 and 2007. Bone 46:1355– 1358
29. Swiss Health Observatory OBSAN (2004) 5-year comparison of the inpatient and outpatient costs between 1999 and 2003. Available at http://www.obsan.admin.ch/bfs/obsan/de/index/05/ 01.Document.105404.pdf. Accessed 16 June 2010
30. Radovanovic D, Erne P (2010) AMIS Plus: Swiss registry of acute coronary syndrome. Heart 96:917–921
31. Kanis J, Oden A, Johnell O (2001) Acute and long-term increase in fracture risk after hospitalization for stroke. Stroke 32:702–706 32. Sennerby U, Farahmand B, Ahlbom A, Ljunghall S, Michaelsson K (2007) Cardiovascular diseases and future risk of hip fracture in women. Osteoporos Int 18:1355–1362
33. Sennerby U, Melhus H, Gedeborg R, Byberg L, Garmo H, Ahlbom A, Pedersen NL, Michaelsson K (2009) Cardiovascular diseases and risk of hip fracture. Jama 302:1666–1673
34. Suhm N, Lamy O, Lippuner K (2008) Management of fragility fractures in Switzerland: results of a nationwide survey. Swiss Med Wkly 138:674–683
35. Tarantino U, Capone A, Planta M et al (2010) The incidence of hip, forearm, humeral, ankle, and vertebral fragility fractures in Italy: results from a 3-year multicenter study. Arthritis Res Ther 12:R226
36. Dudas K, Lappas G, Stewart S, Rosengren A (2011) Trends in out-of-hospital deaths due to coronary heart disease in Sweden (1991 to 2006). Circulation 123:46–52
37. Lippuner K, von Overbeck J, Perrelet R, Bosshard H, Jaeger P (1997) Incidence and direct medical costs of hospitalizations due to osteoporotic fractures in Switzerland. Osteoporos Int 7:414– 425
38. Schwenkglenks M, Lippuner K, Hauselmann HJ, Szucs TD (2005) A model of osteoporosis impact in Switzerland 2000– 2020. Osteoporos Int 16:659–671
39. Bundesamt für Statistik. Szenarien zur Bevölkerungsentwicklung der Schweiz 2005–2050. Available at http://www.bfs.admin.ch/ bfs/portal/de/index/news/publikationen.Document.83713.pdf. Accessed 14 May 2008