DISCUSSION PAPER SERIES
IZA DP No. 11775
Anne-Lore Fraikin Alain Jousten Mathieu Lefebvre
Social Security Incentives in Belgium:
An Analysis of Four Decades of Change
Any opinions expressed in this paper are those of the author(s) and not those of IZA. Research published in this series may include views on policy, but IZA takes no institutional policy positions. The IZA research network is committed to the IZA Guiding Principles of Research Integrity.
The IZA Institute of Labor Economics is an independent economic research institute that conducts research in labor economics and offers evidence-based policy advice on labor market issues. Supported by the Deutsche Post Foundation, IZA runs the world’s largest network of economists, whose research aims to provide answers to the global labor market challenges of our time. Our key objective is to build bridges between academic research, policymakers and society.
IZA Discussion Papers often represent preliminary work and are circulated to encourage discussion. Citation of such a paper should account for its provisional character. A revised version may be available directly from the author.
Schaumburg-Lippe-Straße 5–9
53113 Bonn, Germany Email: publications@iza.orgPhone: +49-228-3894-0 www.iza.org
IZA – Institute of Labor Economics
DISCUSSION PAPER SERIES
IZA DP No. 11775
Social Security Incentives in Belgium:
An Analysis of Four Decades of Change
AUGUST 2018
Anne-Lore Fraikin
University of Liège and UNU-MERIT, Maastricht University
Alain Jousten
University of Liège, IZA and NETSPAR
Mathieu Lefebvre
ABSTRACT
IZA DP No. 11775 AUGUST 2018
Social Security Incentives in Belgium:
An Analysis of Four Decades of Change
1The paper traces labor market reforms over the last four decades. It provides estimates of retirement incentives for a selected set of typical worker profiles across time and socio-economic groups and links these series to the labor market performance in Belgium. The results show that the numerous retirement and social security program reforms have had a marked impact on incentives at the micro level. At the aggregate level, results are less clear-cut given the extreme diversity of programs and features in the Belgian institutional context.
JEL Classification: J21, J26, H31, I38
Keywords: retirement, social security, pension, labor supply
Corresponding author: Alain Jousten Department of Economics Université de Liège Boulevard du Rectorat 7, Bât. B31 4000 Liege Belgium E-mail: ajousten@uliege.be
1 Fraikin acknowledges financial support through a Doctoral Dissertation Fellowship from FNRS/FRESH contract. The paper was written while Jousten was on sabbatical leave with ISM (Vilnius), whose hospitality is gratefully acknowledged. Financial support was provided by FNRS and the University of Liège. This paper uses data from the European Union Labour Force Survey (Eurostat, European Union) under contract 122/2015. Eurostat has no responsibility for the results and conclusions which are the authors’ only.
1
1. Introduction
Belgium has long been characterized by low employment and labor force participation rates of the elderly. In the nineties, the country was known for having one of the lowest average effective retirement ages in the European Union and – with employment of the age group 55-64 falling to 22 percent. Since then, there has been a continuous increase in these numbers reaching 25.1 percent in 2001, 31.8 percent in 2005 and 45.4 percent in 2016.
Previous studies have pointed the decisive role of public social security schemes in explaining the retirement patterns and low labor force participation of the elderly in Belgium (see among others Pestieau and Stijns, 1999; Dellis et al, 2004 or Jousten and Lefebvre, 2013). A common feature of these studies has been that they relied on a cross-sectional, micro-based and supply side approach. Relying on detailed modeling of individual retirement incentives in a given reference period, the papers documented the presence of strong retirement incentives and their importance in explaining observed labor supply and retirement patterns.
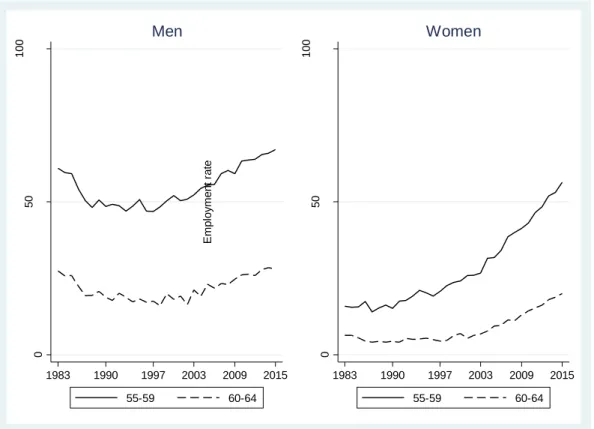
The cross-sectional design of the research question of these papers however limits their ability to explain observed labor supply and retirement patterns of Figure 1. Since the start of standardized collection of labor force data by the Labour Force Survey (LFS) in 1984, cohorts of older women have seen a steady upward trend in their employment rates; male employment has gone through a U-shaped pattern, with a first period of decreased employment (up to the early 1980’s) being followed by a period of stagnation (late 1980’s to late 1990’s) before finally contributing to the previously mentioned significant increase in employment rates of older cohorts since the early 2000’s.
2
Figure 1: Employment rate of older workers (ages 55-64)
Source : Eurostat Labour Force Survey (2017)
The respective importance of individual incentives and institutional changes in explaining observed labor supply and retirement patterns over the last decades remains unclear. Expressed differently, the decomposition into age and year effects remains an important and so far understudied research question in the Belgian context. Jousten and Lefebvre (2016) delivered a first step towards filling this gap in the literature. First, they provided a summary of institutional changes over the last decades – with a focus not only on pension and early retirement schemes, but also unemployment, disability and time credit (a part-time retirement scheme). Second, they provided a detailed macro-analysis of observed employment and retirement patterns, looking not only at trends in employment and labor force participation rates, but also at the changing intensity (e.g., more part-time work) and sectoral composition (e.g., a shift to service sectors) of employment in light of institutional changes.
This paper goes further as we systematically calculate the financial incentives to exit employment for typical workers, by age, year and sex – integrating changes both in benefits and the tax system. More specifically, we construct a simulation model aimed at assessing the incentives to retire for different subgroups of the population and link these incentives with their labor outcomes. The model allows us to separate age and year effects, incidentally also
0 50 100 E mp lo y me n t ra te 1983 1990 1997 2003 2009 2015 55-59 60-64 Men 0 50 100 E mp lo y me n t ra te 1983 1990 1997 2003 2009 2015 55-59 60-64 Women
3
permitting us to take phased reforms and grandfathering provisions into account. The model also permits the study of an array of scenarios in terms of earnings level, earnings growth, mortality, as well as simulation of modified system parameters.
We focus our attention on the population of wage-earners, leaving aside self-employed and civil servants. We further focus our attention on single workers, hence staying clear of issues of joint or spousal retirement decisions (see Jousten and Lefebvre 2017 for a study of the role of spousal retirement incentives in the Belgian case), as well as interactions between individuals participating in different schemes. The reasons for these restrictions are linked to the overall complexity of social insurance and retirement programs in Belgium combined with a lack of structured historical information on some of them. The wage earner scheme is by far the most important scheme in terms of enrolments and scope of coverage – encompassing all private sector workers and also contractual workers in the public sector. Furthermore, it is the scheme with the most time-series information available on the applicable institutional setting and on the characteristics of participants. It is also the scheme that has been most extensively studied so far (see Jousten et al, 2012; 2016 and Jousten and Lefebvre; 2016 and 2017).1 The structure of the paper is as follows. Section 2 provides a description of the pathways to retirement. After a summary of key programs and program changes over time, the section documents the changes in observed retirement patterns in Belgium. Section 3 introduces the retirement incentive indicator, with a focus on singles. Section 4 explores the link between observed retirement patterns and incentives using a common standardized earnings profile combined with standardized tax parameters across time and countries. The common earnings profile and time-invariant tax parameters are chosen to allow for an easy international comparison of results. Section 5 deviates from this common profile by introducing specificities that are more relevant for understanding the Belgian case by using different and more realistic assumptions in terms of earnings levels, career profiles and taxation. It also discusses how benefit floors and ceilings affect incentives given these earnings histories. Section 6 concludes.
1 The Civil servant schemes display a large heterogeneity, with only limited historical information available both
on institutional details as well as participants. The self-employed scheme is the least well documented, as the (substantially more limited) information on participants’ earnings histories has only recently been the subject of centralization efforts.
4
2. Pathways to retirement
This section summarizes the main retirement pathways for the wage earners in Belgium and surveys the major changes/reforms that have been implemented since the early 1980’s. There are four main components of the wage-earner social protection scheme that are of relevance when considering employment and retirement behavior: the Old Age Pension system (OAP), the Unemployment Insurance system (UI), the Conventional Early Retirement system (CER) and the Disability Insurance system (DI).2
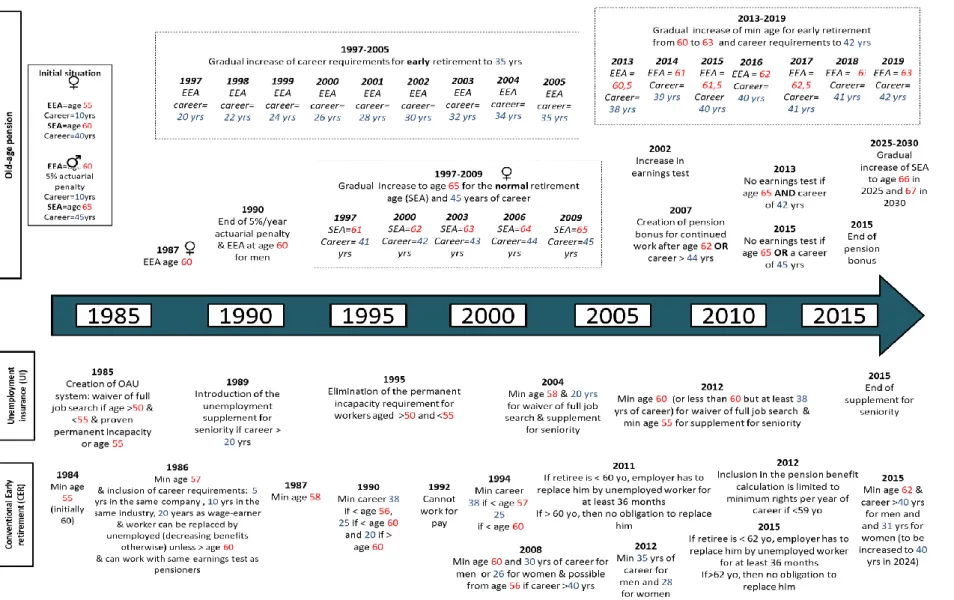
Figure 2 presents the time line of reforms implemented in each one of these pathways since the early 1980’s. It documents a rather sustained reform activity over the last decades.
Before proceeding, a few words of caution are in place. The figure should be seen as a stylized view on reforms of the headline retirement and early retirement schemes, with no claim of completeness. First, Belgium’s retirement landscape is characterized by a rather extreme degree of institutional complexity – with some derogatory rules still in place for mine-workers, pilots, etc. Second, the main legal and regulatory references are laid down in laws and in Royal decrees (implementing by-laws) – the border between the two not always being clear from an economic point of view with core policy choices relegated to Royal decrees, and implementing aspects in laws. Third, beyond laws and bylaws, national, sectoral and company-wide collective bargaining agreements play a core role in the implementation and the design of social protection schemes. Collective bargaining agreements are often compulsory for companies and workers in individual sectors (or even nationwide) and can sometimes substantially deviate from the headline rules laid down by the laws and bylaws. In the discussion below we focus on the headline system only, e.g. leaving aside some special early retirement conditions allowing labor force exits at ages well below the headline exit age. Fourth, employer-trade union co-management of the social security system, the outsourcing of some operational tasks (payment of unemployment benefits by the trade unions, payments of sick pay and disability insurance by health insurance funds, often having privileged links to the trade-unions, etc.) and the increasing splitting of competencies across government levels (federal government, social security, regional, community and local) further complicate the landscape. The below discussion completely leaves aside any and all changes in program
2 Contrary to Jousten and Lefebvre (2017), we do not consider the time-credit system, as participation does not
lead to retirement at the individual level but rather a reduction of work intensity of the worker combined with some benefit claiming – and this irrespectively of whether in aggregate the scheme leads to higher or lower employment than in its absence. We also do not consider the separate compulsory programs for workplace accident and professional disease insurance: though conceptually relevant, they remain quantitatively more limited in importance.
5
implementation and management, be they country-wide or regional. Finally, as already indicated in the introduction, the present paper focuses on single wage-earners. The summary of reforms thus leaves aside any changes and reforms to the benefits of spouses and survivors, as well as those changes affecting individual with mixed careers between different systems.
2.1. Old-age Pension system
The Old-age pension (OAP) system is the main public social security scheme covering the elderly. It is financed by tax-deductible employer and employee contributions but also by transfers from the federal budget. The program runs on a pay-as-you-go basis.
The statutory eligible age (SEA) to full benefits is currently 65 and is scheduled to increase to age 66 for pensions first payable on or after 2/1/2025 and to 67 for pensions first payable on or after 2/1/2030. While an SEA of 65 has been applicable to men for several decades, the female SEA has undergone substantial changes. Before 1997, the SEA for women was age 60. It was then increased by one year steps every three years starting in 1997 and finishing in 2009 – reaching full alignment with the male SEA in that last step.
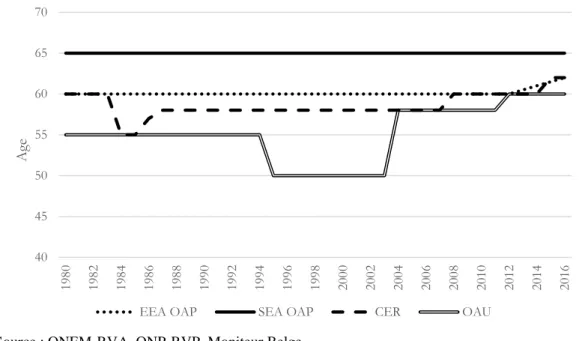
Early retirement is possible at an early eligibility age (EEA). Since 1987, the male and female EEA have been perfectly aligned, whereas before that date women had an EEA of 55 and men of 60. Until 2012, the EEA for men and women was 60. As of the year 2013, the headline EEA is on an upward path increasing by half a year every calendar year until it reaches age 63 for pensions being first payable on or after 2/1/2018. However, the recent stepped increase in the EEA since 2013 has been accompanied by the creation of a special EEA for individuals with long careers, e.g. currently still allowing early claiming at 60 for careers longer than 44 years.3 Figure 3 and 4 present the evolution of the EEA and SEA in the OAP for men and women separately.
6
Figure 2: Reforms – 1980-2016
7
Figure 3: Early and statutory retirement ages – men
Source : ONEM-RVA, ONP-RVP, Moniteur Belge
Figure 4: Early and statutory retirement ages - women
Source : ONEM-RVA, ONP-RVP, Moniteur Belge
The EEA effectively also plays the role of a full rate age (FRA), i.e. an age at which an individual can obtain unreduced benefits by satisfying both a minimum contribution history and the EEA. Two rules drive this equivalence between EEA and the FRA: First, the Belgian old-age pension system no longer applies actuarial adjustments in case of claiming before the SEA (beyond the effect of the shorter working history). A pre-existing actuarial penalty mechanism of 5 percent per year of anticipation was abolished in 1991. In 2007, a lump-sum pension bonus was introduced per day of continued work after 62 or beyond a career of 44
40 45 50 55 60 65 70 19 80 19 82 19 84 19 86 19 88 19 90 19 92 19 94 19 96 19 98 20 00 20 02 20 04 20 06 20 08 20 10 20 12 20 14 20 16 Age
EEA OAP SEA OAP CER OAU
40 45 50 55 60 65 70 19 80 19 82 19 84 19 86 19 88 19 90 19 92 19 94 19 96 19 98 20 00 20 02 20 04 20 06 20 08 20 10 20 12 20 14 20 16 Age
8
years, but the mechanism was again abolished in 2015.4 Second, claiming before the SEA has always been subject to career conditions. The career condition for early claiming between the EEA and the SEA has undergone substantial changes. Whereas in the early 1980’s, a career of 20 (10) years was required for men and women, between 1997 and 2005 the career condition was increased to 35 years. Since 2013, in line with the progressive increase in the EEA, career conditions for retirement are further tightened: 38 years in 2013, 39 in 2014, 40 in 2015 and 2016, 41 in 2017 and 2018 and 42 in 2019 – with special early exit provision still applying to individuals with longer careers. Though early claiming generally corresponds to reduced benefits, a worker with a full career condition (see below) upon claiming is entitled to unreduced benefits.
Combining old age pension receipt with work is in principle possible under the old age pension legislation, but generally subject to an earnings test.5 The earnings test is categorical – with benefits completely suspended if surpassing a pre-determined level. While the structure of the earnings test itself has not undergone major reform, it is now waived for those with careers of minimum 45 years or having reached the SRA.
Benefits depend on career earnings histories, on the marital status and on income. Both benefits and past earnings are indexed across time using the health index, which is essentially a slowed-down variant of the consumer price index (CPI) applicable as of 1996. Effectively, this indexing past earnings exposes individuals to a double systematic loss: First, they are exposed to as erosion of past earnings as the defined benefit formula is not reflecting real wage growth. Second, inflation-protection is not fully covered both for past earnings and benefits in payment as the health index grows less than the true cost of living summarized by the CPI.6
Full benefits nowadays require 45 years of earnings or assimilated periods for both males and females.7 Assimilated periods correspond to periods of the life spent on replacement income (e.g., unemployment benefits, disability benefits, career breaks) or other forms of paid or unpaid leave. Numerous such periods fully count as years worked and at the full (last) wage in the computation of the pension benefit. Since 2012, a more restrictive policy is applicable
4 The bonus was flat-rate until 2013, and in 2014 it was progressive as a function of the delay in claiming (but
remained independent of the wage).
5 Under labor legislation it requires the explicit consent of the employer. 6
In addition to these systematic biases, more ad hoc elements apply. Until 2004, ad hoc adjustments were applied to past wages to adjust them (partially) for real wage growth. In 1984, 1985 and 1987 yearly indexing was frozen on 3 occasions for budgetary reasons – de facto lowering benefits on a lifetime basis.
7 The female full career condition was increased between 1997 and 2009 from 40 to 45 years in line with the
9
to some types of absences from work: though the periods still count towards fulfilling the career condition, they nowadays only enter at a minimum lump-sum amount and no longer at the full last wage.8
The pension benefit corresponds to 60 percent of average lifetime earnings over the best 45 years of career. 9 There are ceilings and floors, applicable both to pensionable earnings and pensions. Both pensions and ceilings are indexed to consumer prices. Pension floors are further proportionately adjusted by a ratio depending on the completeness of the career. In addition, numerous ad hoc discretionary increases of both the ceilings for pensionable earnings and the pension floors are applied –with the stated dual aim of (i) correcting for the lack of real wage indexation and (ii) increasing minimum pensions at a faster pace than average pensions. 10 De facto, the faster growth of minimum pensions progressively makes the old-age pension system tend towards a flat-rate benefit structure.
2.2. Unemployment Insurance
Next to the OAP scheme, the unemployment insurance (UI) system is an important pathway to retirement. The regular UI system is available to workers of all ages under the condition of having paid contributions during at least 12 months in employment or having been in assimilated status (sickness, etc.) in the last 18 months. The unemployment benefits are also a function of unemployment duration and household status. At the beginning of the unemployment spell, the benefits represent 60 percent of the last gross wage for unemployed with dependents, 55 percent for single unemployed and 40 percent for individuals that are sharing their household with others (effective cohabitation). These benefits are not limited in time with payments ending upon re-employment or reaching the SEA – in the latter case the person is then rolled over into the OAP program. However, benefits are generally decreasing as a function of benefit duration with exceptions prevailing for unemployed workers who are either aged more than 55, have worked as a wage-earner for at least 25 years or can prove a disability of more than 33 percent. There are minimum and maximum unemployment benefits that also vary by household status and are decreasing in unemployment duration. Under the regular system, individuals have to be available for the job market and actively look for
8 For details see http://www.onprvp.fgov.be/FR/profes/calculation/career/inactivity/Pages/default.aspx.
9 For married individuals, a higher household benefit rate of 75 percent is applicable (subject to a pension test of
the spouse), and survivor benefits also apply.
10 Certain increases in the pensionable earnings ceilings were more important than others, most notably in 1968,
1969, 1973 and 1981, when it increased by a real growth rate of 31.6%, 13.4%, 30.8% and 15.9%, respectively. The two most important discretional increases in the pension floor occurred in 2001 and 2004, with a real growth rate of 3.5% and 3.8%, respectively.
10
employment; the amount of benefits is decreasing according to the length in the unemployment status.
In 1989, a seniority supplement was introduced for those aged 50 or more and who have been employed for at least 20 years. The amount of the seniority supplement was added to the regular unemployment benefit and depended on the household status and the age. The age condition was increased to 55 in 2012 and the measure was finally abandoned in 2015.
A specific feature of the Belgian UI system is the status of old-age unemployed (OAU). Under OAU rules, the unemployed is exempted from both actively looking for a job and from an availability condition for the labor market. He or she can stay unemployed until reaching the SEA of OAP with unreduced benefits. The OAU system was introduced in 1985 and was initially limited to those people aged 55 and above who were unemployed for at least two years or to those aged 50 who could prove of a permanent incapacity. In 1996 the eligibility age was lowered to 50 for everyone by removing the permanent incapacity requirement before age 55. In 2004, the government introduced more stringent conditions to benefit from the job search and availability waiver. Only workers aged 58 and above or with long careers still benefit from a full waiver. In 2012, the eligibility age for the waiver has been increased again to 60. Figures 3 and 4 show the timeline of changes in the eligibility age of men and women. Any time spent on unemployment benefits is fully credited towards pensionable periods in the earnings history as assimilated. Until 2012, such periods were fully credited at the last real wage before entering unemployment. Since 2012, the wage crediting is limited to a lower flat-rate amount for periods of unemployment going beyond two years.
2.3. Conventional Early Retirement
Conventional early retirement (CER) is a parallel system of early retirement benefits that was created in the early 1970’s. Benefits are composed of two elements. First, the early retiree is entitled to benefits from the unemployment insurance that are more generous than the ones of the simple UI system – particularly because of the absence of degressivity with respect to benefit duration and more favorable testing on household composition. Second, these baseline UI benefits are topped up by a complementary benefit paid by the former employer—equal to half the difference between the last net wage and the UI benefit.
Up until 2015, CER beneficiaries were fully exempted from job search and did not have to be available for the labor market. Since 2015, a new notion of “adapted availability” has been
11
introduced in the applicable rules, essentially making numerous early retirees subject to an availability condition up until the SEA – though it remains less stringent than for regular UI.11 Before 2012—as for all unemployed—the time spent in the early retirement program was fully credited at the last pre-retirement wage. Since 2012, the last-wage crediting is limited to a lower minimum amount for individuals retiring on CER before the age of 59.
At the start of the system, the headline eligibility age was set at 60. Several collective bargaining agreements rapidly lowered the effectively applicable eligibility ages and other eligibility conditions. As a result, the Belgian reality in the area od CER has been characterized from the early days by the coexistence of regimes with different career requirements, minimum ages, etc. Though legislation in the early 1980’s tried to harmonize and put constraints, numerous exceptions persist with respect to the general rules.
As mentioned before, we focus on the headline system as being the only economy-wide regime. Key reform steps are described as follows/ Eligibility has gone through several changes: while the age of 60 prevailed before 1984, it decreased to 55 in 1984 and it increased to 57 in 1986, to 58 in 1987 and to 60 in 2008 (see figures 3 and 4). Length of career conditions were also introduced in 1986 (see figure 2). Initially, the minimum length was set to 20 years. Over time, it has increased and now reaches 40 years for men and 33 years for women with a further programmed increase to 40 years for women until the year 2024.
2.4. Disability Insurance
The Disability Insurance (DI) system is the main program targeted at people withdrawing from the labor market for disability reasons – though it has become an increasingly relevant early retirement route in light of ever tighter eligibility and benefit criteria for the CER and UI systems (see Jousten et al, 2012). To be eligible for the benefit, the worker has to satisfy a series of conditions. First, there is a condition in terms of the loss of earnings capacity in the usual job. In order to be eligible, the worker has to suffer from a loss of earnings capacity of 66 percent over a period of at least twelve months.12 After first benefit entitlement, continued eligibility is periodically validated using medical and administrative controls. Second, workers also have to satisfy minimum contributory requirements to qualify for benefits. The coverage under the system prior to the onset of the disability has to be assured for at least two
11More recently in 2015, the name of the scheme has been adapted to unemployment scheme with company
supplement – mirroring this conceptual shift.
12 During these initial twelve months, workers are entitled to sick pay first from their employer and then the sick
12
quarters, combined with at least 120 days of actual or assimilated work (or 400 hours for part- time workers) before the covered event occurs.
During the first year of disability, the benefit is equal to 60 percent of reference earnings for everyone. It corresponds to the so-called period of incapacity. After, the benefit level is a function of the household status of the worker and is equal to 65 percent of reference earnings if the insured has dependents, 55 percent of reference earnings if the insured lives alone and 40 percent of reference earnings if the insured cohabits and has no dependents. Reference earnings are based on real observed earnings in the year leading up to the onset of the insured event.
As for the UI and CER systems, DI benefits are payable up to the SEA. Contrary to other social insurance replacement income programs, such as UI and CER, periods of benefit receipt continue to fully count toward the build-up of pension rights at the value of the last real wage to this date.
2.5. Income taxes and social security contributions
In Belgium, both the earnings and the benefits are subject to income taxes and mandatory social contributions. Mandatory social contributions are paid both by employees and employers. Employer social contributions amount to 24.92 percent of the gross wage.13 Personal/employee social contributions include a 13.07 percent employee contribution on wage income, a 3.5 percent contribution on DI benefits and a 6.5 percent contribution on CER and UI benefits. A health and disability contribution of 3.5 percent on pensions becomes mandatory when the pension is above a certain threshold. 14 While social security benefits are all capped by means of program-specific ceilings, the same does not hold true on the contribution side where no caps applicable.
The Belgian personal income tax (PIT) applies to wage, pension and other replacement income. The PIT liability is calculated using a strongly progressive rate structure with marginal tax rates from 0 to 50 percent from 2003 onwards.15 Before 2003, the tax rates were modified substantially over the years and could go as high as 70.8 percent in 1988.
13 An additional contribution is paid for annual vacation but it concerns only blue collar workers.
14 A “solidarity contribution” on OAP essentially taxing beneficiaries of higher pensions also exists. This
contribution was introduced in 1994 and has to be paid on pension income or capital. It is calculated using a progressive rate and goes from 0 to 2 percent. It does not apply to pensions below a monthly gross amount of EUR 2311.96 (applicable amount in 2018). Since the maximum pension of a single earner for the same period is EUR 2390.76, it has limited impact on our simulation of single wage earners.
15
13
taxable amounts vary according to the marital status and to the number of dependent children of the taxpayer.
Replacement incomes (including OAP) can benefit from two types of additional tax preferences. First, there is a set of ad hoc tax deductions for the various categories of replacement income effectively granting these types of income a preferential treatment as compared to wages and other types of income and effectively excluding a substantial share of these benefits from taxation – with the most generous rules applying to DI benefits. However, in the presence of other sources of income and depending on individual characteristics, a non-negligible tax burden might subsist. This is where the second mechanism comes into play: a special tax deduction reduces the taxable income and hence the tax amount to zero if a person’s income is exclusively composed of OAP or other replacement benefits below a given threshold. The applicable thresholds in Belgium are such that for all cases considered in sections 4 and 5, no personal income tax is due on benefits.
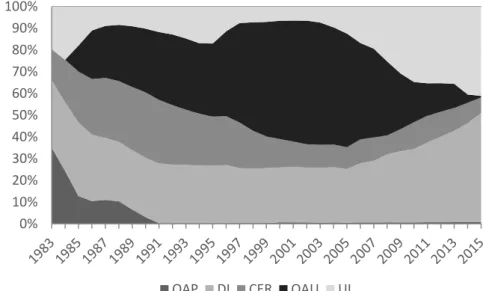
2.6. Program participation
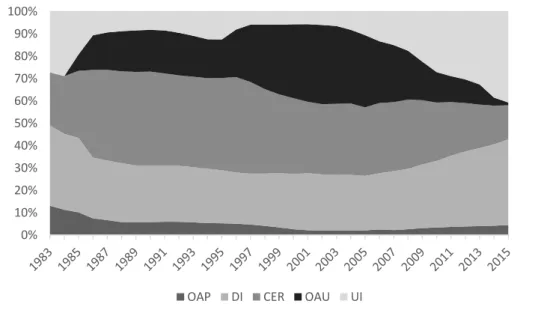
Figures 5 to 8 present the pathways to retirement over the period 1983 to 2015. They show for each year, and by age group, the percentage of men and women recorded as beneficiaries of each program. On each figure, we see how the structure changed over time with the implementation of reforms in some programs and the introduction of new programs as well. Over the period some pathways have gained or lost importance in the distribution of exits, reflecting the varying generosity in access conditions to and benefits. These figures document the connected vessels aspect of the various social security schemes. For men aged 55-59 we observe an increase in the proportion of recipients of UI and DI benefits since 2005, at a time when CER rules have been tightened. For men aged 60-64, the proportion of pensioners has increased since 2005. For women aged 55-59, the picture is similar to men but for older women we observe the increase of the proportion of other pathways since the end of the nineties due to the increase of SEA in the OAP system, hence delaying the mechanical rollover of DI, UI, OAU and CER beneficiaries into the OAP program.
14
Figure 5: Pathways to retirement – men, age 55-59
Source: INAMI-RIZIV, ONEM-RVA, ONP-RVP
Figure 6: Pathways to retirement – men, age 60-64
Source: INAMI-RIZIV, ONEM-RVA, ONP-RVP
0% 10% 20% 30% 40% 50% 60% 70% 80% 90% 100%
OAP DI CER OAU UI
0% 10% 20% 30% 40% 50% 60% 70% 80% 90% 100%
15
Figure 7: Pathways to retirement – women, age 55-59
Source: INAMI-RIZIV, ONEM-RVA, ONP-RVP
Figure 8: Pathways to retirement – women, age 60-64
Source: INAMI-RIZIV, ONEM-RVA, ONP-RVP
3. Measuring retirement incentives
This section describes the simulation model used to quantify the work incentives created by the social security system. To observe the effect of changes and reforms along time, calculations are done for the different age cohorts in each year starting in the early 1980’s. Given the life-cycle dimension of pensions, we define a synthetic earnings history of a cohort through time and scale it to reflect differences in socio-economic status. For each pathway
0% 10% 20% 30% 40% 50% 60% 70% 80% 90% 100%
OAP DI CER OAU UI
0% 10% 20% 30% 40% 50% 60% 70% 80% 90% 100%
16
and case, we calculate and aggregate the benefits the representative individual is entitled to at a given age in a given year.
3.1. Earning histories
We consider two scenarios: a common scenario, with key assumptions based on international data used for all countries in this volume and a Belgian scenario with assumptions based on Belgian data. We model earnings histories for two types of individuals: single males, single females. We distinguish stylized variants of low, medium and high earners. For each year of observation, each of these 6 cases is associated with specific earnings level, career length and lifetime earnings profiles. We detail the underlying calculations and assumptions below. First, we use the median income of full-time non-manual wage-earners in 2014 as reported by Statistics Belgium to define the median worker and attribute this wage to males aged 50 in 2014. We adjust the median wage at the anchoring age of 50 to each simulation year using a fixed deflator, which is the average growth rate of the conventional wage of non-manual wage earners between 1980 and 2016. We then define low earners as persons earning 50 percent of the median and high earners as receiving 200 percent of the median earner’s income. We assume that female median earnings are 7.6 percent below male median at age 50 for all years of study – with 7.6 percent corresponding to the average hourly wage gap between men and women in 2014 as reported by Statistics Belgium.
Second, we derive earnings histories for these 6 cases in the two scenarios. All earnings histories share a common assumption of no career interruptions – with any variation in effectively career length simply translated into different starting dates.
In the common scenario, we assume that the low earners start working at age 16, the median earners start working at 20 and the high earners start working at 25. Once these career lengths determined we derive lifetime earning histories for each case. The common earnings profile uses a time-invariant common synthetic earning profile that is differentiated for men and women and for the three income levels. The profiles are calculated with data from the US, Germany and Italy. Figure 9 presents the patterns of the earning profiles – the same for all years concerned – each expressed as a proportion of the anchoring wage at 50.
In the Belgian scenario, we shorten the careers of men by 5 years in order to model more incomplete (but more realistic) careers. We further consider an average gap in career length between men and women of 6 years – in line with the results of a report from ONP-RVP (2005). This assumption is plausible as compulsory schooling goes up to age 18 already for
17
several decades, with numerous persons studying well-beyond. Also, other forms of work interruptions are not uncommon.16 The Belgian scenario thus assumes that male (female) low earners start working at age 21 (27), male (female) median earners start working at age 25 (31) and male (female) high earners start working at age 30 (36). In a second step, The Belgian specific earnings profile is built using the average gross monthly wage by age and is time and sex-specific – but its shape does not vary by income level beyond the different starting date.17
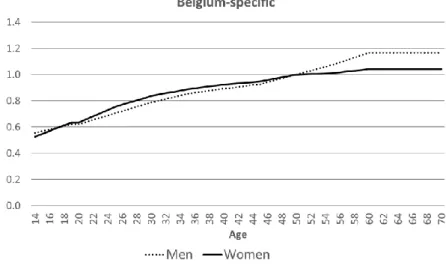
Figure 10 presents the average of the time-specific Belgian earning profiles, again expressed as a percentage of the wage at age 50. Unlike the common profile – that assumes an important increase of the wage in the first years of the career, a decrease in the growth of wages until 50, and constancy thereafter - the Belgian-specific earnings profile displays a continuous and almost constant increase of the wage throughout the career and until age 60. Expressed differently, while the common profile captures an internationally more usual career-wage profile, the Belgian-specific pattern better fits the specificities of the Belgian wage-setting system with its automatic indexing of wages to changes in the CPI and collective wage bargaining on real wage growth across income levels.
Figure 9: Common earnings profiles
Source: Authors’ calculations
16 Military service obligations for men until the late 1990’s also contributed to a later start in the working lives. 17 Because of data limitations, earnings profiles are kept constant in real terms at the anchor age of 50 from 1980
18
Figure 10: Belgian-specific earnings profiles, average across years
Source: Authors’ calculations
Each scenario is accompanied by an assumption in terms of the applicable tax system. In the common scenario, we use the tax rules applicable in 2016 (in real terms) to all simulation years. The motivation for this approach is to clearly distinguish the pure effects of pension policy from those of general tax policy.18 In the Belgian scenario, we apply the tax rules as they were applicable in all years to reflect the changes in the entire tax-benefit landscape as experienced by real-world workers.
3.2. Benefit stream
From these earnings profiles, we calculate, for each age-year cohort the after-tax benefit stream from each scheme presented in section 2. For an individual i, defined according to his or her sex and the level of career earnings, we calculate the after tax benefit 𝐵𝑘,𝑡,𝑎(𝑅, 𝑖) from the program k for all ages a≥R, where R is the first year of benefit receipt. Once retired, we assume benefits remain constant in real terms in future years.
We look at retirement ages ranging from 55 to 65 from year 1980 to 2016. Our simulation thus takes into account any potential cohort differences and changes thereto, as well as transitory and permanent changes over time (index t) and as a function of age (index a). The lack of eligibility for pathway k at an age a at time t conditional on retirement at R is modeled by setting 𝐵𝑘,𝑡,𝑎(𝑅, 𝑖) equal to 0.
18
19
The simulation model allows for a rich set of scenarios in terms of individual characteristics. Also, it allows for simulations of counterfactuals and system reforms. For example, the common scenario of section 4 relies on a counterfactual assumption that only benefit rules have changed but no tax changes have occurred during the entire period of analysis. The motivation for this deviation from the empirically observed institutional setting is to separate out strictly retirement-related changes from broader tax policy changes affecting the wider population. The Belgian scenario of section 5 explores the role of tax policy changes, and also provides counterfactual analysis of benefits indexation rules and thresholds.
3.3. Social security wealth, accrual and implicit tax
From the benefits, we calculate different indicators of social security systems’ incentives. The key concept is the annual accrual of social security wealth (SSW). The SSW is the present discounted value of all future benefit flows from a given social security program for a given individual at a given age in a given year. SSW for an individual of type i starting to claim benefits from program k at age R in time t is then given by:
𝑆𝑆𝑊𝑘,𝑡(𝑅, 𝑖) = 𝐵𝑘,𝑡,𝑅∑ 𝜎𝑖,𝑎𝛽𝑎−𝑅 𝑇
𝑎=𝑅
Where 𝐵𝑘,𝑡,𝑅 is the after-tax benefit from pathway k at age R as calculated above. The formula sums these benefits until the end of life T. Discounting is done allowing both for time preference and mortality adjustments: 𝜎𝑖,𝑎 is the survival probability19 at age a for individual i and is the time discount rate that we assume to be equal to 3 percent real. Since we assume real constant benefit once in the program, the amount stays the same in the forthcoming years if the person retires on OAP. In the case of an exit through UI, CER or DI, the benefits change according to the age since at the SEA the individual starts to receive OAP benefits instead of the other benefits – essentially splitting the right hand-side of the formula in two separate sums before and after the SEA.
Based on this SSW, we then compute a secondary incentive measure that represents the variation in SSW that is obtained by retiring one year later. Postponing claiming by one year has two effects on social security wealth. On the one hand, annual benefits 𝐵𝑘,𝑡,𝑎(𝑅, 𝑖) can vary with later claiming due to additional earnings entering the benefit formula (and possible
19
20
actuarial adjustments). On the other hand, however, benefits are received one year later. The accrual of social security wealth is then given by:
𝐴𝐶𝐶𝑘,𝑡(𝑅, 𝑖) = 𝑆𝑆𝑊𝑘,𝑡+1(𝑅 + 1, 𝑖) − 𝑆𝑆𝑊𝑘,𝑡(𝑅, 𝑖)
The accrual can thus be positive, zero, or negative. If the accrual is negative, the social security system imposes an implicit tax on working longer. The implicit tax rate is the (negative) accrual of social security wealth divided by the after tax earnings during the additional year of work Yt+1,i:
𝐼𝑇𝐴𝑋𝑘,𝑡(𝑅, 𝑖) =−𝐴𝐶𝐶𝑘,𝑡(𝑅, 𝑖)
𝑌𝑡+1,𝑖
This last measure shows the tax on continued activity from retiring one year later. A positive value means that there is a tax on working longer, a negative value represents a subsidy for working longer.
4. Retirement incentives: common profile
The present section presents the analysis of the incentive measures defined in the previous section for the 6 “common scenario” cases by sex and income level across time. To simplify the presentation, the general discussion of incentives at the level of the individual focuses on median earner profiles in the context of the OAP program. We only present ITAX measures for other benefit programs as they capture the essence of the incentive landscape. The details of the other cases can be obtained from the authors upon simple request. When discussing the impact of these individual incentive indicators for aggregate outcomes, all incentive measures are summed across programs and across earnings levels to one representative measure that is confronted with observed employment rates.
4.1. Incentives by pathway
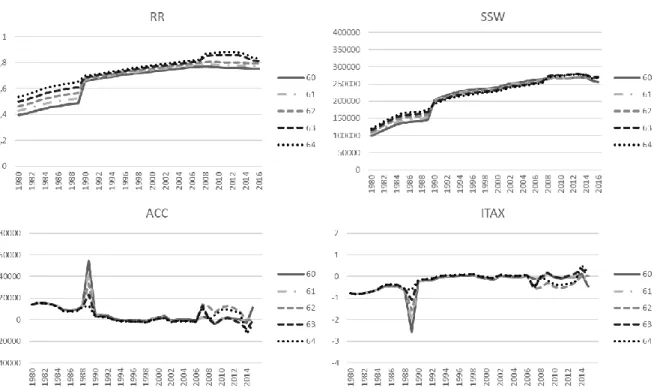
Figures 11 to 14 present the measures for the OAP scheme for the median earners. Results are shown for both sexes and two age groups: age 55-59 and age 60-64.
For men aged 55-59, figure 11 displays very marked changes in the SSW. The SSW of median earners displays a generally increasing trend over the years thanks to the discretionary increases of ceilings for pensionable earnings. Without such discretionary increases, the SSW
21
would be flat – reflecting the crucial role played by the floors and ceilings in the system.20 This is particularly important in the early eighties when ITAX increased rapidly as a results of the combination of three factors: an upward changes of ceilings that is stronger than in other years, a higher growth rate of median income, and the progressive replacement of (relatively low) lump-sum earnings amounts for earnings prior to 1955 by real wages as time progresses.21 The ensuing discrete jump of the SSW curves after 1990 can be attributed to the end of the actuarial adjustment penalty of 5 percent for exits before the SEA. This translates in a large peak of the accrual and the corresponding drop in the implicit tax as a result of the discrete jump in entitlements for all individuals claiming benefits at the EEA – as is the case of individuals quitting the labor market between ages 55 and 59.
As mentioned earlier, the EEA of both men and women gradually increased from 60 to 63 between 2013 and 2018. In our simulation, we consider that if a worker exits the labor market through the OAP before the EEA, he receives a benefit of zero until he reaches the EEA. Since median earners in the common scenario do not satisfy the long-career exception, they are affected by the reform. Thus, an increase in EEA translates into a decrease of the SSW because the worker starts receiving pension benefits one year later. Therefore, the downward trend in SSW as of 2013 is attributable to the increase in the EEA and the associated career requirements. Accordingly, the ITAX at age 59 increases in 2013, because there is an incentive for the worker aged 59 to exit the labor force before the EEA rises to 61 in 2014. Given that workers receive a benefit of zero before they reach the EEA at age 60, the ITAX is negative for every year.
20 Implicitly, the discretionary increases – imperfectly – mimic wage-indexing of past earnings. 21
Starting in 1990, our calculations effectively no longer include lump-sum amounts for median earners – profoundly affecting retirement incentives.
22
Figure 11: Incentive measures – OAP – men median earners, age 55-59
Source: Authors’ calculations
Note: RR, SSW, ACC and ITAX correspond to the replacement rate, the social security wealth, the accrual and the implicit tax rate respectively.
Figure 12 reports the social security incentive measures for female median earners retiring between age 55 and 59. The results are similar to those of men except for the reform of 1987 that increases the EEA from 55 to 60, adding a sharp discontinuity by replacing every potential year of benefits before 60 by zero. Moreover, as the female SEA was already set at 60 before 1997, women were not directly impacted by the end of actuarial adjustments in 1991. In addition, other assumptions play out: as women are assumed to have the same career length as men with and only slightly lower median earnings, their higher life expectancies and shorter full career conditions (until 2009 only) lead them to have a significantly higher SSW. This effect is partially cancelled out between 1997 and 2009 because of the increase in full career conditions from 40 to 45 years. The resulting decrease in SSW during the latter period leads to an increased incentive to leave the labor market before each increase in career condition, and thus a positive ITAX at each step.
23
Figure 12: Incentive measures – OAP – women median earners, age 55-59
Source: Authors’ calculations
Note: RR, SSW, ACC and ITAX correspond to the replacement rate, the social security wealth, the accrual and the implicit tax rate respectively.
Figure 13 reports the social security incentive measures for men who retire between the ages of 60 and 64. The end of the actuarial adjustment in 1991 again has a visible effect on this age group, that is most directly affected: the ITAX increases to zero and even enters the positive domain, with older workers less impacted as less exposed to the actuarial adjustment in the pre-reform environment. In 2007, the flat-rate pension bonus was created for continued work after age 62 (or after 44 years of career). The program was discontinued in 2015, which translates into a fall in the accruals and an increase in the ITAX at ages 63 to 65 in 2014. In this simulation, the receipt of a pension bonus increases the pension to a level higher than the health and disability insurance contribution threshold for retirement ages of 65 in 2008 and of 64 and 65 starting from 2009 onwards. This additional health and disability contribution limits the increase in pension benefits, and thus the increase in SSW, due to the pension bonus at age 64 and 65. Since we assume that the median earner starts working at age 20 and works without career interruption, he is eligible for the long-career exception of the OAP scheme that allows for retirement at age 60 in 2013 and 2014, instead of 60.5 and 61, respectively. Thus in practice workers would only be affected by the reform if their career were insufficiently long – which is not the case for the common profile. At age 60, the SSW only starts decreasing in 2015 because in 2013 and 2014, median workers still had access to an
24
EEA of 60. In 2015, they fall out of these conditions that require 41 years of career to access OAP benefits at age 60 and now have an EEA of 61.5.
Figure 13: Incentive measures – OAP – men median earners, age 60-64
Source: Authors’ calculations
Note: RR, SSW, ACC and ITAX correspond to the replacement rate, the social security wealth, the accrual and the implicit tax rate respectively.
Finally, figure 14 depicts the social security incentive measures for women who are median earners and retire between the ages of 60 and 64. Logically, the 1987 reform that increased the EEA of women to 60 has no impact on women who retire after 60. The effect of the increase in full career from 1997 to 2009 and the pension bonus from 2007 to 2015 for retirement ages between 63 and 64 are also visible. Moreover, the receipt of the pension bonus at age 65 also increases the pension to a level higher than the health and disability insurance contribution threshold, which limits the increase in pension benefits due to the pension bonus at age 65.
25
Figure 14: Incentive measures – OAP – women median earners, age 60-64
Source: Authors’ calculations.
Note: RR, SSW, ACC and ITAX correspond to the replacement rate, the social security wealth, the accrual and the implicit tax rate respectively.
For the other three pathways, we only present the implicit tax for each sex for reasons of brevity. Similarly, we focus on the age group 55-59 since it is the age-window where most changes in program parameters and employment have happened. Figure 15 and Figure 16 show the evolution of the ITAX in the CER scheme for each age. Contrary to our assumption on the OAP, we consider that individuals who lose benefits in the CER program would still meet the basic conditions to UI benefits – a plausible assumption in the Belgian context. Hence benefits are not reduced to zero in case of loss of eligibility, but rather replaced by the lower UI benefits. The implicit tax for most ages is on average largely positive; meaning that there is strong incentive to exit the labor market through the CER. The peak at age 55 in 1986 for both men and women corresponds to the increase of the eligibility age from 55 to 57. There is an incentive to quit the labor market before the reform takes place in order to be able to access the CER pathway at age 55 instead of 57. The same effect is observed at age 58 in 2008 when the eligibility age increased to 60. The ITAX at age 56 in 1986 is not impacted by the reform, the worker does not lose access to the CER exit pathway if working for one more year. In 1987, the increase in the eligibility to 58 creates a negative ITAX at 57 because the worker now has an incentive to stay on the labor market for one more year to have access to
26
the CER program rather than exiting at 57 and remaining on lower UI benefits until the SEA. Thus, from 1987 onwards, the ITAX at 55 and 56 is lower than at other ages because if workers exit before 58 they receive UI benefits until the SEA. The UI benefits are less generous than the CER benefits, thus creating a smaller incentive to leave the labor force. The small drop in 2001 for every age is related to an increase of the median wage that is more important than in previous years and is thus not explained by any changing rules of the system. These changes in the growth of the median wage also explain the small variations we observe between 1987 and 2006 and especially the raid increase in 2009. The same will apply for the results presented below for UI and DI. In 2008, the increase of the headline entitlement age for CER to 60 translates into an double effect: an increase in the ITAX at 57 resulting in an incentive to leave the labor force before the reform; and a decrease in the ITAX at 59 resulting in an incentive to stay on the labor market for one more year to receive CER rather than UI benefits until the SEA.22 In 2015, the headline eligibility age increases to 62 and the ITAX at age 59 again increases.
Figure 15: Implicit tax CER - men median earners, age 55-59
Source: Authors’ calculations
From 2012 onwards, and for exits before age 59, longer periods on CER are no longer fully credited at the last real wage before entering the CER but rather at the guaranteed minimum wage. Though the eligibility age for CER is higher than 59 in the headline regime that is discussed in this paper – the CER pathway still is affected. The reason is that exits through UI as a fallback option remain possible, with UI crediting in the earnings history effectively
22 Notice that the impact of the 2008 reform on the ITAX at 59 is less pronounced than the impact of the 1987
27
facing the same limitations as CER after the first year of unemployment. Therefore, workers in the headline regime are affected by the reform through the indirect channel of a decrease in the value of the UI periods in their earnings history whereas those in special CER are directly affected – ultimately to the same effect. As a result, the reform of credited earnings in 2012 for long periods of inactivity has led to a decrease of the ITAX at every age from 2012 onwards.
Figure 16 illustrates the evolution of the CER ITAX for women. The impact of the gradual increase of the SEA in OAP from 1997 to 2009 is particularly visible. Each stepwise increase in SEA translates into an immediate decrease in the ITAX because they receive one more year of CER benefits before they are transferred into the OAP system. Therefore, an incentive to stay at work for one more year appears at each step.
Figure 16: Implicit tax CER - women median earners, age 55-59
Source: Authors’ calculations
The implicit tax for UI also displays some changes, as illustrated in figures 17 and 18. In 1985, the ITAX decreases sharply in a one-off fashion because of the introduction of the seniority supplement: there is an incentive to wait one more year in order to be eligible for the supplement rather than merely regular UI benefits. This effect no longer plays out with the same acuity in the following years, where only the increased generosity of the system leaves its mark through a higher implicit tax rate. In 2015, the increase in ITAX at each age is the mirror image of the one in 1985: namely the end of the supplement for seniority. For women, the increase of the OAP SEA also translates into a markedly different incentive pattern at the CER level.
28
Figure 17: Implicit tax UI - men median earners, age 55-59
Source: Authors’ calculations
Figure 18: Implicit tax UI - women median earners, age 55-59
Source: Authors’ calculations
Interestingly, as we already noted in section 2, there has been little to no change in the DI program and the statutory incentives to retire have not been impacted beyond the obvious effect of the increase in the SEA for women and the discretionary increases in ceilings for pensionable earnings23 (figures 19 and 20). As mentioned before, and short of information of implementation rules at the level of the institutions managing the DI system, these incentive measures only capture changes in the laws and leave aside changes that could have arisen because of modified implementation over time.
23
29
Figure 19: Implicit tax DI - men median earners, age 55-59
Source: Authors’ calculations
Figure 20: Implicit tax DI - women median earners, age 55-59
Source: Authors’ calculations
4.2. Aggregate incentives and employment
To confront the stylized individual incentives with aggregate employment rates, a summary incentive indicator is derived. We rely on the administrative data of figures 5 to 8 to calculate path-specific weights corresponding to the share of the population that is either on UI, CER or DI. The OAP takes the residual weight such that the sum of the weights is equal to one. These weights are obtained by year, age group (55-59 and 60-64), and gender. Finally, incentives are aggregated across income levels.
30
Figures 21 to 24 present the results of these aggregate incentive measures for median earners by age, year and sex and include the major reforms that have influenced them since the eighties. Aggregate retirement incentives are heavily influenced by the default option, namely the OAP scheme. This is unsurprising as this scheme represents the largest weight (see figures 5-8) and also affects the benefit that is payable for the longest period of time (from EEA or SEA until death). Because of the high participation rate of men in the CER program, it also has a non-negligible influence on the aggregated ITAX of men for both age groups.
Figure 21: Implicit tax for male median earners by age (ages 55-59)
31
Figure 22: Implicit tax for female median earners by age (ages 55-59)
Source: Authors’ calculations
Figure 23: Implicit tax for male median earners by age (ages 60-64)
32
Figure 24: Implicit tax for female median earners by age (ages 60-64)
Source: Authors’ calculations
When aggregating across income levels and focusing on changes in retirement incentives over time, very distinct patterns can be observed. Figure 25 and 26 present the implicit tax for 4 reference years, separated by 10-year intervals each. While reforms during the first few decades have mostly focused on ages 55-59, there is more recently a clear shift towards the age group 60-64. Results are however somewhat surprising: contrary to a general perception of an overall greater reward of longer working lives in the recent years, our results show that incentives are actually leaning heavily against longer working lives. Clearly, these results have to be read and interpreted with some caution: for example, the numerous special early retirement regimes that existed in addition to the headline CER setup clearly affected the real-world incentives faced by individuals in ways that were sometimes quite different from the headline regime. Also, the weighting of the pathways remains somewhat contentious – with the residual weight on the OAP path likely overemphasizing its relevance.24
24
33
Figure 25: Implicit tax for male median earners by year
Source: Authors’ calculations
Figure 26: Implicit tax for female median earners by year
Source: Authors’ calculations
Similar caution should be applied when interpreting figures 27 to 30. In these, we relate the average ITAX indicator by age groups of 55-59 and 60-64 in a given year to the employment rate of the same age groups in that year. Overall a negative relationship appears between the employment rate and the ITAX but not in a very strong manner – with a negative and statistically significant relation only established for men 60-64 and women 55-59. Clearly, the averaging across ages and the chosen weighting are likely disputable. However, we believe that even when correcting for some of these concerns (for example using a different weighting
34
of exit routes that does not put the default weight on the OAP system) no stronger relation will emerge. This is likely due to the fact that individual incentives faced by real world Belgian workers are quite substantially different from those of the typical workers we have chosen. The real world is obviously less single, less complete career, with less stable earnings than our assumptions imply. On the other hand, it is also more diverse as employment as defined by the labor force survey also includes civil servants and self-employed.
Figure 27: Employment rate and ITAX – men, age 55-59
Source: Authors’ calculations and Labour Force Survey
Figure 28: Employment rate and ITAX – women, age 55-59
Source: Authors’ calculations and Labour Force Survey 1984 1990 1995 2000 2005 2010 2015 .5 .5 5 .6 .6 5 .7 E R -.06 -.04 -.02 0 .02 Itax 1984 1990 1995 2000 2005 2010 2015 .1 .2 .3 .4 .5 .6 E R -.04 -.02 0 .02 .04 Itax
35
Figure 29: Employment rate and ITAX – men, age 60-64
Source: Authors’ calculations and Labour Force Survey
Figure 30: Employment rate and ITAX – women, age 60-64
Source: Authors’ calculations and Labour Force Survey 1984 1990 1995 2000 2005 2010 2015 .1 8 .2 .2 2 .2 4 .2 6 .2 8 E R -.05 0 .05 .1 Itax 1984 1990 1995 2000 2005 2010 2015 .0 5 .1 .1 5 .2 E R 0 .01 .02 .03 .04 .05 Itax
36
5. Retirement incentive: Belgian-specific profile
In this section we present the incentive measures for the OAP for both sexes using the Belgian-specific scenario of earnings as described in Section 3. In addition to the median earner case, we also report the results of low and high earners since our assumptions on career length and earnings profiles may have important effects. For example, low income earners often qualify for the receipt of the guaranteed minimum pension and many pensionable earnings of the median and high earners are replaced with the ceilings for pensionable income.
Figure 31 presents the SSW for the OAP scheme by sex for the age group 60-64 for the three selected earnings profiles. The results are somewhat different from what we obtained with the common profile. We will emphasize on three main points that explain the differences with real-world relevance in the country.
First the Belgian-specific lifetime earnings profile assumes a continuous and almost constant increase of the wage throughout the career while the common profile assumes an important increase of the wage in the first years of career. Since OAP benefit are calculated on the average wage over the entire career, in the Belgian-specific scenario many more years with lower wages are included. In figure 31, this translates into lower SSW for all typical workers as compared to the results of the previous section. On the other hand, the use of the differently shaped Belgian earnings profile does not impact the build-up of SSW for low earners as they are systematically benefiting from the guaranteed minimum pension under both scenarios. Second the Belgium-specific profile assumes shorter careers. In this scenario, each category of worker start working at a different age: low earners men at age 21, low earners women at age 27, median earners men at age 25, median earners women at age 31, high earners men at age 30 and high earners women at age 36. Shorter careers are translated into lower lifetime SSW for every type of worker. This is also true for the low earners for whom the guaranteed minimum pension is adjusted for the length of career.
37
Figure 31: SSW– OAP – age 60-64
Source: Authors’ calculations
Also, because we have assumed shorter careers in the Belgian-specific scenario, workers less often fulfill the career requirements for early retirement even if they reach the EEA. Most notably, the reform that increased the career conditions for early OAP claiming from 20 years in 1997 to 35 in 2005 now directly affects the SSW of low and median-earning women as well as high earners of both sexes. This reform translates into a decrease in SSW for those who do not reach the career requirements for early retirement because each year of potential benefits before the SEA is replaced by a zero.25 Low and median earners men are not directly
25 More specifically: at age 60, low-earner women have 33 years of career and cannot access early retirement at
age 60 from 2004 onwards: eligibility is age 61 in 2004, and 62 from 2005 onwards. Similarly median-earner women have a career of 29 years when they reach the age of 60 and do not meet the career requirements for
38
impacted by this reform as they have sufficiently long careers to retire early. However, as a result of the general increase of the EEA, and the increase in stringency of the long-career exception, low and median-earner men also lose access to OAP benefits at age 60 as of the year 2013. Hence, their SSW at age 60 starts decreasing as of 2013 as a result of the increase in EEA to age 60.5. Similarly, their SSW at age 61 starts decreasing in 2015 when the EEA increases to age 61.5.
Third, the impact of the 2007 reform (i.e., pension bonus) on individuals at different earnings levels can easily be identified on these graphs. The effect is comparable in absolute terms across income levels whatever the earnings level as the pension bonus is a constant amount given for any additional days worked above age 62 or after more than 44 years of career, independently of earnings levels and unaffected by pension ceilings.
Finally, the Belgian-specific scenario also allows for the taxation rules to vary over the years instead of keeping them constant using 2016 tax laws as in the common scenario. The specific impact of taxes in explaining differences in SSW between the common and the Belgian-specific scenarios is only visible for high earners above the age of 60: given the relative brevity of assumed careers, no OAP pensioner actually has to pay the disability or the solidarity contributions on pensions; High-earner OAP pensioners merely start paying a small amount of taxes at older ages from the early 1990’s onwards; Male median-earner OAP pensioners start paying a small amount of taxes as of age 65 starting in 1996; Changes in the tax deduction for replacement income are also mostly visible for high earners only, such as the 1998 decrease of the tax deduction for CER but remain trivial compared to the impact of eligibility reforms.
The most important change in taxation happened for taxes on personal income, which has become less progressive over the years. Smaller taxes for high earners have increased their wage, which is translated into decreasing ITAX over the years. Once again the impact of such reform is fairly limited and mostly indistinguishable next to the eligibility reforms – hence confirming the general validity of results from the common scenario analysis.
early retirement from 2002 onwards. High-earner men have a career of 30 years once they reach the age of 60 and hence do not meet the career requirement for early retirement from 2003 onwards. Finally, high earners women count 24 years of career at age 60 do not meet the career requirement for early retirement from 2000 onwards. From 2004 onwards, male high-earners have to wait until age 63 to retire and women high earners do not have any access to early retirement from 2005 onwards.