Responses of wetland graminoids to the relative supply of nitrogen and
phosphorus
Sabine Güsewell
Utrecht University, Department of Geobiology, P.O. Box 80084, NL⫺3508 TB Utrecht; and Geobotanisches Institut ETH, Zürichbergstrasse 38, CH⫺8044 Zürich; (Tel. ++41-1-632 43 07; Fax. ++41-1-632 12 15; e-mail: [email protected])
Received 3 May 2002; accepted in revised form 20 January 2004
Key words: biomass allocation, Carex, growth experiment, light intensity, N:P ratio, nutrient limitation, nutrient
uptake, tissue nutrient concentrations
Abstract
The biomass production of wetland vegetation can be limited by nitrogen or phosphorus. Some species are most abundant in N-limited vegetation, and others in P-limited vegetation, possibly because growth-related traits of these species respond differently to N versus P supply. Two growth experiments were carried out to examine how various morphological and physiological traits respond to the relative supply of N and P, and whether species from sites with contrasting nutrient availability respond differently. In experiment 1, four Carex species were grown in nutrient solutions at five N:P supply ratios 共1.7, 5, 15, 45, 135兲 combined with two levels of supply 共geometric means of N and P supply兲. In experiment 2, two Carex and two grass species were grown in sand at the same five N:P supply ratios combined with three levels of supply and two light intensities 共45% or 5% day-light兲. After 12-13 weeks of growth, plant biomass, allocation, leaf area, tissue nutrient concentrations and rates and nutrient uptake depended significantly on the N:P supply ratio, but the type and strength of the responses differed among these traits. The P concentration and the N:P ratio of shoots and roots as well as the rates of N and P uptake were mainly determined by the N:P supply ratio; they showed little or no dependence on the supply level and relatively small interspecific variation. By contrast, the N concentration, root mass ratio, leaf dry matter content and specific leaf area were only weakly related to the N:P supply ratio; they mainly depended on plant species and light, and partly on overall nutrient supply. Plant biomass was determined by all factors together. Within a level of light and nutrient supply, biomass was generally maximal共i.e. co-limited by N and P兲 at a N:P supply ratio of 15 or 45. All species responded in a similar way to the N:P supply ratio. In particular, the grass species Phalaris arundinacea and Molinia caerulea showed no differences in response that could clearly explain why P. arundinacea tends to invade P-rich共N-limited兲 sites, and M. caerulea P-limited sites. This may be due to the short duration of the experiments, which investigated growth and nutrient acquisition but not nutrient con-servation.
Introduction
Plastic responses of plants to differences in nutrient supply may determine the ability of species to grow and compete successfully under various nutrient re-gimes共Robinson and Rorison 1988; Tilman and We-din 1991; Reynolds and D’Antonio 1996; Garnier
1998兲. At low nutrient supply, plants do not only grow more slowly that at high nutrient supply but also in-crease their biomass allocation to roots共Poorter and Nagel 2000兲 and reduce the nutrient concentrations of their biomass共Aerts and Chapin 2000兲; various fur-ther morphological and physiological adjustments can enable plants to enhance their nutrient acquisition
共Anuradha and Narayanan 1991; Schachtman et al. 1998; Lipson and Näsholm 2001; Tuomi et al. 2001兲 or to minimise their nutrient losses 共Northup et al. 1998; Eckstein et al. 1999; El-Kahloun et al. 2000; Bausenwein et al. 2001兲. At high nutrient supply, the opposite phenotypic responses enable the plants to improve their carbon gain and to compete more ef-fectively against other plants when light becomes limiting 共Garnier 1998; Hirose and Bazzaz 1998; Schieving and Poorter 1999; Poorter and Nagel 2000兲.
The same type of phenotypic plasticity has been observed in response to nitrogen共N兲 supply under N-limited conditions and in response to phosphorus共P兲 supply under P-limited conditions 共Wilson 1988; In-gestad and Ågren 1991; Ericsson 1995; Ryser et al. 1997兲. This similarity of effects suggests that some plant traits respond to nutrient supply共i.e. fertility兲 in a general way, rather than specifically to the supply of either N or P. For such traits, the effect of a high supply of N could be 共partly兲 negated by a low sup-ply of P and vice-versa. However, strong effects of increased N supply on plant traits have also been found at P-poor sites 共e.g. Falkengren-Grerup 1998; Flückiger and Braun 1998兲, and in some cases plants even responded to increased N and P supply in oppo-site ways共e.g. Treseder and Vitousek 2001; Güsewell et al. 2003兲, suggesting that the responses were spe-cifically determined by the supply of N or P or by the supply of one relative to the other. This may be be-cause the supply of N relative to that of P共N:P sup-ply ratio兲 determines which of the two nutrients limits plant growth 共Güsewell and Koerselman 2002兲, and there may be functional differences between N- and P-limited plants 共Aerts and Chapin 2000兲.
There are many indications that not only changes in productivity but also shifts in the relative supplies of N and P cause changes in plant performance and in the species composition of plant communities共e.g. Verhoeven et al. 1996; Bobbink et al 1998; Roem and Berendse 2000; Willby et al 2001兲. Some species ap-pear to be most successful at high N:P supply ratios 共e.g. Molinia caerulea; Kirkham 2001; Tomassen et al. 2003兲, and others at low N:P supply ratios 共e.g.
Typha × glauca; Woo and Zedler 2002兲, suggesting
that these species respond differently 共in terms of biomass production, morphology and/or physiology兲 to the relative supplies of N and P. If we know how N:P supply ratios affect the growth and functional traits of species that dominate at N- or P-limited sites, this may help us to understand and predict how
changes in the relative supplies of N and P共e.g. due to atmospheric N deposition兲 will affect plant com-munities共Roem et al. 2002; Limpens et al. 2003兲.
Despite the numerous experiments investigating the plastic responses of plants to different nutrient supplies, the role of the N:P supply ratio in determin-ing these responses has rarely been considered explicitly. Only few studies in plant ecology have varied the supplies of N and P independently from each other共e.g. Shaver and Melillo 1984; Ryser and Lambers 1995; Romero et al. 1999; Güsewell et al. 2003兲. As a result, we know little about the morpho-logical and physiomorpho-logical traits that are decisive for the ability of plants to grow and compete under N- or P-limited conditions共but see de Kroon and Bobbink 1997; El-Kahloun et al. 2000兲.
The purpose of this study was to investigate how variation in the N:P supply ratio affects plant growth, biomass allocation, leaf structure, tissue N or P con-centrations, and rates of N or P uptake, and to com-pare these effects to those of variation in overall nutrient共N and P兲 supply, all this for seven grami-noid species from wetlands with contrasting produc-tivity and nutrient limitation. I expected that morpho-logical traits would mainly depend on overall nutrient supply, reflecting similar responses of these traits to N and P supply, whereas physiological traits related specifically to N or P use by plants should depend more on the N:P supply ratio. I further expected that species from differently productive sites would respond differently to overall nutrient supply, whereas species from N- and P-limited sites would respond differently to N:P supply ratios. These hypotheses were tested in two experiments involving differing growth conditions 共substrates, light intensity兲 to assess whether the responses of plants to N:P supply ratios are consistent across growth conditions.
Methods
Plant material
The species used for the two experiments are herba-ceous perennials from various types of wetland veg-etation共Table 1兲. Experiment 1 included four Carex species that occur in sites with contrasting fertility but similar N:P ratios共Table 1a兲. Plants were collected in the field共C. curta in a floating fen, C. disticha in a disturbed marsh兲 or cultivated from seeds 共C. elata,
with garden mould. In April 1999, clones were split into individual ramets共each with 2-3 leaves兲 and kept on tap water until new roots started to developed 共ap-proximately three weeks兲. Each ramet was then placed in an individual beaker, and beakers were ran-domly allocated to the experimental treatments. After a few days, shoots were trimmed to a length of 4 cm to reduce a possible influence of differences in initial size.
Experiment 2 included two Carex and two grass species. One grass, Molinia caerulea, occurs mainly at nutrient-poor, P-limited sites共low nutrient indica-tor value, high mean N:P ratio兲, and the other grass,
Phalaris arundinacea mainly at productive, P-rich
sites共high nutrient indicator value, low mean N:P ra-tio兲; the two Carex species 共C. flava, C. panicea兲 are intermediate 共Table 1b兲. Cuttings of C. panicea and
M. caerulea were collected in a fen meadow near
Zürich 共CH兲 in early May 1998, three weeks before the beginning of the experiment. After removing dead leaves, rhizomes and old roots, individual ramets were kept on tap water so that new roots could de-velop. Seeds of S. flava and P. arundinacea were ger-minated in February 1998 on filter paper; after germination seedlings were cultivated in nutrient-poor horticultural mould in the greenhouse. At plant-ing time, seedlplant-ings and cuttplant-ings had similar size共2-3 leaves兲. To further reduce differences in initial size, all shoots were trimmed to a length of 4 cm one week after planting.
Treatments
Nutrient treatments combined five N:P supply ratios with two or three levels of overall nutrient supply in
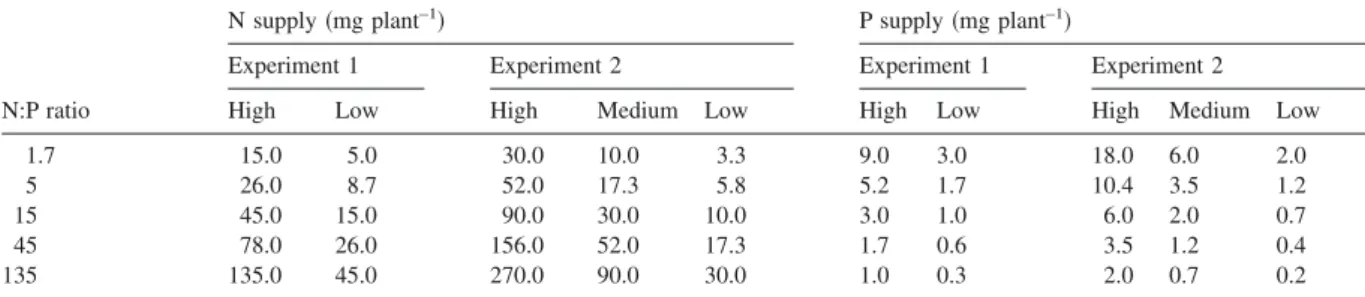
a factorial design. Nutrient supply levels were defined by the geometric mean of the amounts of N and P共in mg兲 supplied per plant over the whole growth period. The geometric mean, rather than the arithmetic mean, was taken as measure because I expected the effects of N and P supply on plant growth to be multiplica-tive rather than addimultiplica-tive. In experiment 1, with two supply levels, the geometric means of N and P sup-ply per plant were 3.9 mg共⫽ low supply兲 and 11.6 mg共⫽ high supply兲; in experiment 2, with three sup-ply levels, these means were 2.58 mg共⫽ low supply兲, 7.75 mg共⫽ medium supply兲 and 23.24 mg 共⫽ high supply兲. Within each supply level, the average N:P ratio was set to 15, the N:P ratio at which plants were likely to be equally limited by N and P共Koerselman and Meuleman 1996兲. Five different N:P supply ra-tios differing by a factor of three共1.7, 5, 15, 45 and 135兲 were obtained by multiplying N supply and di-viding P supply by 0.33, 0.58, 1, 1.73 and 3, respec-tively. The resulting amounts of N and P are given in Table 2.
Nutrients were supplied once or twice weekly, N as KNO3, and P as KH2PO4. All other essential
nu-trients were supplied in constant, non-limiting amounts, based on N supply at the high supply level with N:P ratio 15 and the composition of Hoagland nutrient solutions. For potassium, part of this amount was provided by the compounds used to supply N and P, and the rest by adding KCl. The weekly supply of nutrients was increased over the course of the growth period to be three times greater in the last third than in the first third of the experiment, in order to avoid plants being much more nutrient-limited at the end of the growth period due to their greater size.
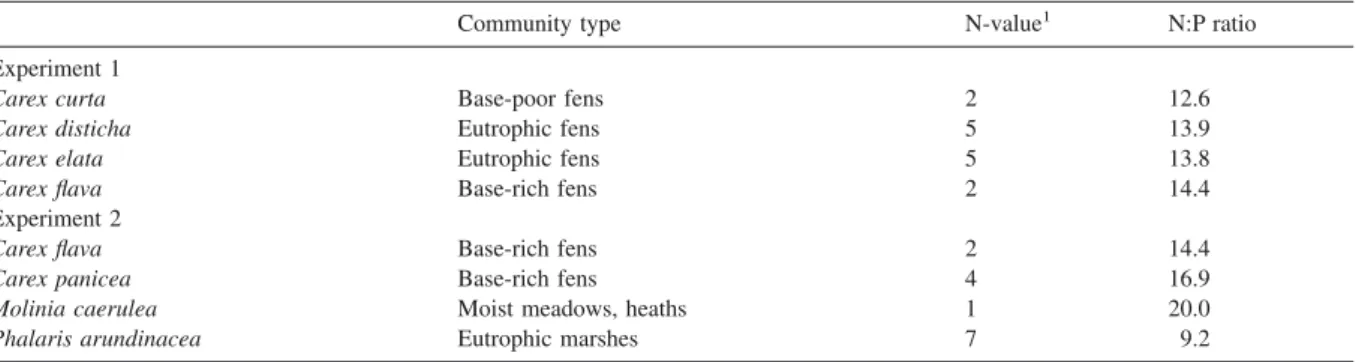
Table 1. Species included in the experiments共nomenclature: Lauber and Wagner 1996兲 with their main habitat 共type of plant community兲
according to Ellenberg 共1996兲, their indicator value for nutrients 共Ellenberg et al. 1991兲 and their mean biomass N:P ratio in the field 共Güsewell and Koerselman 2002兲.
Community type N-value1 N:P ratio
Experiment 1
Carex curta Base-poor fens 2 12.6
Carex disticha Eutrophic fens 5 13.9
Carex elata Eutrophic fens 5 13.8
Carex flava Base-rich fens 2 14.4
Experiment 2
Carex flava Base-rich fens 2 14.4
Carex panicea Base-rich fens 4 16.9
Molinia caerulea Moist meadows, heaths 1 20.0
Phalaris arundinacea Eutrophic marshes 7 9.2
Growth conditions
Experiment 1 took place in an open greenhouse in Zürich, with approximately 50% daylight, between May and July 1999. Plants were grown in nutrient solutions in 0.25-l beakers. Beakers were covered with a black foam lid and wrapped in aluminium foil so as to be dark inside. One shoot per beaker was in-serted in a slide made on one side of the lid, so that the shoot base was at the lid surface and roots hung into the nutrient solution. Six plants per species were randomly allocated to each of the ten nutrient treat-ments共five N:P supply ratios, two overall supply lev-els兲. Nutrient solutions were replaced completely every two weeks. At each time, beakers received 160 ml of a new solution containing the appropriate con-centrations of KNO3, KH2PO4and KCl as well as all
other essential elements. In addition, N, P and K were supplied twice weekly by adding 2 ml of nutrient so-lution to each beaker; evaporated water was replaced simultaneously. Beakers were not aerated, but water movement was caused regularly by adding nutrient solution, adding water or moving plants within the greenhouse 共to reduce effects of spatial variation兲, which likely reduced the depletion of nutrients around roots. At the end of the experiment, the largest plants had completely filled the beakers with their roots and may have been limited in their growth by beaker size, but since this only concerned a few plants grown at the optimal nutrient treatments, it is unlikely that beaker size significantly affected the results.
Experiment 2 took place in the garden of the Geo-botanical Institute ETH in Zürich between June and August 1998. Individual shoots of the four graminoid species were planted in pots 共9 cm diameter兲 with quartz sand in May 1998. Four plants per species were randomly attributed to each of the 15 nutrient treatments 共five N:P supply ratios, three overall
sup-ply levels兲. Two plants per species and treatment grew at 45% and at 5% daylight, respectively, which is comparable to light regimes of 300 and 33mol m⫺ 2 s⫺ 1 during 16 h per day. Light was regulated with green horticultural shading cloth共ST30, HORTIMA, Hausen, Switzerland兲 fixed on wooden frames, both on the top and at the sides, but leaving an open space of approximately 50 cm height above ground to al-low free air circulation around the pots. Two shade houses were constructed per light level. Transparent plastic foil was spanned approximately 30 cm above the shading cloth to protect pots against rainwater. Pots were placed on trays and watered by adding deionised water to the trays. Nutrients were supplied weekly by giving each plant 2 ml of a solution with appropriate concentrations of KNO3, KH2PO4 and
KCl. To prevent a toxic accumulation of nutrients not taken up by plants, pots were leached with deionised water every two weeks, at least four days after the last fertilisation. Treatments lasted for 12 weeks, the last fertilisation being five days before harvest.
Measurements of nutrient uptake
Three replicates of each species and treatment in ex-periment 1 were used for measurements of nutrient uptake. After 13 weeks of cultivation plants were taken out of their beakers together with the lids. Roots were rinsed with deionised water, after which plants were placed into clean breakers filled with deionised water. One day later, plants were placed in new bea-kers containing 170 ml of a standard nutrient solution whose N and P concentrations共6 mg N l–1, 0.34 mg P l–1兲 corresponded approximately to the final concentrations of the treatment with low overall sup-ply and N:P ratio 15. The total weight of beakers 共with nutrient solutions and plants兲 was determined. Exactly 7 h later, beakers were weighed again to
de-Table 2. Total amounts of nitrogen and phosphorus supplied to each plant in the course of the growth experiments. Treatments combined five
N:P supply ratios with two or three levels of nutrient supply共‘high’, ‘medium’, ‘low’兲.
N supply共mg plant–1兲 P supply共mg plant–1兲
Experiment 1 Experiment 2 Experiment 1 Experiment 2
N:P ratio High Low High Medium Low High Low High Medium Low
1.7 15.0 5.0 30.0 10.0 3.3 9.0 3.0 18.0 6.0 2.0
5 26.0 8.7 52.0 17.3 5.8 5.2 1.7 10.4 3.5 1.2
15 45.0 15.0 90.0 30.0 10.0 3.0 1.0 6.0 2.0 0.7
45 78.0 26.0 156.0 52.0 17.3 1.7 0.6 3.5 1.2 0.4
termine water loss. Plants were then removed, gently shaking water from roots. The remaining solution in the beakers was mixed; samples 共20 ml兲 were taken and stored frozen until the concentrations of nitrate, ammonium and phosphate were analysed colorimet-rically on a continuous-flow analyser 共Skalar SA-40, Skalar, Breda, NL兲. Differences in water volume and in nutrient concentrations were used to calculate what percentage of the original amounts of N and P had been taken up by plants during 7 h.
Harvest and measurements
At harvest plants were subdivided into above-ground biomass 共‘shoots’ ⫽ leaf blades, leaf sheaths and culms兲 and below-ground biomass 共‘roots’ ⫽ rhi-zomes and roots兲. In experiment 2, the total area of leaf blades was measured on a leaf area meter, and their fresh weight was determined after several hours between wet paper tissues to obtain maximal water saturation. All harvested plant material was dried共48 h at 70 °C兲 and weighed. The data were used to cal-culate the root mass ratio 共RMR, ratio of below-ground biomass to total biomass兲, specific leaf area 共SLA, ratio of leaf area to leaf dry mass兲 and dry matter content 共DM, ratio of leaf dry mass to leaf fresh mass兲.
For nutrient analyses, plant material was ground in a centrifugal mill and digested with a modified Kjeldahl procedure 共1 h at 200 °C and 2 h at 340 °C in a mixture of concentrated sulphuric acid, salicylic acid, copper and selenium兲. Concentrations of N and P in the digests were analysed colorimetrically on a continuous-flow analyser 共Skalar SA-40, Skalar, Breda, NL兲. Only three replicates of each species and treatment were analysed in experiment 1, discarding plants that had been used for nutrient uptake measurements.
Data analysis
Responses to nutrient treatments were analysed sta-tistically using analysis of variance, graphically by plotting treatment means against the N:P supply ra-tio, and finally, by calculating norms of reaction for the plastic responses of each species to treatments. The purpose of the statistical analysis was to compare and to test the effects of the N:P supply ratio, the overall level of nutrient supply and their interaction as well as of interspecific differences. Experiment 1 was analysed with a three-way full-factorial ANOVA
共main factors ⫽ N:P supply ratio, overall level, spe-cies, all fixed factors兲. Experiment 2 had a split-plot design with light intensity as main-plot factor and nutrient treatments and species as subplot factors. Because the responses to nutrient supply differed considerably between 45% and 5% light intensity, data were analysed for the two light levels separately, treating shade houses as blocks共fixed factor兲. All cal-culations were carried out with the statistical software JMP, Version 3.2.2共SAS Institute 1989-1997兲.
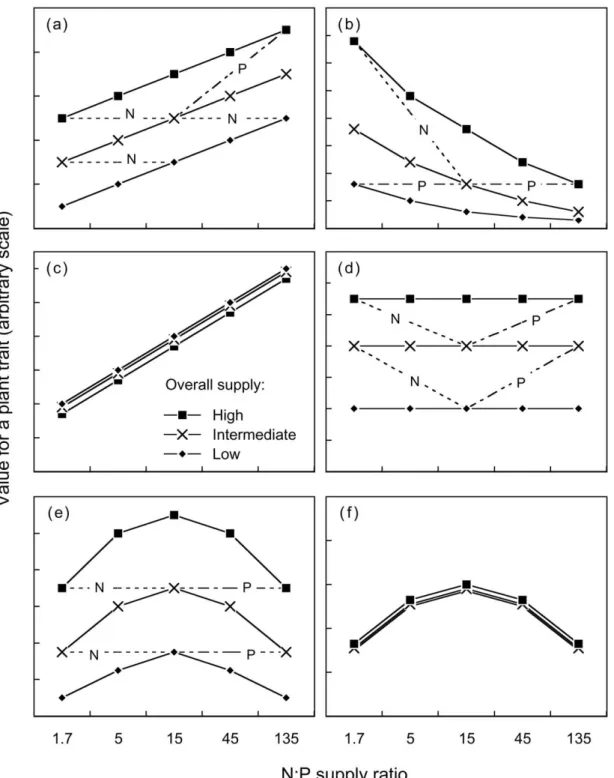
The purpose of the graphical analysis was to visualise whether plant traits were determined by an individual nutrient共N or P兲, the N:P supply ratio, the overall level of nutrient supply, the limiting nutrient or the共un兲balance of nutrient supply. These various options are shown with fictive data in Figure 1. Each graph in Figure 1 represents measurements of a hy-pothetical plant trait for the 15 nutrient treatments of experiment 2 共five N:P supply ratios on the x-axis, three level of overall supply represented by different symbols兲. Figure 1a represents a plant trait entirely determined by the supply of nitrogen. Measurements increase with increasing N:P supply ratio, and all pairs of treatments with the same supply of N 共cf. Table 1兲 have the same values for the trait 共horizontal dashed lines; only shown for some of the pairs兲. By contrast, treatments with the same supply of P can have strongly different values for the trait共one dotted line shown as example兲. Figure 1b represents a plant trait entirely determined by the supply of phosphorus; patterns are exactly opposite to those in Figure 1a, i.e. the same supply of P results in the same values for the trait共horizontal dotted lines兲. A linear relationship is arbitrarily shown in 1a, and a non-linear relation-ship in 1b, but both may occur with either type of limitation. In Figure 1c, the plant trait is entirely de-termined by the N:P supply ratio, being independent of overall nutrient supply. High and low N:P ratios are associated with contrasting values for this trait, and measurements are intermediate when the supply of N and P is balanced. In Figure 1d, the plant trait is en-tirely determined by overall nutrient supply, being in-dependent of the N:P supply ratio. This situation would arise if N supply and P supply influence the trait in exactly the same way, so that the effects of increasing one nutrient and decreasing the other com-pensate each other. Both in 1c and in 1d, pairs of treatments with the same supply of N or P always differ for the plant trait considered. Figure 1e repre-sents the situation where the trait is determined by N supply or by P supply depending on the N:P supply
Figure 1. Theoretical relationships between a plant trait and the N:P supply ratio, for plant traits determined by共a兲 the supply of nitrogen
共N-limited兲, 共b兲 the supply of phosphorus 共P-limited兲, 共c兲 the N:P supply ratio, 共d兲 overall nutrient supply, 共e兲 N or P, depending on the N:P supply ratio, and共f兲 the degree of balance in nutrient supply. Each symbol in the graphs represents one of the 15 nutrient treatments of experiment 2. The five N:P supply ratios are plotted on the x-axis, and the three levels of overall supply are visualised by different symbols. Where appropriate, dashed or dotted lines show examples of pairs of treatments receiving the same supply of N共dashed兲 or P 共dotted兲.
ratio, with a threshold around N:P⫽ 15. Below this threshold共N-limitation兲, similar values of the trait are obtained for pairs of treatments with the same N-sup-ply, and above this threshold 共P-limitation兲 similar values are obtained with the P-supply. Finally, Figure 1f represents the situation where the trait is deter-mined by the balance or unbalance of nutrient sup-ply: its value is reduced when the N:P supply ratio is above or below 15, regardless of overall supply. The six situations represented in Figure 1 are theoretical extremes, and any intermediate or combination of them may occur in practice.
Two graphs are presented for each variable: one showing how the effects of the N:P supply ratio de-pend on overall nutrient supply 共treatment means across species兲, and one showing how each species responds to the N:P supply ratio 共averaged across supply levels, at 45% light in experiment 2兲. This simplified representation adequately shows the effects of treatments because the three-way interactions 共species ⫻ N:P ratio ⫻ supply level兲 were always weak and in most cases not significant. Full data are available from the author on request.
To quantify and compare the plasticity of plants in response to the three main experimental factors 共N:P supply ratio, overall supply, light兲, norms of reaction of the species to each of these factors were calculated for some variables共total biomass, root mass ratio, N and P concentrations in shoots兲. First, least-squares means of the four variables were determined for each species and each level of the three main factors. The norm of reaction to light intensity or to overall nutri-ent supply was the difference between means for the high and the low level of the factor divided by the overall mean. The norm of reaction to the N:P supply ratio was the difference between the highest and the lowest of the five means, divided by the overall mean.
Results
Biomass and allocation
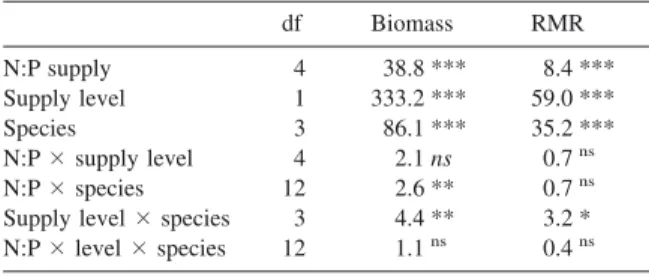
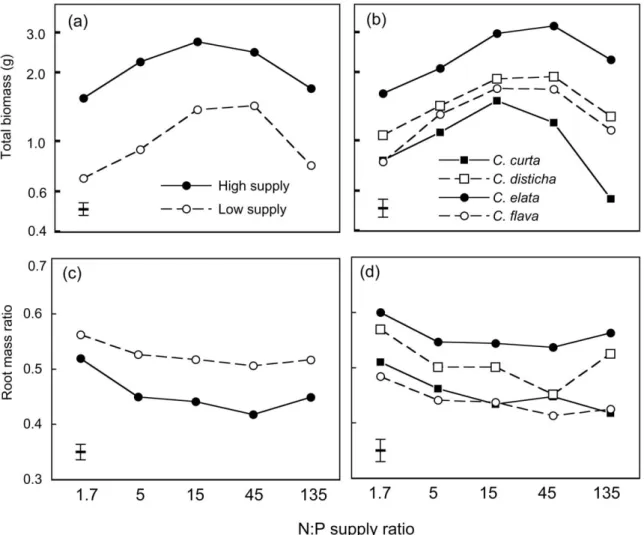
In experiment 1, total biomass 共above and below ground兲 was affected significantly by the three main factors, i.e. the N:P supply ratio, overall nutrient sup-ply and species共Table 3兲. Two-way interactions were significant but of minor importance compared with main effects 共cf. F-values in Table 3兲, i.e. relation-ships between total biomass and N:P supply ratios were essentially similar for the two supply levels
共Figure 2a兲 and for the four species 共Figure 2b兲. Some differences were nevertheless apparent: biomass was greatest at a N:P supply ratio of 15 with the high sup-ply level but 45 with the low supsup-ply level共Figure 2a兲, and C. curta was reduced more severely at N:P⫽ 135 than the three other species共Figure 2b兲.
The root mass ratio共RMR兲 was also affected sig-nificantly by the three main factors, but these effects were less pronounced than for biomass 共smaller
F-values in Table 3兲. Again, the effects of N:P ratios
were largely consistent across species and supply levels, i.e. the RMR was always maximal at N:P⫽ 1.7, and generally minimal at N:P⫽ 45 共Figure 2c, d兲. At all N:P supply ratios, the RMR was greater at the low supply level than at the high one共Figure 2c兲; the species with the greatest allocation to roots was always C. elata, which also had the greatest total bio-mass, and the species with the smallest allocation to roots was C. flava共Figure 2d兲.
In experiment 2, the total biomass of plants differed considerably between 45% and 5% daylight 共Figure 3a兲. Within each light level, biomass depended sig-nificantly on the N:P supply ratio, overall nutrient supply and species, but the importance of these fac-tors differed: at 45% daylight, overall nutrient supply had the strongest effect on biomass, whereas at 5% daylight, differences were mainly among species 共Table 4兲. At 45% daylight, overall nutrient supply also determined how total biomass was related to the N:P supply ratio: with high or intermediate nutrient supply, biomass was maximal at N:P supply ratios of 15 or 45, but with low nutrient supply biomass increased up to N:P⫽ 135 共Figure 3a兲. Of the four species, three had their maximal biomass 共averaged across supply levels兲 at N:P ⫽ 45, with little differ-ence between N:P⫽ 45 and 135. In contrast, the
bio-Table 3. Effects of the N:P supply ratio and level of nutrient supply
on total biomass共log-transformed兲 and root mass ratio 共RMR兲 of four Carex species in experiment 1. Figures are F-ratios and levels of significance from three-way ANOVA. ***⫽ P ⬍ 0.001; ** ⫽
P ⬍ 0.01, * ⫽ P ⬍ 0.05;ns⫽ P ⱖ 0.05. df Biomass RMR N:P supply 4 38.8 *** 8.4 *** Supply level 1 333.2 *** 59.0 *** Species 3 86.1 *** 35.2 *** N:P⫻supply level 4 2.1 ns 0.7ns N:P⫻species 12 2.6 ** 0.7ns
Supply level⫻species 3 4.4 ** 3.2 *
mass of M. caerulea was maximal at N:P⫽ 15 and minimal at N:P⫽ 135 共Figure 3b兲.
More biomass was allocated to roots at 45% than at 5% daylight 共Figure 3c兲. Within each light level, the RMR was affected significantly by the three main factors, whereas none of the interactions was signifi-cant 共Table 4兲. In general, the RMR decreased with increasing overall nutrient supply and with increasing N:P ratio共Figure 3c兲. M. caerulea had a higher RMR than the other species, and its RMR increased at high N:P supply ratios共Figure 3d兲.
The plasticity of biomass and RMR in response to the treatments varied among species共Table 5兲. Within species, responses to N:P supply ratios and to overall nutrient supply were similar, whereas responses to
light共experiment 2兲 were often stronger. P.
arundina-cea was most plastic in response to nutrients and least
plastic in response to light. M. caerulea and C.
pani-cea were least responsive to nutrients but M. caerulea
was most responsive to light. The RMR was greater and less plastic in M. caerulea than in the three other species共Table 5兲.
Leaf structure
Leaf structure in experiment 2 differed considerably between 45% and 5% daylight and among species 共Table 4; Figure 4兲. The effects of N:P supply ratios were comparatively weak and not consistent. At 45% daylight, leaf dry matter content共DM兲 increased and
Figure 2. Total biomass共log scale兲 and roots mass ratio of four Carex species after 13 weeks of growth in nutrient solutions with five
different N:P supply ratios and two levels of overall nutrient supply共experiment 1兲. Graphs 共a兲 and 共c兲 show means of the four species for each supply level; graphs共b兲 and 共d兲 show means of the two supply levels for each species; error bars indicate ⫾ 1 SE of the means, as derived from three-way Anova.
the specific leaf area 共SLA兲 decreased with increas-ing N:P supply ratio 共Figure 4a, c兲. The increase in DM occurred in all species 共Figure 4b兲, whereas the decrease in SLA was essentially limited to P.
arundi-nacea 共Figure 4d兲. At 5% light, nutrient treatments
hardly affected the leaf structure.
Nutrient uptake
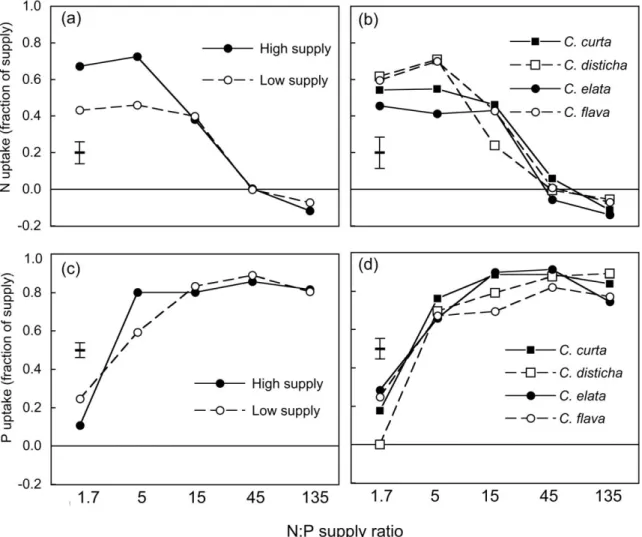
The rates of N and P uptake from a standard nutrient solution at the end of experiment 1 depended prima-rily on the N:P supply ratio during growth; in com-parison, overall nutrient supply only had a weak effect on N uptake and no consistent effect on P
up-take共Table 6兲. Between 23% and 85% of the N was taken up in 7 h by plants grown at N:P ratios ⱕ 15, but less than 15% of the N by plants grown at N:P ⱖ 45 共Figure 5a, b兲. Between 50% and 92% of the P was taken up by plants grown at N:P ⱖ 5, but less than 40% of the P by plants grown at N:P⫽ 1.7 共Fig-ure 5c, d兲. The effects of N:P supply ratios and of overall supply interacted significantly 共Table 2兲: plants grown at the low supply level and low N:P ra-tio took up less N than plants grown at the high sup-ply level, whereas supsup-ply levels did not differ at high N:P ratios 共Figure 5a兲; for P uptake the interaction had an irregular pattern共Figure 5c兲. The uptake rates of the four species and their responses to N:P supply
Figure 3. Total biomass共log scale兲 and root mass ratio of four graminoid species after 12 weeks of growth in sand 共experiment 2兲 at five N:P
supply ratios, two light intensities共45% or 5% daylight兲 and three levels of overall nutrient supply 共H ⫽ high, M ⫽ medium, L ⫽ low兲. Graphs共a兲 and 共c兲 show means of the four species for each light and supply level; graphs 共b兲 and 共d兲 show means of the three supply levels at 45% daylight for each species; error bars indicate ⫾ 1 SE of the means, as derived from three-way Anova.
ratios were similar. The main difference was that C.
flava and C. disticha took up N faster than C. curta
and C. elata when N was limiting 共Figure 5b兲, but they did not take up P faster when P was limiting 共Figure 5d兲.
Nutrient concentrations and N:P ratios of plant biomass
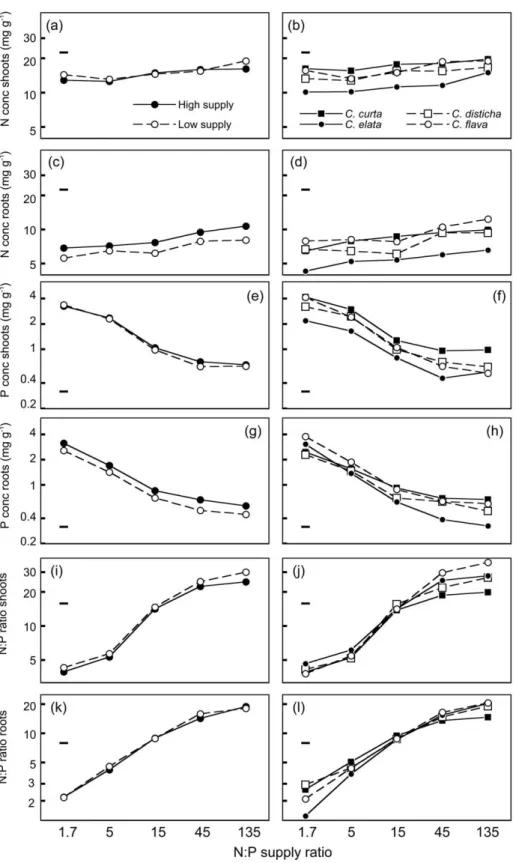
In both experiments, the N and P concentrations and N:P ratios of shoots and roots depended significantly on the N:P supply ratio共Table 6; Anova results for experiment 2 were similar and are not shown兲. The N concentration varied less than two-fold across the range of N:P supply ratios 共Figure 6a-d and 7a-d兲,
Table 4. Effects of the N:P supply ratio and level of nutrient supply on total biomass共log-transformed兲, root mass ratio 共RMR兲, leaf dry
matter content共DM兲 and specific leaf area 共SLA, log-transformed兲 of four wetland graminoids in experiment 2. Data were analysed sepa-rately for plants grown at 45% and 5% daylight. Figures are F-ratios and levels of significance from three-way ANOVA for a block design. ***⫽ P ⬍ 0.001; ** ⫽ P ⬍ 0.01, * ⫽ P ⬍ 0.05;ns⫽ P ⱖ 0.05.
df Biomass RMR Leaf DM SLA
45% daylight N:P supply ratio 4 25.0 *** 4.5 ** 16.0 *** 11.3 *** Supply level 2 77.9 *** 15.2 *** 0.4ns 7.7 ** Species 3 22.0 *** 16.5 *** 188.4 *** 350.7 *** N:P⫻supply level 8 2.9 ** 1.1ns 2.4 * 3.4 ** N:P⫻species 12 2.5 ** 0.9ns 1.1ns 2.5 *
Supply level⫻species 6 1.5ns 0.5ns 0.6ns 5.6 ***
N:P⫻level⫻species 24 1.3ns 0.6ns 1.5ns Block 1 0.1ns 3.6ns 4.7 * 0.0ns 5% daylight N:P supply ratio 4 6.3 *** 7.5 *** 2.3ns 1.0ns Supply level 2 5.2 ** 13.0 *** 2.6ns 0.2ns Species 3 52.1 *** 44.0 *** 321.4 *** 163.8 *** N:P⫻supply level 8 1.3ns 1.3ns 1.4ns 0.3ns N:P⫻species 12 1.6ns 1.2ns 1.8ns 0.5ns
Supply level⫻species 6 2.4 * 1.4ns 0.8ns 0.3ns
N:P⫻level⫻species 24 1.1ns 0.6ns 1.3ns 0.5ns
Block 1 1.2ns 19.9 *** 0.7ns 0.1ns
Table 5. Plasticity of total biomass and of the root mass ratio in response to variation in the N:P supply ratio, level of nutrient supply and
light intensity for each species in experiments 1 and 2. For both variables the mean across all treatments is given in the first column; plas-ticity共in % of the overall mean兲 is the relative difference between the highest and the lowest treatment mean for each of the three experi-mental factors.
Total biomass Root mass ratio
Mean共g兲 N:P ratio Supply
level
Light Mean N:P ratio Supply
level Light Experiment 1 Carex curta 0.97 82.8 90.9 0.45 20.1 6.9 Carex disticha 1.47 58.4 67.3 0.51 23.1 19.3 Carex elata 2.35 67.6 64.8 0.56 11.3 12.4 Carex flava 1.27 72.9 79.1 0.44 16.4 17.2 Experiment 2 Carex flava 0.77 72.9 67.5 116.9 0.35 34.3 31.3 48.9 Carex panicea 0.58 32.2 42.0 124.9 0.38 17.6 13.6 31.7 Molinia caerulea 0.39 32.7 48.2 133.3 0.49 13.4 17.0 14.0 Phalaris arundinacea 0.80 83.8 75.3 61.4 0.32 52.3 31.4 28.8
whereas the P concentration and N:P ratio varied five-to ten-fold 共Figure 6e-l and 7e-l兲. This difference is reflected by the differing F-values for the effects of
N:P supply ratios in Table 6. The P concentration and N:P ratio responded far more to the N:P supply ratio than any of the morphological variables.
Figure 4. Leaf dry matter content and specific leaf area共log scale兲 of three or four graminoid species after 12 weeks of growth in sand
共experiment 2兲 at five N:P supply ratios, two light intensities 共45% or 5% daylight兲 and three levels of overall nutrient supply 共H ⫽ high, M ⫽ medium, L ⫽ low兲. The SLA of C. flava was not determined for lack of time. Graphs 共a兲 and 共c兲 show means of the three or four species for each light and supply level; graphs共b兲 and 共d兲 show means of the three supply levels at 45% daylight for each species; error bars indicate
⫾ 1 SE of the means, as derived from three-way Anova.
Table 6. Effects of the N:P supply ratio and level of nutrient supply on the nutrient uptake共fraction of N or P taken up in 7 h from a standard
solution兲 and on the N and P concentrations and N:P ratios of shoots and roots of four Carex species in experiment 1. Figures are F-ratios and levels of significance from three-way ANOVA with arcsine-transformed共nutrient uptake兲 or log-transformed 共other variables兲 data. *** ⫽ P ⬍ 0.001; ** ⫽ P ⬍ 0.01, * ⫽ P ⬍ 0.05;ns⫽ P ⱖ 0.05.
Nutrient uptake N concentration P concentration N:P ratio
df N P Shoot Root Shoot Root Shoot Root
N:P supply ratio 4 84.4 *** 100.2 *** 12.4 *** 25.7 *** 408.8 *** 264.4 *** 715.5 *** 795.0 ***
Supply level 1 3.5ns 0.0ns 2.9ns 42.3 *** 1.9ns 29.7 *** 11.7 ** 0.7ns
Species 3 1.4ns 2.9 * 37.2 *** 53.4 *** 59.8 *** 17.7 *** 11.9 *** 5.8 **
N:P⫻supply level 4 2.3ns 4.3 ** 1.6ns 0.9ns 0.7ns 0.3ns 0.8ns 1.1ns
N:P⫻species 12 1.0ns 4.3 *** 0.8ns 1.5ns 2.4 * 4.1 *** 3.8 *** 9.2 ***
Supply level⫻species 3 1.0ns 5.6 ** 2.4ns 2.9 * 4.2 ** 4.9 ** 4.3 ** 7.3 ***
Overall nutrient supply had little effect on the nu-trient concentrations of shoots in experiment 1 and on the N:P ratios of shoots and roots in both experiments. In contrast, the N and P concentrations of shoots in experiment 2 and the N and P concentrations of roots in both experiments differed by 20-45% between the high and low supply levels共Figure 6, Figure 7, Table 6兲. In experiment 2, the N and P concentrations of plants grown at 5% daylight exceeded those of plants grown at 45% daylight. The difference between both light levels was particularly large for the P concentra-tion of plants grown at high N:P supply ratios共Figure 6e, g兲. Therefore, the N:P ratio of shoots and roots did not reach as high values at high N:P supply ratio
with 5% daylight than with 45% daylight共Figure 7i, k兲.
Interspecific differences in tissue nutrient concen-trations were always significant but of differing im-portance共Table 6兲. Relative to treatment effects, the N concentration tended to vary more among species than the P concentration and the N:P ratio共Figure 6, Figure 7兲. In experiment 1, C. curta generally had the highest and C. elata the lowest N and P concentra-tions. In experiment 2, species ranked differently for N and P and for shoots and roots.
All species showed the same type of responses to the treatments 共Figure 6, Figure 7兲. Nevertheless, species-by-treatment interactions were significant 共Table 6兲 because the strength of the responses
共plas-Figure 5. Nutrient uptake by Carex plants after 13 weeks of growth in nutrient solutions with five different N:P supply ratios and two levels
of overall nutrient supply共experiment 1兲, given as the percentage N or P taken up from standard nutrient solutions 共6 mg N l–1, 0.34 mg P l–1兲 during 7 h. Graphs 共a兲 and 共c兲 show means of the four species for each supply level; graphs 共b兲 and 共d兲 show means of the two supply levels for each species; error bars indicate ⫾ 1 SE of the means, as derived from three-way Anova.
Figure 6. Concentrations of N and P as well as N:P ratio of shoots and roots共all on a log scale兲 of four Carex species after 13 weeks of
growth in nutrient solutions with five different N:P supply ratios and two levels of overall nutrient supply共experiment 1兲. Graphs on the left side show means of the four species for each supply level; graphs on the right side show means of the two supply levels for each species; error bars共generally of negligible size兲 indicate ⫾ 1 SE of the means, as derived from three-way Anova.
Figure 7. Concentrations of N and P as well as N:P ratio of shoots and roots共all on a log scale兲 of four graminoid species after 12 weeks of
growth in sand共experiment 2兲 at five N:P supply ratios, two light intensities 共45% or 5% daylight兲 and three levels of overall nutrient supply 共H ⫽ high, M ⫽ medium, L ⫽ low兲. Graphs on the left side show means of the four species for each light and supply level; graphs on the right side show means of the three supply levels at 45% daylight for each species; error bars共generally of negligible size兲 indicate ⫾ 1 SE of the means, as derived from three-way Anova.
ticity兲 varied among species. In experiment 1, the in-terspecific differences in plasticity were not consis-tent: each species had the greatest plasticity for either N or P concentration and for either the N:P supply ra-tio or overall supply 共Table 7兲. In experiment 2, P.
arundinacea had the most plastic shoot N
concentra-tion in response to all three experimental factors, whereas the N and P concentrations of M. caerulea were least plastic in response to N:P supply ratios 共Table 7, see also Figure 7b, f, j兲.
Discussion
This study combined two experiments using different plant species, different substrates 共nutrient solutions vs. sand兲 and different light intensities 共45% vs. 5% daylight兲. Some effects of N:P ratios occurred consis-tently, whereas others depended on species and growth conditions. To determine which effects of N:P supply ratios are generally valid, it is useful to com-pare the patterns shown here with those from published experiments. As the design of nutrient treatments differed among studies, these comparisons do generally not take into account differences in overall supply level and should therefore be inter-preted with some caution.
Nutrient limitation of biomass production
In both experiments, total biomass production de-pended significantly on both the N:P ratio and the
overall level of nutrient supply. The only exceptions were C. panicea and M. caerulea grown at 5% light intensity. The low biomass and the high nutrient con-centrations of these species suggest that light limita-tion prevented them from responding to nutrient supply. With all other species, relationships between biomass and N:P supply ratios共Figure 2, Figure 3兲 were intermediate between those depicted in Figure 1a and Figure 1e: biomass either increased monotoni-cally with increasing N:P ratio 共N-limitation兲 or reached a maximum at a N:P ratio of 15 or 45 共N-limitation below this threshold and P-共N-limitation above兲. The finding that growth was generally N-lim-ited at a N:P ratio above 15 contrasts with the sug-gestion that the optimal N:P ratio for vascular plant growth is 10-15 共Duarte 1992; Koerselman and Meuleman 1996; Pegtel et al. 1996兲, but it concurs with the results of other growth experiments, which all found N limitation at N:P supply ratios higher than 15共Veerkamp et al. 1980; Shaver and Melillo 1984; Thornton 1991; Ryser and Lambers 1995; Romero et al. 1999兲.
Various reasons may cause the N:P ratio separating N from P limitation to be higher in growth experiments than in the field. First, all N and P sup-plied in the experiments could be taken up directly by plants. No phosphate was fixed by the quartz sand used in experiment 2 within two days共S. Güsewell, unpublished data兲, and the uptake experiments showed that most P was taken up after 7 h plants roots 共Figure 5c, d兲. In the field, P is often acquired with the help of root exudations or mycorrhizal
associa-Table 7. Plasticity of the N and P concentrations of shoots in response to variation in the N:P supply ratio, level of nutrient supply and light
intensity for each species in experiments 1 and 2. For both variables the mean across all treatments is given in the first column; plasticity共in % of the overall mean兲 is the relative difference between the highest and the lowest treatment mean for each of the three experimental factors.
N concentration of shoots P concentration of shoots
Mean共mg g–1兲 N:P ratio Supply level Light Mean共mg g–1兲 N:P ratio Supply level Light Experiment 1 Carex curta 17.6 23.3 18.3 1.69 186.1 12.0 Carex disticha 14.7 26.2 5.1 1.21 201.2 19.1 Carex elata 11.3 42.5 3.0 0.95 185.1 0.4 Carex flava 16.2 35.5 0.2 1.26 282.1 11.9 Experiment 2 Carex flava 20.0 26.3 25.2 31.3 1.92 175.8 19.5 76.7 Carex panicea 23.2 10.9 17.4 43.7 2.03 142.8 42.4 67.2 Molinia caerulea 22.3 8.1 21.8 15.5 1.51 108.4 27.8 41.6 Phalaris arundinacea 19.9 36.4 34.1 50.4 1.74 163.9 13.7 68.4
tions 共Kroehler and Linkins 1988; Schachtman et al. 1998; Koide and Kabir 2000; Treseder and Vitousek 2001兲. These mechanisms entail costs in terms of carbon and nitrogen共Ratnayke et al. 1978; Clarkson 1985兲. Fertilisation with P in the field increases the fraction of total soil P that is dissolved in the soil so-lution 共Kovar and Barber 1988兲, enabling plants to acquire their phosphorus at lower costs 共Caldwell et al. 1992兲. In this way, fertilisation with P may even enhance the biomass production of plants that are in short supply of N.
The occurrence of N limitation at high N:P supply ratios may also be particular to short-term growth ex-periments with young plants. Wetland plants, espe-cially graminoids, can take advantage of high N supply even when P is scarce by producing biomass with a low P concentration and through the translo-cation of P from old to young plants parts共Veerkamp et al. 1980; Jonasson and Chapin 1985; Perez-Corona and Verhoeven 1996兲. However, this may lead to re-duced growth subsequently 共Güsewell et al. 2003; Limpens et al. 2003兲. In addition, young plants have to take up all nutrients used for growth from the en-vironment, whereas older plants partly use nutrients which they stored previously 共e.g. Jonasson and Chapin 1985; Pfadenhauer and Lütke-Twenhöven 1986; Bernard et al. 1988兲. The ability of plants to recycle N and P differs: only 50-60% of N, but as much as 80-90% of P can be resorbed from the above-ground biomass 共Aerts and Chapin 2000兲. Graminoids are particularly efficient in resorbing P 共Aerts 1996; Aerts et al. 1999兲, which may cause the biomass N:P ratio of older plants to be lower than the N:P supply ratio. The effects of N:P supply ratios on nutrient storage and on long-term performance need further investigation to fully understand why the op-timal N:P ratios seem to differ between short-term and long-term growth.
Biomass allocation and morthology
The root mass ratio 共RMR兲 generally decreased with increasing N:P ratio and with increasing overall nu-trient supply; this indicates that it was primarily de-termined 共i.e. reduced兲 by the supply of N, as proposed by Lambers et al. 共1998兲. A similar pattern of response was found by Ryser and Lambers共1995兲 and Shaver and Melillo 共1984兲. In all these cases N was more limiting for plant growth than P, so the RMR was primarily determined by the supply of the limiting nutrient. This would be consistent with the
model that the RMR is controlled by the ability of shoots to act as sinks for assimilates共Wilson 1988兲. However, there are also counter-examples: Perez-Co-rona and Verhoeven共1999兲 found that P supply did not or did only weakly, influence the RMR of C.
di-andra, C. rostrata and C. acutiformis even though it
had a considerable effect on their biomass production. Conversely, a ten-fold difference in P supply caused an almost two-fold difference in the RMR of two wheat cultivars, although their biomass production was hardly affected共Horst et al. 1996兲. In experiment 1 of this study, the RMR of C. elata decreased less with increasing N:P supply ratio than that of C. curta and C. flava, yet their biomass responded similarly. The RMR can also respond differently to N supply according to the growth medium, amount and form of N used 共Crabtree and Bazzaz 1993; Leith et al. 1999兲. In conclusion, none of the simple control mechanisms suggested in Figure 1 seems to apply generally for the RMR.
Leaf morphology 共dry matter content and SLA兲 was much more affected by light intensity than by nutrient supply, as is generally the case 共e.g. Peace and Grubb 1982; Olff 1992兲. At 45% light 共but not at 5% light兲 leaf dry matter content increased and SLA decreased with increasing N:P supply ratio; there was basically no effect of overall nutrient supply 共as in Figure 1c兲. These responses were surprising for two reasons: First, SLA is normally positively correlated with the growth rate across nutrient levels 共Poorter and Nagel 2000兲. As biomass tended to increase with increasing N:P supply ratio, an increase rather than a decrease in SLA might have been expected. Second, dry matter content is generally positively correlated, and SLA negatively correlated with the life span of biomass 共but see Diemer et al. 1992; Ryser 1996; Schläpfer and Ryser 1996; Reich et al. 1999; Ryser and Urbas 2000兲. Increasing dry matter content of leaves would therefore suggest that their life span should be higher at high N:P supply ratios, but the opposite was suggested by growth experiments with wetland plants and by field experiments 共Bollens 2000; Gordon et al. 2001; Tomassen et al. 2003兲.
The responses of leaf morphology to N:P ratios also differed in other experiments. Ryser and Lambers 共1995兲 found the SLA of Dactylis glomerata to be in-dependent of the N:P supply ratio and that of
Brac-hypodium pinnatum to increase with increasing N:P
supply ratio. The results of some studies varying the supply of P concur with my results共Ryser et al. 1997; Perez-Corona and Verhoeven 1999兲, but studies
vary-ing the supply of N yielded inconsistent results 共Fichtner and Schulze 1992; Garnier and Freijsen 1994兲. There seems to be no consistent pattern in the effects of N:P ratios on leaf morphology, as there are no consistent patterns in the effects of nutrient supply in general共Dijkstra 1989兲.
Nutrient uptake and concentrations in biomass
Nitrogen and phosphorus concentrations in plant bio-mass were related to the N:P supply ratio in opposite ways. The tissue N concentration was also less plas-tic in response to the N:P supply ratio than the P con-centration. In both experiments, the N concentration varied more among species than among treatments, whereas the P concentration共and the N:P ratio兲 var-ied more among treatments. The effect of overall nu-trient supply on the N concentration was sometimes stronger than that of the N:P supply ratio, whereas the P concentration always depended mostly on the N:P supply ratio. All these differences between N and P have been found more generally in field and green-house experiments共Güsewell and Koerselman 2002兲. Even the large variation in P concentrations found here is not exceptional, as six-fold variation in P con-centration was found between unfertilised and P-fer-tilised plots in field experiments共Kielland and Chapin 1994兲, and up to ten-fold variation in other growth experiments 共Veerkamp et al. 1980兲.
The contrasting patterns of variation in N and P concentrations suggest that N uptake is mainly regu-lated by demand共Imsande and Touraine 1994兲, while P uptake depends more on availability 共Kielland and Chapin 1994; Schachtman et al. 1998兲. The uptake trial carried out at the end of experiment 1 also illus-trates this difference: P-limited plants共grown at N:P supply ratios of 45 or 135兲 hardly took up any nitrate, whereas N-limited plants 共grown at a N:P supply ra-tio of 5兲 took up a large part of the phosphate within 7 h, although their demand for P must have been low. The uptake of P was only reduced in plants grown at a N:P supply ratio of 1.7, probably to prevent a toxic accumulation of P when its supply was excessive. This type of relationship between N:P supply ratios and nutrient uptake from a standard solution is typi-cal and has even been used as an indicator of nutrient availability for algae 共Suttle and Harrison 1988 and references therein兲. The dependence of the relative uptake rates of N and P on the N:P supply ratio was mostly independent of overall nutrient supply during growth. The lower uptake of N from plants with low
N:P ratio grown at the low supply level共Figure 5a兲 might have been due to the small size of their root systems, rather than low root activity, as solutions in beakers were not constantly mixed during the uptake trial.
Interspecific differences
The four species within each experiment varied two-to three-fold in average biomass production; species that normally occur at the more productive sites共C.
elata, C. disticha, P. arundinacea兲 had the greater
biomass, as found in many other short-term experi-ments共Fichtner and Schulze 1992; Elberse and Ber-endse 1993; Ryser 1996; Ryser and Urbas 2000兲. In more longterm experiments these rankings may dis-appear or turn into the reverse共Elberse and Berendse 1993; Ryser 1996兲.
In both experiments, the taller species generally had lower N and P concentrations in their shoots than the smaller species, indicating that a more productive use of these nutrients allowed the greater biomass production共Garnier et al. 1995; Garnier and Aronson 1998兲. The P concentrations of shoots hardly differed among species in experiment 2, perhaps because growth was mainly limited by N. The N and P con-centrations of roots were unrelated to the biomass of the species, especially when these nutrients were not limiting共at high N:P supply ratio for N and low N:P supply ratio for P兲, suggesting that differences in these concentrations reflected different degrees of nu-trient accumulation and not of nunu-trient productivity 共chapin 1980; Chapin et al. 1990兲.
The responses of the seven species to nutrient treatments were qualitatively similar. This may be due to the fact that all were graminoids. In particular, the genus Carex is physiologically quite homogeneous 共Choo and Albert 1999a,b; Visser et al. 2000兲. The responses might have differed more among species if other growth forms, e.g. forbs or shrubs, had also been studied共Lechowicz and Shaver 1982; Eckstein and Karlsson 1997; Falkengren-Grerup 1988; Aerts et al. 1999兲.
Despite qualitatively similar responses to treat-ments, the species differed in plasticity. However, they could not be ranked from the most to the least plastic, as this depended on the trait and on the ex-perimental factor for which plasticity was quantified. This may be because the evolutionary implications of phenotypic plasticity depend on whether the adjust-ments are ‘inevitable’共reflecting resource shortage兲 or
‘adaptive’ 共partly compensating for this shortage兲: high ‘inevitable’ plasticity may be the result of low ‘adaptive’ plasticity 共Sultan 1995; Ryser and Eek 2000兲. In experiment 2, the biomass production of M.
caerulea was most severely reduced at the high N:P
ratios共‘inevitable’兲, possibly because its RMR did not decrease共‘adaptive’兲.
Functional relationships between plant traits also depend on the range of environmental conditions for which these relationships are determined. For exam-ple, RMR and SLA are negatively correlated with growth rates across light levels but positively across nutrient levels 共Poorter and Nagel 2000兲. The low plasticity in RMR of M. caerulea in experiment 2 may have caused this species to respond strongly to light but weakly to nutrients共cf. Sultan 2001兲.
Finally, the average effects of the experimental factors on plant traits differed, and this may have in-fluenced how species ranked in plasticity. Biomass and RMR were affected to a similar degree by N:P supply ratios and overall nutrient supply, and the most plastic species were essentially the same for both fac-tors共Table 5兲. By contrast, the shoot N concentration in experiment 1 and the shoot P concentration in both experiments depended far more on the N:P supply ra-tio than on overall nutrient supply. Here the species with greatest plasticity differed for each factor共Table 7兲, but this cannot be taken as evidence that the spe-cies-specific responses to N:P supply ratios and those to overall nutrient supply were determined by differ-ent mechanisms. The same difficulty also occurs when the responses to N and to P are compared. For example, Keddy et al. 共2001兲 found no correlation between the growth responses of 21 wetland species to a low supply of N their responses to a low supply of P, possibly because N was more limiting for growth than P.
Contrary to expectation, the growth responses of
M. caerulea and P. arundinacea to N:P supply ratios
did not reflect their contrasting N:P ratios in the field.
M. caerulea, which mainly dominates at P-limited
field sites, even performed worse at high N:P supply ratios than P. arundinacea and the Carex species. There were also no inherent differences in P concen-trations between M. caerulea and P. arundinacea that would have suggested different physiological require-ments or a different ability to compete for P accord-ing to Tilman’s resource ratio model 共Tilman 1982; Mamolos et al. 1995; Tilman 1997; Tilman et al. 1999兲. However, M. caerulea had a greater biomass allocation to roots at high N:P ratios共Figure 3d兲, and
its leaf turnover increased less as P became limiting 共S. Güsewell, unpublished data兲. This might reduce nutrient losses and provide S. caerulea a competitive advantage in the long-term under P-limited conditions 共El-Kahloun et al. 2000兲.
Conclusions
This study has shown that new insights into the ef-fects of nutrient supply on plant growth and nutrient use can be gained by varying N:P supply ratios at different levels of overall nutrient supply. The results have shown that plant traits depend on the N:P sup-ply ratio to a different extent. Some traits 共tissue P concentration and N:P ratio, rates of N and P uptake兲 were almost entirely determined by the N:P supply ratio; they showed little or no dependence on overall nutrient supply and rather small interspecific varia-tion, and these effects were consistent with those of published studies. Other traits 共tissue N concentra-tion, root mass ratio, leaf dry matter content and spe-cific leaf area兲 were only weakly related to the N:P supply ratio; they depended more on overall supply or on light intensity and varied strongly among plant species; treatment effects on these traits often varied among published studies. In general, physiological traits showed a stronger dependence on N:P supply ratios than morphological traits, but this was not true in all cases. The seven species responded in a similar way to nutrient supply in this study despite their dif-ferent responses to nutrient availability in the field. This may be due to the short duration of the experi-ments, and it will therefore be necessary to investi-gate how N:P supply ratios affect plant growth in the long term to understand what determines a species’ ability to occur in N- or P-limited wetlands.
Acknowledgements
Ursula Bollens, T. Fotsch, R. Gessler, A. Hegi, A. Hoenderboom, S. Locher and J. van Rhenen helped with the experimental work. Their valuable assistance is gratefully acknowledged. W. Koerselman, E. We-ber and two referees commented helpfully on drafts of the manuscript. The research was partly funded by the Swiss Federal Office of Environment, Forest and Landscape and partly by grand ENV4-CT97-5075 from the Commission of the European Communities.
References
Aerts R. 1996. Nutrient resorption from senescing leaves of peren-nials: are there general patterns? Journal of Ecology 84: 597– 608.
Aerts R. and Chapin F.S. III 2000. The mineral nutrition of wild plants revisited: a re-evaluation of processes and patterns. Ad-vances in Ecological Research 30: 1–67.
Aerts R., Verhoeven J.T.A. and Whigham D.F. 1999. Plant-medi-ated controls on nutrient cycling in temperate fens and bogs. Ecology 80: 2170–2181.
Anuradha M. and Narayanan A. 1991. Promotion of root elonga-tion by phosphorus deficiency. Plant and Soil 136: 273–275. Bausenwein U., Millard P. and Raven J.A. 2001. Remobilized
old-leaf nitrogen predominates for spring growth in two temperate grasses. New Phytologist 152: 283–290.
Bernard J.M., Solander D. and Kvet J. 1988. Production and nutri-ent dynamics in Carex wetlands. Aquatic Botany 39: 125–147. Bobbink R., Hornung M. and Roelofs J.G.M. 1988. The effects of
air-borne nitrogen pollutants on species diversity in natural and semi-natural European vegetation – a review. Journal of Ecol-ogy 86: 717–738.
Bollens U. 2000. Effects of nutrient inputs and water regime on wetland vegetation and the performance of wetland species. Ph.D. thesis 13560, Swiss Federal Institute of Technology, Zürich, Switzerland.
Caldwell M.M. Dudley L.M. and Lilieholm B. 1992. Soil solution phosphate, root uptake kinetics and nutrient acquisition: impli-cations for a patchy soil environment. Oecologia 89: 305–309. Chapin F.S. 1980. The mineral nutrition of wild plants. Annual
Re-views of Ecology and Systematics 11: 233–260.
Chapin F.S. III, Schulze E.D. and Mooney H.A. 1990. The ecology and economics of storage in plants. Annual Reviews of Ecology and Systematics 21: 423–447.
Choo Y.- S. and Albert R. 1999a. Mineral ion, nitrogen and organic solute pattern in sedges 共Carex spp.兲 – a contribution to the physiotype concept. I. Field samples. Flora 194: 59–74. Choo Y.- S. and Albert R. 1999b. Mineral ion, nitrogen and organic
solute pattern in sedges 共Carex spp.兲 – a contribution to the physiotype concept. II. Culture experiments. Flora 194: 75–87. Clarkson D.T. 1985. Factors affecting mineral nutrient acquisition
by plants. Annual Reviews of Plant Physiology 36: 77–115. Crabtree R.C. and Bazzaz F.A. 1993. Seedling response of four
birch species to simulated nitrogen deposition: ammonium vs. nitrate. Ecological Applications 3: 315–321.
de Kroon H. and Bobbink R. 1997. Clonal plant dominance under elevated nitrogen deposition, with special reference to
Brachy-podium pinnatum in chalk grassland. Pages 359-379. In: H. De
Koon, and J. Van Groenendael共eds兲, The ecology and evolution of clonal plants. Backhuys Publishers, Leiden, The Netherlands. Diemer M., Körner C. and Prock S. 1992. Leaf life span in wild perennial herbaceous plants: A survey and attempts at a func-tional interpretation. Oecologia 89: 10–16.
Dijkstra P. 1989. Cause and effect of differences in specific leaf area. Pages 125-140. In: H. Lambers, M.L. Cambridge, H. Kon-ings and T.L. Pons共eds兲, Causes and consequences of variation in growth rate and productivity of higher plants. SPB Academic Publishing, The Hague, The Netherlands.
Duarte C.M. 1992. Nutrient concentrations of aquatic plants: pat-terns across species. Limnology and Oceanography 37: 882–889.
Eckstein R.L. and Karlsson P.S. 1997. Above-ground growth and nutrient use by plants in a subarctic environment: effects of habitat, life-form and species. Oikos 79: 311–324.
Eckstein R.L., Karlsson P.S. and Weih M. 1999. Leaf life span and nutrient resorption as determinants of plant nutrient conservation in temperate-arctic regions. New Phytologist 143: 177–189. El-Kahloun M., Boeye D., Verhagen B. and van Haesebroeck V.
2000. A comparison of the nutrient status of Molinia caerulea and neighbouring vegetation in a rich fen. Belgian Journal of Botany 133: 91–102.
Elberse W.T.H. and Berendse F. 1993. A comparative study of the growth and morphology of eight grass species from habitats with different nutrient availabilities. Functional Ecology 7: 223–229. Ellenberg H. 1996. Vegetation Mitteleuropas mit den Alpen 5. Aufl.
Eugen Ulmer, Stuttgart.
Ellenberg H., Weber H.E., Düll R., Wirth V., Werner W. and Pau-lissen D. 1991. Zeigerwerte von Pflanzen in Mitteleuropa. Scripta Geobotanica 18: 1–248.
Ericsson T. 1995. Growth and shoot:root ratio of seedlings in rela-tion to nutrient availability. Plant and Soil 168-169: 205–214. Falkengren-Grerup U. 1998. Nitrogen response of herbs and
graminoids in experiments with simulated acid soil solution. En-vironmental Pollution 102共S1兲: 93–99.
Fichtner K. and Schulze E.-D. 1992. The effect of nitrogen nutri-tion on growth and biomass partinutri-tioning of annual plants origi-nating from habitats of different nitrogen availability. Oecologia 92: 236–241.
Flückiger W. and Braun S. 1998. Nitrogen deposition in Swiss for-ests and its possible relevance for leaf nutrient status, parasite attacks and soil acidification. Environmental Pollution 102共S1兲: 69–76.
Garnier E. 1998. Interspecific variation in plasticity of grasses in response to nitrogen supply. Pages 155-181. In: G.P. Cheplick 共ed兲, Population Biology of Grasses. Cambridge University Press, Cambridge, UK.
Garnier E. and Aronson J. 1998. Nitrogen-use efficiency from leaf to stand level: clarifying the concept. Pages 515-538. In: H. Lambers, H. Poorter and M.M.I. van Vuuren共eds兲, Interent vari-ation in plant growth. Physiological mechanisms and ecological consequences. Backhuys Publishers, Leiden, The Netherlands. Garnier E. and Freijsen A.H.J. 1994. On ecological inference from
laboratory experiments conducted under optimum conditions. Pages 267-294. In: J. Roy and E. Garnier共eds兲, A whole plant perspective on carbon-nitrogen interactions. SPB Academic Publishing, The Hague, The Netherlands.
Garnier E., Gobin O. and Poorter H. 1995. Nitrogen productivity depends on photosynthetic nitrogen use efficiency and on nitro-gen allocation within the plant. Annals of Botany 76: 667–672. Gordon C., Wynn J.M. and Woodin S.J. 2001. Impacts of increased nitrogen supply on high Arctic heath: the importance of bryo-phytes and phosphorus availability. New Phytologist 149: 461– 471.
Güsewell S., Bollens U., Ryser P. and Klötzli F. 2003. Contrasting effects of nitrogen, phosphorus and water regime on first-year and second-year growth of 16 wetland plant species. Functional Ecology 11: 754–765.
Güsewell S. and Koerselman W. 2002. Variation in nitrogen and phosphorus concentrations of wetland plants. Perspectives in Ecology, Evolution and Systematics 5: 37–61.
Hirose T. and Bazzaz F.A. 1998. Trade-off between light and ni-trogen-use efficiency in canopy photosynthesis. Annals of Botany 82: 195–202.
Horst W.J., Abdou M. and Wiesler F. 1996. Differences between wheat cultivars in acquisition and utilization of phosphorus. Zeitschrift für Pflanzenernährung und Bodenkunde 159: 155– 161.
Imsande J. and Touraine B. 1994. N demand and the regulation of nitrate uptake. Plant Physiology 105: 3–7.
Ingestad T. and Agren G.I. 1991. The influence of plant nutrition on biomass allocation. Ecological Applications 1: 168–174. Jonasson S. and Chapin F.S. III. 1985. Significance of sequential
leaf development for nutrient balance of the cotton sedge
Erio-phorum vaginatum L. Oecologia 67: 511–518.
Keddy P., Fraser L.H. and Keogh T.A. 2001. Responses of 21 wet-land species to shortages of light, nitrogen and phosphorus. Bul-letin of the Geobotanical Institute ETH 67: 13–26.
Kielland K. and Chapin F.S. III. 1994. Phosphate uptake in arctic plants in relation to phosphate supply: the role of spatial and temporal variability. Oikos 70: 443–448.
Kirkham F.W. 2001. Nitrogen uptake and nutrient limitation in six hill moorland species in relation to atmospheric nitrogen depo-sition in England and Wales. Journal of Ecology 89: 1041–1053. Koerselman W. and Meuleman A.F.M. 1996. The vegetation N:P ratio: a new tool to detect the nature of nutrient limitation. Jour-nal of Applied Ecology 33: 1441–1450.
Koide R.T. and Kabir Z. 2000. Extraradical hyphae of the mycor-rhizal fungus Glomus intraradices can hydrolyse organic phos-phate. New Phytologist 148: 511–517.
Kovar J.L. and Barber S.A. 1988. Phosphorus supply characteris-tics of 33 soils as influenced by seven rates of phosphorus ad-dition. Soil Science Society of America Journal 52: 160–165. Kroehler C.J. and Linkins A.E. 1988. The root surface
phos-phatases of Eriophorum vaginatum: Effects of temperature, pH, substrate concentration and inorganic phosphorus. Plant and Soil 105: 3–10.
Lambers H. Chapin III F.S. and Pons T.L. 1988. Plant Physiologi-cal Ecology. Springer, New York, USA.
Lauber K. and Wagner G. 1996. Flora Helvetica. Paul Haupt, Bern, Switzerland.
Lechowicz M.J. and Shaver G.R. 1982. A multivariate approach to the analysis of factorial fertilization experiments in Alaskan arc-tic tundra. Ecology 63: 1029–1038.
Leith I.D., Hicks W.K., Fowler D. and Woodin S.J. 1999. Differ-ential responses of UK upland plants to nitrogen deposition. New Phytologist 141: 277–289.
Limpens J., Berendse F. and Klees H. 2003. N deposition affects N availability in interstitial water, growth of Sphagnum and inva-sion of vascular plants in bog vegetation. New Phytologist 157: 339–347.
Lipson D. and Näsholm T. 2001. The unexpected versatility of plants: organic nitrogen use and availability in terrestrial ecosys-tems. Oecologia 128: 305–316.
Mamolos A.P., Veresoglou D.S. and Barbayiannis N. 1995. Plant species abundance and tissue concentrations of limiting nutrients in low-nutrient grasslands: a test of competition theory. Journal of Ecology 83: 485–495.
Northup R.R., Daglgren R.A. and McColl J.G.1988. Polyphenols as regulators of plant-litter-soil interactions in northern Califor-nia’s pygmy forest: a positive feedback? Biogeochemistry 42: 189–220.
Olff H. 1992. Effects of light and nutrient availability on dry mat-ter and N allocation in six successional grassland species: Test-ing for resource ratio effects. Oecologia 89: 412–421. Peace W.J.H. and Grubb P.J. 1982. Interaction of light and mineral
nutrient supply in the growth of Impatiens parviflora. New Phy-tologist 90: 127–150.
Pegtel D.M., Bakker J.P., Verweij G.L. and Fresco L.F.M. 1996. N, K and P deficiency in chronosequential cut summer-dry grass-lands on gley podzol after cessation of fertilizer application. Plant and Soil 178: 121–131.
Perez-corona M.E. and Verhoeven J.T.A. 1996. Effects of soil P status on growth and P and N uptake of Carex species from fens differing in P-availability. Acta Botanica Neerlandica 45: 381– 392.
Perez-Corona M.E. and Verhoeven J.T.A. 1999. Biomass allocation and phosphorus productivity of Carex species in relation to soil phosphorus status. Israel Journal of Plant Sciences 47: 97–102. Pfadenhauer J. and Lütke-Twenhöven F. 1986. Nährstoffökologie von Molinia coerulea und Carex acutiformis auf baumfreien Niedermooren des Alpenvorlandes. Flora 178: 257–166. Poorter H. and Nagel O. 2000. The role of biomass allocation in
the growth response of plants to different levels of light, CO2, nutrients and water: a quantitative review. Australian Journal of Plant Physiology 27: 595–607.
Ratnayke M., Leonard R.T. and Menge J.A. 1978. Root exudation in relation to supply of phosphorus and its possible relevance to mycorrhizal formation. New Phytologist 81: 543–552. Reich P.B., Ellsworth D.S., Walters M.B., Vose J.M., Gresham C.,
Volin J.C. and Bowman W.D. 1999. Generality of leaf trait re-lationships: a test across six biomes. Ecology 80: 1955–1969. Reynolds H.L. and D’Antonio C. 1996. The ecological significance
of plasticity in root weight ratio in response to nitrogen: Opin-ion. Plant and Soil 185: 75–97.
Robinson D. and Rorison I.H. 1988. Plasticity in grass species in relation to nitrogen supply. Functional Ecology 2: 249–257. Roem W.J. and Berendse F. 2000. Soil acidity and nutrient supply
ratio as possible factors determining changes in plant species di-versity in grassland and heathland communities. Biological Conservation 92: 151–161.
Roem W.J., Klees H. and Berendse F. 2002. Effects of nutrient ad-dition and acidification on plant species diversity and seed ger-mination in heathland. Journal of Applied Ecology 39: 937–948. Romero J.A., Brix H. and Comin F.A. 1999. Interactive effects of N and P on growth, nutrient allocation and NH4uptake kinetics by Phragmites australis. Aquatic Botany 64: 369–380. Ryser P. 1996. The importance of tissue density for growth and life
span of leaves and roots: a comparison of five ecologically con-trasting grasses. Functional Ecology 10: 717–723.
Ryser P. and Eek L. 2000. Consequences of phenotypic plasticity vs. interspecific differences in leaf and root traits for acquisition of aboveground and belowground resources. American Journal of Botany 87: 402–411.
Ryser P. and Lambers H. 1995. Root and leaf attributes accounting for the performance of fast- and slow-growing grasses at differ-ent nutridiffer-ent supply. Plant and Soil 170: 251–265.
Ryser P. and Urbas P. 2000. Ecological significance of leaf life span among Central European grass species. Oikos 91: 41–50. Ryser P., Verduyn B. and Lambers H. 1997. Phosphorus allocation
and utilization in three grass species with contrasting response to N and P supply. New Phytologist 137: 293–302.