A Cross-Industry Analysis and Framework of Aftermarket
Products and Services
by Petros Englezos Bachelor in Economics
University of Macedonia, Thessaloniki, Greece
Submitted to the Engineering Systems Division in Partial Fulfillment of the Requirements for the Degree of
Master of Engineering in Logistics
at the
Massachusetts nstitute ot
I
echnology
June 2006
C 2006 Petros Englezos
All rights reserved
The author hereby grants to MIT permission to reproduce and to
"MCHIVES
distribute publicly paper and electronic copies of this thesis document in whole or in part.
Signature of Author ... ... 0
Engineering Systems Division
X/~~~~~~~~~~
Dt05/2006
C ertified by ... -.. - -... ... Lawrence Lapide
Research Director, MIT Center for Transportation and Logistics Thesisupervisor
A ccep ted b y ...
...
.
(/
Yossi SheffiProfessor of Civil and Environmental Engineering Professor of Engineering Systems Director, MIT Center for Transportation and Logistics
MASSACHUSETTS INSTITUTE OF TECHNOLOGY JUN 2 6 2006 LIBRARIES I_
- - --
---A Cross-Industry ---Analysis and Framework of ---Aftermarket
Products and Services
by Petros Englezos
Submitted to the Engineering Systems Division on 05/12/2006 in Partial Fulfillment of the
Requirements for the Degree of Master of Engineering in Logistics
Abstract
This thesis looks at how supply chains of Aftermarket Products and Services are structured. The study includes an overall examination of the Aftermarket Function, as well as an overview and examination of Aftermarket Supply Chains in four different industries. The study includes general data about the four industries (Computers, Telecommunications Equipment, Automotive and Aerospace), along with examination of practices that are used in these industries. Finally, the thesis compares and contrasts the practices used in the industries and identifies underlying principles that unifies these otherwise diverse practices.
Thesis Supervisor: Dr. Lawrence Lapide
Acknowledgements
First of all I would like to thank my advisor, Dr. Larry Lapide, for all his help and useful advice and guiding. His experience has been both helpful and inspiring. I would also like to thank all the Faculty Members, Research Associates and Students involved in the Supply Chain 2020 project for their meaningful criticism and advice.
I would like to specially thank Tim Andreae, Steve Aschkenase, Omar Bakkalbasi, Doug Derrick, Dieter Haesslein and Marc McCluskey that agreed to share with me their opinion and experiences through interviews and emails. Finally I would like to thank my friends and family for supporting me and believing in me throughout my research and studies during the MLOG '06 program.
Dedication
I would like to dedicate this Thesis to Dimitrios Andritsos, Simos Gerasimidis, Dimitrios Iliadelis and to S-P room 533.
Table of Contents
Abstract ... 2 Acknowledgements ... 3 Dedication ... 3 Table of Contents ... 4 List of Tables ... 6 List of Figures ... 6 1 Introduction ... 8 1.1 M otivation ... 81.2 Methodology and Data Collection ... 9
1.3 Introduction ... 10
1.4 Focus ... 13
1.5 Definitions ... 14
2 Literature Review ... 17
3 The Computer Industry ... 24
3.1 Industry Overview ... 24
3.2 Supply Chain Network Structure ... 30
3.2.1 General observations and examples ... 30
3.2.2 Dell's Afterm arket Structure ... 32
3.3 Service Parts Procurem ent ... 33
3.4 Inventory M anagem ent ... 34
3.5 Custom er Service ... 36
4 The Telecommunications Equipment Industry . ...39
4.1 Industry Overview ... 39
4.2 Supply Chain Network Structure ... 43
4.2.1 Cisco's Aftermarket Structure ... 45
4.3 Service Parts Procurem ent ... 47
4.4 Inventory M anagem ent ... 48
4.5 Custom er Service ... 51
5 The Automotive Industry ... 53
5.1 Industry Overview ... 53
5.2 Supply Chain Network Structure ... 60
5.2.1 Saturn's Aftermarket Structure ... 61
5.3 Service Parts Procurem ent ... 64
5.4 Inventory M anagem ent ... 65
5.5 Custom er Service ... 67
6 The Aerospace Industry ... 69
6.1 Industry Overview ... 69
6.3 Service Parts Procurem ent ... 75
6.4 Inventory M anagem ent ... 76
6.5 Custom er Service ... 78
7 Conclusions ... 80
7.1 Com parison of used practices ... 80
7.1.1 Creating a Comparison Framework ... 80
7.1.2 Similarities Across Industries ... 83
7.1.3 Differences Across Industries ... 85
7.2 Underlying Principles across industries ... 87
7.3 M acro-factors ... 88
7.4 Recommendations for further research ... 91
Bibliography ... 93
Websites and Interviews ...
98
A Appendix A: Server Companies' Market Shares Categorized by Server Size.99 B Appendix B: Dell's Aftermarket Services ... 101
C Appendix C: Cisco's Acquisitions 1993-2006 ... 104
List of Tables
Table 1: Revenue Impact of Service and Parts Business by Global Industry. Source:
Deloitte Research ... 11
Table 2: Major Companies competing in different market segments in the Telecom industry. Source: Standard and Poor's, Company Reports, 2006 ... 40
Table 3: Service Parts Planning Examples. Source: AMR Research ... 50
Table 4: Leading Companies in Global Light Vehicle Sales. Source: Global Insight, Standard and Poor's ... 54
Table 5: Regional Light Vehicle Sales. Source: Standard and Poor's, International Organization of Motor Vehicle Manufacturers ... 55
Table 6: Average US dealership profile. Source: NADA Data, NADA analysis division, 2005 ... 57
Table 7- Composition of aerospace industry 1989 and 1999- Increase in Civil Aerospace relative to Defense, and decrease in employee base. (All dollar figures are given in millions of current dollars) Source: Tiwari, 2005 ... 70
Table 8: Key Figures for Passenger Airline Companies ... 72
Table 9: Aerospace and Defense Industry Segment Operating Profit Margins. Source: Standard and Poor's, Company Reports, 2005 ... 73
Table 10: Aftermarket Comparison Framework ... 82
Table 11: Market Shares for Volume Servers ... 99
Table 12 Market Shares for Midrange Servers ... 100
Table 13: Market Shares for High End Servers ... 100
Table 14: US Light Vehicle Market Shares. Source: Standard and Poor's, Ward's Automotive Reports ... 106
List of Figures
Figure 1: Catching up to the Service Revolution in Global Manufacturing ... 12Figure 2: Companies with Senior VPs or higher overseeing Service. Source: Aberdeen Group, 2005 ... 21
Figure 3: Obstacles to Service Operations Profitability ... 21
Figure 4: Global PC Market Shares Source: IDC and Standard and Poor's ... 26
Figure 5: PC growth rates since 1997 Source: IDC & Standard and Poor's ... 27
Figure 6: Company Growth Rates in the PC Sector. Source: IDC & Standard and Poor's ... 27
Figure 7: Server Companies Market Shares. Source: Standard & Poor's and IDC ... 28
Figure 8: Average PC Price over the years. Source: Standard & Poor's and IDC ... 29
Figure 9: Alternate Distribution Network Designs in the Computer Aftermarket. Source: Cohen & Agrawal, 1999 ... 30
Figure 10: The logistics flow of service parts inventory. The 2-tier supply chain network of Olivetti in Europe. Source: Ashayeri et al ... 35
Figure 12: U.S. Enterprise spending on telecommunications equipment. Source:
Standard and Poor's, TIA Online ... 41
Figure 13: Global networking market. Source: Standard and Poor's, Dell'Oro Group, 2006 ... 42
Figure 14: Cisco's Multi Echelon Service Supply Chain Material Flows. Source: MCA Solutions ... 46
Figure 15: Gross Profit as percentage of selling price for new cars sold, US ... 58
Figure 16: US Dealer's Aftermarket Income, 2005. Source: NADA DATA 2005, NADA analysis divisions ... 58
Figure 17: Median Age of US Cars. Source: Standard and Poor's, Polk Automotive Intelligence ... 59
Figure 18: Off-the-self spare parts availability. Source: Parts Monitor, Cohen et al, 2000
...
62
Figure 19: Saturn's Customer Loyalty. Source: Parts Monitor, Cohen et al, 2000 ... 63
Figure 20: Application Landscape for Repair Services. Source: AMR, 2001 ... 77
Figure 21: Dell's Return to Depot Operation ... 101
Figure 22: Dell's Next Business Day Operation ... 102
I
Introduction
1.1 Motivation
My motivation to research this particular topic derives from the belief that this topic is challenging from a personal perspective and that the importance of Service Parts Management
and Aftermarket Logistics is continuously increasing in the last years. In many occasions, the
profit that companies have from service parts equals or even surpasses the profit of all the other divisions of a company. Despite the increasing importance of Aftermarket logistics, the research in this particular area has not been fully developed yet. Furthermore, the research so far focuses in specific companies or industries without comparing and contrasting the practices of these companies or industries.
Understanding the principles that affect the aftermarket across different industries and shape the future of this important part of supply management is a very interesting and challenging target. Combining practices that are considered as "best" in different industries under a unified framework can lead to understanding the principles that shape these practices and to creating strategies for improvement for different companies across a variety of industries.
This project is a part of the Supply Chain 2020 Project which is a multi-year research project of the Center for Transportation and Logistics of the Massachusetts Institute of Technology. The goal of the project is to study pioneer critical success factors and concerns for future supply chains to the year 2020, and identify strategies that companies could use in order to prepare for the year 2020.The duration of the project is three years, and we are currently working
in the 2nd Phase, which includes finishing the Principles Research, developing Supply Chain
Models and Macro Factors Scenarios.
The main issue of this thesis project, derived from the main research question, is the study of the supply chain in the aftermarket. The sub-questions that this project is intended to answer
are the following:
o What roles do supply chain organizations play in the Aftermarket? o What supply chain practices are used?
o What are the current practice trends?
o What are 'best' practices? And what are the underlying principles being leveraged? o What macro factors have shaped the practices in the last 10-15 years? How and why?
1.2
Methodology and Data Collection
The methodology for this thesis is mainly based on studying the function of Aftermarket and Service Parts Logistics and identifying what is considered to be a "best practice" or a "best-in-class" company in the four different industries (Computers, Telecommunications, Automotive, and Aerospace). Since what is thought by each industry or person as "best-practice"
can be very subjective, the main goal will be to identify the underlying principles that are
common between the companies that are considered to be in-class" or to have "best-practices". Because the research question to be answered is not strictly analytical but includes major conceptual elements, literature review and interviews are the main parts of the methodology and my approach to the questions.
Along with reviewing academic literature and business publications concerning the Aftermarket function, industry professionals that have experience across all the industries in
question provide their expert opinion. Finally, the research includes all the previous findings of the people involved in Phase I of the Supply Chain 2020 project from the previous and the current academic year (through review of previous theses, publications, and meetings).
1.3
Introduction
"The service parts business can be very profitable. Yetfew companies even come close to tapping its full potential. For many, the aftermarket business is just an afterthought."
(Aschkenase et. al, 2003)
Realizing the potential of the Aftermarket function of a company is still an issue for many companies. However, others have evolved their business in such a way where the Aftermarket is the key differentiator of the whole company. The aftermarket practices of companies such as Dell, Cisco and Saturn, which are typical examples of this evolution, are analyzed in the following chapters.
In order to realize the potential of the Aftermarket function it is necessary to understand how big this function in terms of sales, profits and revenues is. In 1997, $148 Billion were
invested in service parts, only in the Fortune 500 companies (Patton, 1997). In 2003, it was
estimated that the total spending for service parts was evaluated to exceed $700 Billion, an amount close to 8% of the U.S. Gross Domestic Product. (Poole, 2003)
Although the Service Parts or Aftermarket division of a company can be the most profitable division of the company, many times its importance is underestimated. Deloitte benchmarked the Aftermarket divisions of many of the leading global manufacturing companies, whose combined revenues exceeded $1.5 Trillion. The results showed that the benchmarked
companies on average generated 25% of their revenues from the Aftermarket. In terms of profitability, the same companies generated 46% of their profits from their aftermarket divisions, a percentage 75% higher than the total profitability of the companies. Despite these numbers, two out of three benchmarked companies grow their Aftermarket division in a slower or same rate as their total business. (Koudal, 2006)
Aerospace and defense
Automotive and commercial vehicles
Diversiftied
manufacturing and industrial products High technology and telecommnunications eq uipment Life sciences/medical devices All companies 47% More than 50 % 37% More than 50% 20% Morethan 50% 19% 21% 26% More than 50% More than More than 50% 50%
Table 1: Revenue Impact of Service and Parts Business by Global Industry. Source: Deloitte
Research
Similar results are shown in a previous study. AMR research showed that although the Aftermarket divisions of many companies generate up to 25% in terms of revenue and 40-50% of the total annual profits, however the percentage of IT invested in the same division is significantly lower. (Poole, 2003)
Even among the biggest manufacturing companies, one can observe many differences in the way the aftermarket function is structured and operates and in the results it produces. Deloitte Research shows that only 19% of the companies researched had revenues from the aftermarket that exceeded the company's total revenues from other departments. (Koudal, 2006)
M anufacturing Share .. Service Share 100 C W -i a)r-it'l el s0 60 40 0% 2 % 4 0 %' 60 %6 o 8 0% Share of companies (percent) 100 %
Figure 1: Catching up to the Service Revolution in Global Manufacturing. Source: Deloitte Research
These substantial differences imply that some companies operate their aftermarket departments with more efficiency than others. These differences are even bigger across industries, where the same practice might be successful in one industry and unsuccessful in
another. There are many factors that influence this diverse behavior, and will be examined in the
After we define the main characteristics of the Aftermarket and present the methodology and the focus of the research in this first introductory chapter, we continue by reviewing the literature that has been published regarding the Aftermarket and Service Parts Management. This literature review is the basis of the research.
The next four chapters are devoted to each of the industries that this research focuses on,
which are the Computers, the Telecommunication Network Equipment, the Automotive and the
Aerospace industry respectively. In each industry four areas of the Aftermarket are researched, and "best practices" are identified through specific examples. The final chapter of this thesis is dedicated to comparing and contrasting the observations of the previous chapters, as well as identifying underlying principles among the industries and the best-in-class companies. A framework explaining the behavior of companies is presented.
1.4
Focus
Since this research concerns Aftermarket Products and Services, only industries which manufacture durable products are considered, because only products with a significant lifecycle
is reasonable to have a post-sales market.
Four industries with durable products are involved in this research. These four industries were chosen because we believe that they are representative of the different aftermarket supply chains, and also because they are industries with durable products that are part of the focus of the overall Supply Chain 2020 Project. These four industries are the Computer Industry, the Telecommunications Equipment Industry, the Automotive Industry and the Aerospace Industry.
However, due to the limited time available for research and facing the danger of widening the research too much, the focus of the research was specified further more within each industry. Thus, in the Computer Industry our focus was Personal Computers, Laptops and Servers. In the Telecommunications Industry we focused on telecommunications network equipment. In the automotive industry the research focuses only in cars and not in other vehicles like buses or heavy machinery vehicles. Finally, the research in the aerospace industry includes only the Aftermarket Products and Services of Commercial Passenger Airlines and Manufacturers, excluding the Defense Industry.
1.5 Definitions
Before starting the cross-industry analysis of Aftermarket Products and Services it is necessary to define some of the main aspects of this analysis. The necessity for these definitions becomes more important because there are different unofficial definitions of terms that exist in the internet and specifically in non-academic and non-professional organizations that confuse any reader. The major confusion in the terminology is observed between the terms of reverse and aftermarket logistics, which in some cases are used as synonymous, when in fact these two terms although related, have many differences.
By reading the definitions stated below by different official logistics organizations and academic publications we understand that reverse logistics and aftermarket logistics are two terms used for different functions of supply chains. Although reverse logistics are part of aftermarket logistics and vice versa, the two functions are not completely identical. On the other hand, terms as aftermarket logistics, service parts logistics and spare parts logistics can be used as synonymous terms.
The definitions of terms are:
Aftermarket Logistics: Everything the company provides after the sale - spare parts
replacement, professional services, help desks, warehousing, product recalls, and field technicians, among others that needs to be managed as an integrated whole. (Reverse Logistics Association, http://www.reverselogisticstrends.com/car-tnt-logistics-busdev.php
After-Sale Service: Services provided to the customer after products have been delivered. This
can include repairs, maintenance and/or telephone support. (Vitasek, 2005)
Reverse Logistics- Definition 1: A supply chain that is dedicated to the reverse flow of
products and materials for returns, repair, remanufacture, and/or recycling. (http://www.apics.org/ 10th edition.)
Reverse Logistics - Definition 2: A specialized segment of logistics focusing on the movement
and management after the sale and after delivery to the customer. Includes product returns for repair and/or credit. (Vitasek, 2005)
Durable goods or products - Definition 1: In economics, a durable good or a hard good is a
good which does not quickly wear out, or more specifically, it yields services or utility over time rather than being completely used up when used once. Most goods are therefore durable goods to a certain degree. Perfectly durable goods never wear out. (www.wikipedia.org)
Durable goods or products - Definition 2: A good that can continue to be used over an
extended period of time (Deardorff's Glossary of International Economics, 2001)
Spares (Spare Parts): Components or parts, either consumable or repairable, from the
associated bill of material used to maintain or repair machinery or equipment (The Chartered Institute of Logistics and Transport -UK)
Service Parts Revenue: The sum of the value of sales made to external customers and the
transfer price valuation of sales within the company of repair or replacement parts and supplies, net of all discounts, coupons, allowances, rebates, and/or telephone support (Vitasek, 2005).
After reviewing the above-mentioned as well as other definition we decided to provide a
definition of Aftermarket Logistics that will be used for the purposes of this research work. The
definition is the following:
"Aftermarket Logistics includes all the services provided by a company after the actual sale of a durable product. This includes the management of services parts as well as other services provided by the seller: Warranty Management, Sale of Accessories and Upgrades, Repairs and Product Recalls, Help Desks, Online and Telephone Assistance, and Field Technicians. All these operations are managed as an integrated business unit".
2
Literature Review
Before starting the analysis of the aftermarket products and services across the four previously mentioned industries, a review of articles and studies published on the subject was necessary. Thus, a review of academic and non-academic publications was conducted. In the academic area, different books and articles covering different areas of the aftermarket were reviewed. In the non-academic publications, the review covered mainly articles in business magazines and white papers and studies from consulting firms.
In order to introduce the researcher to the area of service parts management, the work of Joseph Patton can prove very helpful. The books "Service Parts Management" (Patton, 1984) and "Service Parts Handbook" (Patton and Feldman, 1997) provide the reader with a thorough analysis of the service parts function, covering all aspects of service parts management from introductory definitions to areas such as service parts inventory management, forecasting, procurement, marketing and pricing methods. However, this work can only serve as an introduction to the field because technological advancements and new business methods and realities have made this work somewhat outdated.
The academic publications on the subject mainly focus in the area of inventory
management for spare parts, compared to inventory management for regular products.
Caglar, Li and Simchi-Levi (2004) examine a two-echelon service parts inventory system of electronic machines with expensive parts that fail according to a Poisson process. By developing a continuous review, base stock policy almost optimal heuristic for this system the
authors achieve to minimize inventory costs, with the constraint of a specific response time for each depot. This approach depicts the problems faced by a computer mainframe manufacturer.
Furthermore, other approaches have been proposed for managing spare parts inventory in the high-tech industry (Ashayeri, Heuts, Jansen, 1996). Based on a case study of the Olivetti computer company, with repair facilities in two European Union countries, they use a simulation approach to address the problem of service parts inventory management. Their approach distinguishes items in repairable and non- repairable, focuses on a single echelon system and uses a continuous review policy. Their results lead to cost reduction, better service level and a well defined process for decision making.
Candas and Kutanoglou (2006) combine the problem of network design and inventory stocking. Since service has to be delivered in specific short time limits, the location of inventory and the stocking level of each parts in the different locations is critical. The authors propose a model that optimizes this combined problem.
Hammant et. al. (1999) focus in the development of supply chain networks in the automotive aftermarket sector, where they model and simulate the behavior of these networks with the use of a decision support system.
Several benchmarking studies for service parts logistics exist in academic publications. Morris Cohen and Vipul Agrawal, professors at the University of Pennsylvania have published several studies over the last 15 years. Although their focus was the computer industry, several companies from different industries were researched each time. The areas that were benchmarked were the parts distribution networks of companies as well as the control systems that each company used in these networks (IT systems, inventory management policies, communication systems, transportation modes). Specific performance metrics were introduced in
order to benchmark the performance of companies (Cohen, Zheng, Agrawal, 1996). As these benchmark studies evolve we observe changes such as improvement of overall service levels, minimization of response time to service, change of performance metrics to a more customer oriented focus. We also realize that better management of the aftermarket sector can lead to both improved customer service and lower inventory levels (Cohen, Agrawal, 1999). On the other hand, non-academic studies show that in many cases Key Performance Indicators (KPI's) are internally oriented rather than customer facing (Barkawi, 2002).
Besides academic literature on the aftermarket function, several non-academic professional studies and articles have been published, mainly by consulting firms and company divisions that operate in the aftermarket area. These publications tend to look at the aftermarket function from a more strategic and business-oriented point of view than the academic literature, where more specific problems are addressed many times with the use of extensive analysis.
Customer satisfaction is another factor that companies consider as one of the most important aspects when they apply solutions to improve their Service Parts Logistics. According to a study by AMR Research (2005), 95% of the manufacturing companies that are considered "best-in-class" estimate that improved customer satisfaction is one the three main factors that drive them to improve their Aftermarket Service Operations. Satisfactory service levels is one of the main factors that affect customers buy a durable product from the same company again, thus making the aftermarket function a potential differentiation factor for every company that produces durable products.
Companies try to overcome these obstacles and implement solutions in order to achieve greater profit margin from their service divisions and maximize the satisfaction of their customers. These solutions are mainly directed in the areas of implementing software solutions
and redesigning their supply chains. A number of different software solutions that exist are used by companies to improve their service levels. Despite this fact, about 50-60% of the companies use spreadsheets and Enterprise Resource Planning (ERP) solutions only. The AMR Research study analyzes the different services offered by a variety of Service Parts Planning (SPP) software providers. These providers showed a $105 million of revenue in 2004, with a 20% estimated growth for the following year (Ruggles, Suleski, & Samaraweera, June 2005). However, according to AMR Research (October 2005) the need for differentiation is forcing companies to invest in Service Parts Planning (SPP) applications. Some other reasons for this investment are the growth of slow-moving parts in the aftermarket because of increased product proliferation, and the pooling strategies that some companies use for their service parts management, along with increased customer needs.
Turning the service parts division of a company to a profit-generating machine has a lot of difficulties, which are mainly related with the lack of communication and underestimation of the potential of this operation. According to a study by Aberdeen Group, for 72% of all companies, difficulty in communication between the various departments (sales, marketing, service, and manufacturing) is the main reason of failure. The importance of people in the success of the aftermarket division and the necessity of investment in human capital in also stressed (Vigoroso, 2005).
U
%s-Best in Class Industry Average Laggards '1 09 30% I 20%
I
I I I t I 10% 20% 30% 40%% of responding companies with SVP or higher overseeing service
Figure 2: Companies with Senior VPs or higher overseeing Service.
Source: Aberdeen Group, 2005
Disjointed processes across nfg, sales, nrtg
svc
Insufficient technology infrastructur(
Insufficient performance metric!
Insufficient awareness of atterrmarket servic
irrpact
Internal employee resistance to chang
External partner resistance to chang(
Lack of data visibility for al partnen
Concern over sharing sensitive data w itl
custonersl partners
Aftermarket service is not econonically feasible
Figure 3: Obstacles to Servic
Aschkenase et al. (2005) also stress out some
improvement of the aftermarket division of a co management, investment in human capital and use
m1
_
-172°
*UUI3%~~! 43%
*EE
_32,,
l
e Ie I I_
s ~ 1 -J9%0% 10% 20% 30% 40% 50% 60% 70% 80%
%of all respondents
_% I_% .
, 1 5 1 1 1i =1
6-0% 16-0% 26-0% 36-0% 46-0%f 50°% 60° 76-0%z 86-0%
%of all respondents
Source: AberdeenGroup, September 2005
e Operations Profitability
of the previously mentioned strategies for mpany, such as sophisticated inventory of specialized I.T. systems. Further, the
i
- -
-37% I
necessity of accurate transaction and product data to reduce mistakes in calculations is pointed
out (proposing 95% and 98% accuracy levels respectively).
Bundschuh and Dezvane (2003) mention the fact that companies lose serious proportions of their profitability because of inaccurate pricing and poor design of service plans. An example of this problem is a building-equipment manufacturer, whose 11% of service contracts did not cover their marginal costs. Segmentation of customers according to the level of service they require and different pricing policies for different segments is the solution proposed.
Because service management is a difficult and complex problem, Cohen (2005) divides the decision making process into three periods: The budget planning period, the strategy planning period and the tactics planning period. In each of these distinct periods the decision maker faces different managerial tradeoffs and focuses on different objectives. The tradeoffs mentioned are between revenues, costs and service. A efficient frontier curve is introduced to show the relationship between levels of promised performance and investment in service.
MCA Solutions, a consulting firm specializing in service parts management and the aftermarket sector, in a white paper titled the "Top Ten Things Your CEO Should Know About Service" (MCA Solutions, 2005), connects service and spare parts management to product design and product innovation. Innovative companies involve their service personnel in the development of new products, in order to achieve top quality and efficient failure forecasting. Also, close collaboration exists between service engineers and product developers, using statistical failure data to improve product quality.
A final aspect of aftermarket logistics mentioned in the literature is warranty management. According to an Accenture white Paper "Few companies today pay enough
mostly an afterthought and warranty management only an afterthought of an afterthought"
(Sprague, 2005). Even though warranty claims account for $24 Billion annually, most companies do not pay attention to their warranty management processes. Some potential benefits for companies might be improved profitability and revenues through increased warranty sales, improvement in quality, increased customer satisfaction and loyalty and a decrease in warranty claims expenses by 25%.
3
The Computer Industry
3.1 Industry Overview
The Computer industry was revolutionized as an industry in the late 1970's - early 1980's with the introduction of the first personal computers into the world market. Until then, the computer market was dominated by IBM, which produced huge computers which were used only in big companies and other organizations in the government and educational sectors as computer mainframes. The introduction of the personal computer revolutionized the market, creating tremendous opportunities for companies that would operate in the field (Graham-Hackett, 2005). From that era of the first personal computers to today the computer hardware industry has transformed to a $228 billion market (2003), with many competitors and different smaller markets (Roy, 2005).
Standard and Poor's divides the computer hardware industry into three categories with different characteristics: The personal computers segment, which includes laptop and desktop computers, the server segment, which resemble PCs and are used in corporations and big
organizations for large computations, and the workstation segment which "essentially, are
high-end PCs with advanced graphics capabilities that are designed to handle data-intensive scientific and engineering applications". Personal Computers dominate the hardware industry, comprising
about 91% of the market's global revenues'. The server sector is divided into different
subcategories, with different competitors in each category (See Appendix A).
For the purpose of this research we are going to use the above-mentioned description of the market in order to define the computer industry. Specifically, we are researching supply chain practices in the aftermarket sector of Personal Computers, Servers and Workstations. The main players in this industry are the Original Equipment Manufacturers (OEMs) of these systems, as well as companies that distribute and sell these products or provide service parts or
aftermarket services. In order to examine the procurement of service parts, we are going to also
include components and spare parts manufacturers.
The most important players in this market are the OEMs, which are companies that manufacture and assemble computers, servers and workstations. These companies usually outsource many of the components of the computers and use the same processors and other parts (for example Intel provides 90% of the microprocessors used in personal computers) for their systems. Sometimes the OEMs only assemble the computer using totally outsourced components. For example, companies like IBM, Gateway, Apple Computers, Sony Corp., Fujitsu
Ltd. have used manufacturing companies to produce full lines of their products, and have
introduced the concept of Electronic Manufacturing Services (EMS) companies
(Graham-Hackett, 2005).
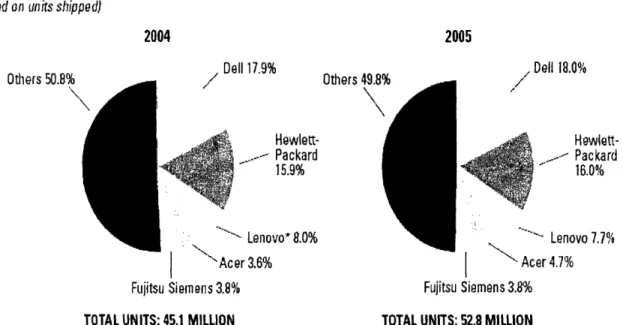
The major competitors in the PC sector are Dell, Hewlett-Packard and IBM-Lenovo, a company recently created by the acquisition of IBM PC division by the Chinese owned Lenovo
in May 2005.These companies are often mentioned as tier-1 vendors. Other companies with
smaller market shares follow, which are classified as tier-2 vendors (see Figure 4). A large
segment of the market is occupied by systems that are either assembled by the customers of small assemblers and retailers, and this section is called "white box" market. "White box" computers tend to have lower prices, but also fewer customizations and lower level of
2 aftermarket support by the seller2.
WORLDWIDE PC SHIPMENTS MARKET SHARE- THIRD QUARTER
(Based on units shipped)
2004
.I.-..l.rn ni UL1eI S 3J.B0
%..
2005
/ Dell 17.9% n -t.--- Aft n.l / Dell 18.0%
Hewlett-· "'i Packard 15.9% Lenovo 8.0% '-s Lenovo" 8.0%~l · ,-,.
Hewlett-.-
Packard 16.0% -- Lenovo 7.7% I Acer 3.6% Fujitsu Siemnens 3.8%TOTAL UNITS: 45.1 MILLION
"Lenovo share for 204 is based on combined IBM and Lenovo data, Source: IDC,
"'- Acer 4.7% Fujitsu Siemens 3.8%
TOTAL UNITS: 52.8 MILLION
Figure 4: Global PC Market Shares Source: IDC and Standard and Poor's
In terms of growth, the PC market is showing more than 10% growth from 2003 until 2005, after the impacts of the crisis caused by economic recession and the "Internet bubble" in
the year 2001 (see Figure 5). The top three vendors are showing very good growth, but Acer is
growing faster than anyone else (see Figure 6).
2 Standard and Poor's Industry Surveys: Computers Hardware. www.standardandpoors.com UL11WS 4M.
WORLDWIDE PC SHIPMENT GROWTH
(In percent, based on units shipped)
25 20 15 10 5 0 (5) (10) 24 16 1 6 1 5 15 1515 . . . .0 0 0 E5 (4) 1gg7 1998 1999 2000 2001 2002 2003 2004 E2005 F200e E-Estimated. F-Forecast.
Sources: IDC; Standard & Poor's estimates.
Figure 5: PC growth rates since 1997 Source: IDC & Standard and Poor's
This growth is mainly driven by the demand for portable computers (growth 39% in Europe) and systems for small and medium businesses. Also the growth rates in the market of
Asia are driving the global growth of the market. Sales in Asia are expected to surpass US sales
3 in the following years.
GROWTH RATES OF VENDOR PC SHIPMENTS-THIRD QUARTER 2005
IPercentchange from previous year)
Acer Hewlett-Packard Dell Fujitsu Siemens Lenovo 54 ~~18 ~~~ ~18 ~~15 ~~13 I--I-- [ I I I I I I 0 10 20 30 40 50 60 Source: IDC.
Figure 6: Company Growth Rates in the PC Sector. Source: IDC & Standard and Poor's
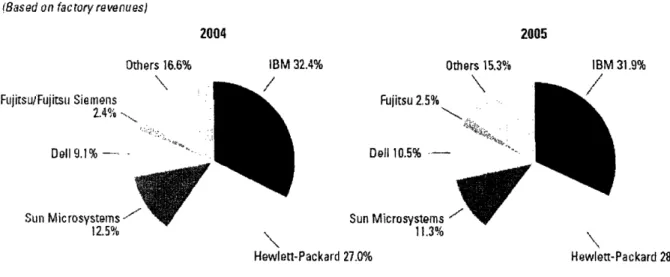
In the server sector, IBM dominates the market. The market is steadily growing in the last
years, although it has faced serious drawbacks in 2000 and 2001.In the second quarter of 2005,
the server sector grew 5.6% to $12.2 Billion. The second biggest competitor in the field is
Hewlett Packard, with Sun Microsystems and Dell following. The server sector is not dominated by the existence of "white box" unbranded systems as the PCs. In terms of server sizes and sales, the volume server sector is gaining against the midrange and high-end sectors.
SERVER VENDOR MARKET SHARES- SECOND QUARTER
'Based on factory revenues)
2004 2005
Others 16.6% IBM 32.4% Others 15.3% IBM 31.9%
Fujitsu/Fujitsu Siemens I ' 2.4%... Dell 9.1% - .. . Fujitsu 2.5% ~Do~l 10.5% ..-I ~~Dell 10.596-Sun Microsystems -/
, o r-e, Sun Microsystems
Hewlett-Packard 27.0% Hewlett-Packard 28.5%
TOTAL REVENUES: $1 1.5 BILLION TOTAL REVENUES: $12.1 BILLION
Source: DC.
Figure 7: Server Companies Market Shares. Source: Standard & Poor's and IDC
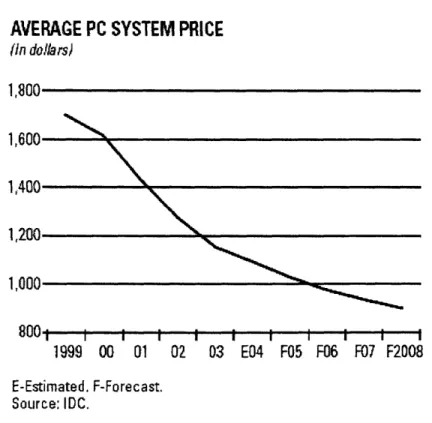
Some of the major factors that affect the whole computer industry and specifically the aftermarket are technological advancements, extensive pricing competition, market consolidation and extensive outsourcing. First of all, the technological advancement of this industry is probably the most impressive in the whole global economy. Computing capabilities are rising, cost is deteriorating rapidly, and computers become much more powerful and smaller in size. This phenomenon has reduced the product lifecycle especially for PCs even to a period of a few months. This rapid development of new technologies and high supply for PCs has made sellers reduce prices significantly (see Figure 8). Also, another market trend is consolidation of
companies in order to withstand the competitive pressures. Thus, in 1992 the top ten companies globally had about half of the market in market share, a percentage which has been reallocated to
the top five players in 2002. Some forecasts predict that in the near future the top five sellers will
control 70% of the global market. As it is mentioned in a Standard & Poor's Survey, "only the
fittest PC producers have survived"4.
AVERAGE PC SYSTEM PRICE
fin dollars) 1,800 800 1 I I I I I I i i 1999 00 01 02 03 E04 F05 F06 F07 F2008 E-Estimated. F-Forecast. Source: IDC.
Figure 8: Average PC Price over the years. Source: Standard & Poor's and IDC
In the following pages the aftermarket sector of the computer industry is analyzed, and specifically four different functions of the aftermarket. Through examples and case studies best practices in procurement of service parts, structure of aftermarket supply chains, spare parts inventory and aftermarket customer service are analyzed. Previous work in the SC2020 project and personal interviews with industry experts are the main source of information.
3.2 Supply Chain Network Structure
3.2.1 General observations and examplesDifferent factors affect the structure of the aftermarket supply chain network in the computer industry. One of the main factors is the size of the company. Thus, bigger companies tend to have a 3-tier network, while smaller companies with fewer products or specific customers have a network with only one distribution center (Cohen and Agrawal, 1999).
Distribution Network- Distribution Network-2
DCIEm. Depot Field Locations
Distribution Network-3 Futtue CDC-Less Suppliers Field Locations - - - Emergency support Replenishment source
Figure 9: Alternate Distribution Network Designs in the Computer Aftermarket. Source: Cohen &
Agrawal, 1999
DC Field Locations
Field Locations
Other important factors in a company's decision when designing its network for service are the density of customers and the criticality of the product served. Most PC manufacturers maintain a central DC and many inventory field locations. For example, Hewlett Packard has over 400 field locations in the U.S. while Sony Vaio, has only one central distribution center in the same region from where it dispatches parts to distributors and outsources repair to third party providers outside the distribution center. In the semiconductor industry where the customers are the OEMs and therefore they are located in few specific locations globally, the location of inventory is more centralized (Industry Expert, Interview, 2006) Toshiba is using an infrastructure of few repair malls, where all the components' manufacturers are located, in order to provide better service to its customers (Industry Expert, Interview, 2006). In 2004 IBM decided to change its aftermarket division's structure. Instead of segmenting by regional area, they segmented their divisions by business process. The result was one service provider in Europe for handling the logistics of all spare parts, instead of different service providers in each European country that the company operated in (Roy, 2005).
In the server and workstations sectors, inventory is located closer to the customer and therefore, more locations with inventory are created. This happens because on-site repair is usually necessary, and because of the increased criticality of the servers compared to personal computers (Industry Expert, Interview, 2006). In general, we can conclude that parts for personal computers tend to be more centralized, while servers and workstations tend to be more locally
located (Cohen, Agrawal, 1999)
An emerging trend in the whole computer industry over the last decade is the increasing use of Third Party providers (3PLs) for different tasks of the aftermarket function (Cohen, Agrawal, 1999). Besides parts manufacturing, specialized 3PL companies are used in all
aftermarket tasks, creating a mixed system of 3PL and OEM owned facilities and services (Interviews with Industry Experts, 2006)
3.2.2 Dell's Aftermarket Structure
In all the duration of the research for this thesis, Dell was mentioned several times by different sources (academic publications, business magazines, interviews) as an example of company with a supreme supply chain network. This is the reason that a subchapter is devoted to the analysis of Dell's Aftermarket structure, as a case study.
Dell has stationed its main aftermarket operations depot for the U.S. in Memphis, TN. Dell is offering a variety of three types of aftermarket services to its customers (Roy, 2005).
These are5:
a. Return to depot Operations <10% of the cases: Any customer can return any part back
to the company within the warranty period. The servicing is done in the central depot in Memphis. The supplier or a partner 3PL repairs the component. But Dell oversees the operation to guarantee on-time delivery and repair.
b. Next Business Day onsite repair =90% of the cases: Customers of this category receive service by the next business day. The company achieves a 99% fill rate in this service. To
do so, Dell is forcing its suppliers to maintain service parts in the Supplier Logistics
Center (SLC) which is located close to its shipping center. The supplier also operates the repair center. Dell's fulfillment center has 5 days of inventory whereas the Supplier Logistics Center holds 30 days of inventory.
c. Four hour rapid repair (remaining): This operation serves the company's business customers. All eligible customers are served within a four hour timeframe. One hundred locations operate all over the U.S. with inventory to help this operation. Dell is using several factor (sales records, contracts, failure rates, criticality) to stock parts in these
locations (Roy, 2005)
3.3
Service Parts Procurement
Procurement of service parts in the computers' industry has some distinct characteristics,
which are related to the characteristic of the product. The spare parts for the computers, as all
components of the product, are usually outsourced to third party manufacturers. Since there are
only a few manufacturers (OEMs) and many third party companies that serve multiple OEMs many times parts are interchangeable (Industry Expert, Interview, 2005).
The short lifecycle of the products of this industry had both positive and negative impact on the complexity of service parts procurement. Poole (2003) categorizes computers as short
lived assets, with up to two years of life. According to Dennis and Kambil (2003), "Computer
manufacturers introduce a new generation of products every four months. The resulting problems, supporting multiple generations, tracking part types, and ensuring parts and service availability to different regions are considerable". Obsolescence of unnecessary parts is the
largest cost component, especially for personal computers (Cohen and Agrawal, 1999). To minimize these costs, companies like Dell force their supplier to carry spare parts inventory for them.
3.4 Inventory Management
The management of levels of inventory in each service location is one of the most important aspects for every company that wishes to maintain successful aftermarket operations. In all the industries in this research, inventory management is affected by three important factors:
The size of the network, the range of the price of components and the product lifecycle. The
major tradeoff for the OEMs is between customer expectations and cost (Industry Expert, Interview, 2006).
Inventory is handled differently in the personal computers and the servers and
workstations sectors. In the Server and workstation sectors, there is a tendency for the OEMs to
have agreements with their suppliers (Industry Expert, Interview ,2006) and with their
customer's (Industry Expert, Interview, 2006), called Service Level Agreements (SLAs). With
these agreements the supplier or the OEM agrees to provide a certain service level and to have a
certain percentage of parts availability, otherwise it pays some form of penalty to its customers. For example, Intel has certain SLAs with its semiconductors suppliers where if the supplier does not have the parts available, it pays to Intel penalties up to $50,000 per minute (Industry Expert, Interview, 2006).
The distinction between slow moving and fast moving service parts exists in the computer industry. However, because the price for slow moving parts is not that high and
because the lifecycle of computers is relatively short, the distinction is not as important as in
Figure 10: The logistics flow of service parts inventory. The 2-tier supply chain network of Olivetti
in Europe. Source: Ashayeri et al.
Levels of inventory forecasting software. There
to companies as a package
offer software solutions to computers industry (OEM, different sizes of operations
for spare parts are usually calculated with the use of complicated are many different software solutions in the market, usually offered covering all needs of aftermarket operations. Companies like SAP their customers especially customized for different players of the EMS, Semiconductor Manufacturers, and Software Providers) and (midsized or large enterprises)6.
Most companies have been using known forecasting techniques for their inventory management. In 1999, in a benchmark analysis of the computer industry, Cohen et al state that "Almost all the companies use the ABC method for parts classification, min-max stock level controls and some type of forecasting method. EOQ is also used extensively".
The trend in inventory planning software is driving companies from optimizing inventory levels for parts in a specific location or mode to global and multimode optimization inventory software (Industry Expert, Interview, 2006) According to a study by AMR Research (June 2005)
"high tech is also in the lead in consolidating service networks to create global planning
environments by integrating to multiple Enterprise Resource Planning (ERP) Systems". The same authors (October 2005) give an example of an OEM that succeeded in reducing its service parts inventory level by $75 million by switching to a multi-echelon optimization model and by pooling its slow-moving parts in centralized locations. In the same study, multi-echelon optimization, pooling of inventory and multi-indentured optimization are identified as areas that
companies have the opportunity to improve in the future.
3.5 Customer Service
In service parts management there are two distinct situations in terms of customer service. In the first scenario, the company (or a third party partner) services the product which the company sells, while in the second scenario, the company services a product that it owns. In the computer industry where the end customer is the consumer (either a person or a company) the company services a product that it sells (Industry Expert, Interview, 2006).
The expectation of the customer, especially in the servers and workstations sectors, is to have the machine up and running again in the minimum possible time. The response time that the
customer is willing to wait is decreasing as times goes by. Of course, there is a service level -cost tradeoff. (Industry Expert, Interview, 2006) Companies price their servicing in different ways to satisfy different customers. Dell's three-level service structure is a typical example (see
Appendix B). Cohen and Agrawal categorize service packages in the almost the same way: Same
day on site service, Next Day and 3-5 days service (1999).
In the server and workstation sector, immediate response (6 hours or less) is becoming more and more prevalent. In the personal computers sector, although response time usually is longer, a 24 hour response time is becoming the minimum for acceptable service
(Cohen, Agrawal, 1999). In the personal computers sector the servicing of the product can be
done in a repair shop and is not on site. Some companies in this sector provide their customers
with loaners (computers they use while the servicing is done) or immediately replace the
malfunctioning machine with a new one (Industry Expert, Interview, 2006). Usually this practice happens as a consequence of a warranty that the company provides to the customer. An example
of a service repair cycle is depicted in Figure 11.
Many times in the case of personal computers the servicing is done in a retail shop, by
the retailer's servicing department and not by the Original Equipment Manufacturer or the parts manufacturer (Industry Expert, Interview, 2006). This practice is especially used by big retailers
(for example, BestBuy) who sell their own warranty plans as extensions or enhancements of the
OEM's warranty plan and take the responsibility to service the product for a specific period in
exchange for a fee. The service by the retailers openly competes with the OEMs by offering a
wide variety of services (on site service, 24 hour- 7 days a week service, and others)7.
Job completion Time (downtime) 4 CE Response Time Remote D iagnosis Cus to met calls Fix Time On-site diagnosis A
Paits Deliveryv Time
Parts Availabilitv W arehonsing
(pick, pack) Transportation
On-site ~epa
On-site repair
Parts arrive CE orders parts,
if necessary
CE arrives with some or all of the required parts
Repair job completed,
machine is up
Figure 11: Field Service Repair Cycle. Source: Cohen and Agrawal, 1999
A 3I achi e fails M ach-ne I Machine fails again ^ w~~1 -· ' , , . 4 k
4
The Telecommunications
Equipment Industry
4.1 Industry Overview
Defining the Telecommunications Equipment industry is a complex task by itself. In particular, deciding which parts of the industry to include and which to exclude is difficult. For this research, the main factor for this division has been whether each sector of the industry can support aftermarket services or not, and especially if the services that the companies provide include service parts management.
Standard and Poor's includes in the telecommunications industry all companies that offer services or sell products in the following areas: Broadband access, Optical, Private Branch Exchange, Routing, Switching, Wireless Handsets and Wireless Infrastructure8. According to Hoover's online database, our research for this industry includes Telecommunications Equipment, both wireless and wireline, as well as computer networking equipment, mainly switches and routers9.
In general, we can see even from the start of the research, a close connection between the
telecommunications and computers industries, a connection that we will identify also in the
aftermarket sectors of these industries.
8 Standard and Poor's. Industry Surveys: Communications Equipment, 02/02/2006. www.standardandpoors.com
For this thesis, our main interest for research lies in companies that operate in routing, switching and telecommunications infrastructure. The industry overall is showing growth in the last years, after a serious fall in 2000 and 2001. The whole hardware industry for communications and data networking equipment is estimated by Standard and Poor's to be around $300 billion in revenues. This sector is dominated by companies that manufacture the equipment and that are located in various regions globally, Some of these companies which compete and operate in different market segments are: The French-based Alcatel, the Japanese Fujitsu and NEC, the U.S.-based Cisco, Motorola and Lucent, the Canadian Nortel, and finally the Europeans Nokia and Ericsson. These companies operate around the world, manufacturing a variety of products and have relationships with major telecommunications companies and governments around the worldl° .
SELECT VENDOR OPERATIONS
BROADBAND VENDOR ACCESS 3Coin Alcatel · Avaya Cisco · Ericssoii Huawei Juniper Lucent i) Motorola NEC Nokia Nortel Siemens
All vendors indicated with ") or are share data. OPTICAL 0 PRIVATE BRANCH EXCHANGE KD O S ROUTING S3 0 SWITCHING 0 , 0 WIRELESS WIRELESS HANDSETS INFRASTRUCTURE 0. i) 0 0 ~~~~~~~~~~~~~~~~~~~~~~~~0 © CD e:) * S * · 0 S
participants in that industry. Denotes top three vendors in each industry area, based on 2004 market
Table 2: Major Companies competing in different market segments in the Telecom industry. Source: Standard and Poor's, Company Reports, 2006
The customers of the industry and especially the industry segments this research is interested in are mainly major enterprises and organizations with large networks and global operations. In the enterprise sector, we witness an increasing interest and investments in telecommunications equipment in the last years. The Telecommunications Industry Association
expects the enterprise segment to be $122 billion in 2007. This gradual increase is mainly
attributed to a network upgrade cycle which is happening in the last years. These cycles occur
within the market in order for the enterprises to adapt to the emerging new technologies and to
have up-to-date networks. The last cycle took place in the late 1990's because of the fear that
computers and networks would not handle dates correctly after the year 2000 (Y2K problem). Since switches and routers have a lifecycle of four years on average and become obsolete and other similar components have a lifecycle of up to 10 years, the necessity for another upgrade
cycle is obviousl US ENTERPRISE SPENDING ON TELECOMMUNICATIONS EQUIPMENT in bions of dollars) 110 105 too 95 An rtu 85 80+_
1L
2000 2001 2002 2003 2004 F2005 F-Forecast.Figure 12: U.S. Enterprise spending on telecommunications equipment. Source: Standard and
Poor's, TIA Online
In the switching and routing sectors, Cisco is the company that dominates the market. Hoover's Online Database mentions that "The ruler of routers, the sultan of switches, Cisco Systems continues to dominate the market for equipment used to link networks and power the Internet". Although the company's customers are mainly enterprises, Cisco has products also for small businesses and consumers. To compete in an environment of increasing competition, Cisco
has used more than 100 (see Appendix C) acquisitions (1993-2006) to enhance its products lines
and specialize in the services it provides. Some major competitors in the switching and router
sub-sectors are Extreme Networks, Juniper Networks and Nortel. Other competitors in the wider telecommunications industry are Alcatel and Motorola. The switchers and routers sector of the company account for 65% of its annual sales 12. The Routers sector is divided into 7 different
categories (Layer 1-7 switches) and the Switches sector is divided into (low-end, mid-range, high-end, multi-service wide area network switches, and broadband aggregation equipment), with the company facing different competitors in each segment (Standard and Poor's, 2006).
GLOBAL NETWORKING MARKET
tin billions of dollars)
15
rt.rn.-- -- kIn rniar
12U I I I U L ;t/ILlll 61lu1o
12 I 9 6 3 0 4-., !, . .. A , A; _ -4 -4- -4 2001 2002 2003 2004
Figure 13: Global networking market. Source: Standard and Poor's, Dell'Oro Group, 2006
In the wireline equipment segment Lucent is one the main competitors. Specializing in communications network infrastructure, Lucent offers a wide variety of products to its companies, with the help of its Bell Laboratories research and development unit. The company
suffered a lot in the crisis of 2000 and 2001, and had to undergo a five year restructuring plan to
survive. This affected all of the company's business units, including its aftermarket sector. One of the biggest companies in the industry, Alcatel, agreed to buy Lucent for $13.4 billion in April 2006'3.
The major trend in this industry, driven mainly by competition, is that all main competitors start to offer to their customers complete bundles of products, including voice, video and data services. According to a survey by Standard and Poor's "bundled service has become a critical success factor". Globally the communications infrastructure is becoming a series of interconnected networks supporting all the above mentioned capabilities. This phenomenon is becoming both a challenge and an opportunity for major companies. Companies that were not traditionally competing directly now start offering similar hybrid products, and the industry is experiencing a transformation phase. Some of the areas of this competition in the future will be Internet Telephony (Voice Over IP Protocol - VoIP), fiber-optic service for homes (FTTP), and
Internet Protocol Television (IPTV)4.
4.2 Supply Chain Network Structure
The structure of the aftermarket supply chain networks in this industry has many similarities to the structure of the previously analyzed computer aftermarket supply chain. The major characteristics of this supply chain depend on the type and complexity of each product, the
13 Hoover's Online Database. Custom Report Builder. Lucent Technologies, Inc. http://premium.hoovers.com/
price and the range of prices of each component, and the criticality of the product to the customer.
The number of the products that each company produces and the complexity and diversity of these products is the first major factor that affects the structure of its aftermarket network. For example Cisco produces a wide variety of products, from the gigantic CRS-1 router to small switches and products designed for homes and individual customers (Boasson, 2005)
The aftermarket for the telecommunications industry consists usually of a 3-tier network (Central or Global Distribution Center, Regional Distribution Center and Local Distribution Centers or Stocking Points). Fast moving parts are stocked many times on the customer's site, where the servicing is usually done. The stocking points usually serve the company's technicians, since they are the people responsible for the on-site servicing. (Industry Expert, Interview, 2006). Since the companies usually have to response within hours for premium service contracts, local stocking points usually serve customers within a 120 mile radius at a maximum, while service technicians also have parts (usually cheap fast movers) stocked on their vehicles, creating what is called "trunk" spare parts (Kass, 2004)
Despite the multiple local stocking points the network in this industry is relatively simple,
since there are a few manufacturers and the major customers, especially enterprises are located in
fewer places than, for example, the customers in the automotive industry or the personal computer sector of the computer industry (Industry Expert, Interview, 2006).
In this industry the criticality of the product to the customer is increased, compared to the
computer industry. Although similar in characteristics, a malfunction of a network would cost the customer (enterprise or organization) even more than the cost of a problematic server or
workstation (Industry Expert, Interview, 2006). Thus, the aftermarket network is designed to be as close to the end user as possible to minimize these phenomena.
Of course, market conditions also play an important role in the design of each company's aftermarket. For example, Lucent had 16 repair centers in early 2001 but kept only four in 2003,
due to restructuring of the company after the crisis that the market suffered a few years ago.
(Boasson, 2005)
4.2.1 Cisco's Aftermarket Structure
Besides being a global leader in this industry, Cisco was mentioned by many interviewers and publications during my research as the company with the best aftermarket services in the telecommunications equipment industry. Therefore, a part of this chapter is devoted to the analysis of Cisco's aftermarket structure and the practices that the aftermarket division of the
company uses.
Cisco's revenue from aftermarket services grew 12% in the second fiscal quarter of 2005,
with the revenues adding up to $998 million. The aftermarket division represents 16% of the
total revenues that the company has (Moad, 2005). Cisco's Global Products Services, as the aftermarket division of the company is called, manages a very complex supply chain, designed to provide excellent customer satisfaction. The network of the company consists of 3-5 echelons (usually a central depot, regional and local warehouses, and forward locations of inventory),
depending on the region, with nearly 750 stocking locations. The division serves over 10 million
service contracts, with thousands of transactions each day. These contracts are segmented according to different customer performance targets. The three major categories are (Cohen,