Publisher’s version / Version de l'éditeur:
Vous avez des questions? Nous pouvons vous aider. Pour communiquer directement avec un auteur, consultez la première page de la revue dans laquelle son article a été publié afin de trouver ses coordonnées. Si vous n’arrivez pas à les repérer, communiquez avec nous à [email protected].
Questions? Contact the NRC Publications Archive team at
[email protected]. If you wish to email the authors directly, please see the first page of the publication for their contact information.
https://publications-cnrc.canada.ca/fra/droits
L’accès à ce site Web et l’utilisation de son contenu sont assujettis aux conditions présentées dans le site LISEZ CES CONDITIONS ATTENTIVEMENT AVANT D’UTILISER CE SITE WEB.
Technical Memorandum (National Research Council of Canada. Division of
Building Research); no. DBR-TM-15, 1950-04-01
READ THESE TERMS AND CONDITIONS CAREFULLY BEFORE USING THIS WEBSITE.
https://nrc-publications.canada.ca/eng/copyright
NRC Publications Archive Record / Notice des Archives des publications du CNRC :
https://nrc-publications.canada.ca/eng/view/object/?id=4142e30f-9078-47e0-9f80-3059d0260443
https://publications-cnrc.canada.ca/fra/voir/objet/?id=4142e30f-9078-47e0-9f80-3059d0260443
NRC Publications Archive
Archives des publications du CNRC
Access and use of this website and the material on it are subject to the Terms and Conditions set forth at
Canadian survey of physical characteristics of snow-covers
G.].
KLEINCANADIAN SURVEY OF PHYSICAL
CHARACTERISTICS OF SNOW-COVERS
Reprinted from
GLACIERS AND CLIMATE
CANADIAN SURVEY OF PHYSICAL
CHARACTERISTICS OF SNOW-COVERS
By G. ]. KLEIN
Introduction
E
very winter, for several months, almost the whole of Canada is covered with snow.The economic consequences of this are considerable. but they have long been ac-cepted as commonplace and inevitable. Only recently has any attempt been made to study the properties and variations of snow scientifically. This is the first step towards forecasting its behavior and towards learning how best to exercise some measure of control over snow. Canadians have followed the remarkable progress made in Europe in this work and are glad to have an opportunity to pay tribute to Professor H. \V:son Ahlmann's
distinguished contributions to the study of snow and glaciers. It therefore seems fitting
to present in this volume the results of the first comprehensive snow study ever made of Canada.
Large scale systematic snow observations have formerly been of three kinds: (a) meteor-ological measurements of snowfall, (b) hydrmeteor-ological snow surveys to determine the quan-tity of water stored as snow in river basins in order to predict the spring run-off, and (c) snow surveys for avalanche control as developed in Switzerland. Of these, only the latter have been concerned with the physical condition of the snow.
The properties of different forms of fallen snow vary so greatly that data on snow depth alone are quite inadequate for such problems as snow removal from highways, railways and airports; the development of over-snow motor vehicles, and the resistance of sleigh runners and aircraft skis. The scarcity of snow-cover data appropriate to these and similar problems, some of which are of considerable economic importance, led the Associate Committee on Soil and Snow Mechanics of the National Research Council of Canada to conceive the idea of the survey herein described and to develop the technique and instruments which have now become the standard in Canada for obtaining specific data on fallen snow.
The survey has been in operation during the past two winters and was conducted by the Meteorological Service of the Department of Transport and the Associate Committee on Soil and Snow Mechanics of the National Research Council of Canada.
In the following description »snowi refers to a mass of snow rather than an individual
CA;';"ADIA=" SURVEY OF S;';"OW-COVERS 107
Object of the survey
The object of the survey was to carry out periodic measurements of the physical cha-racteristics of the snow-cover at a number of observation stations in order to obtain use-ful data applicable to a wide variety of winter problems, especially to those in which the condition of the snow is an important factor. The survey was also intended to provide a basis for future studies of the fundamental properties of the various forms of fallen snow.
OBSERVATION STATIONS
1947
SNOW-COVER SURVEY
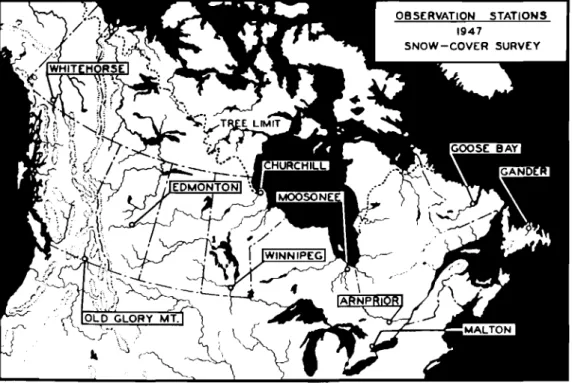
Fig. 1. Canadian observation stations 1947.
Observation stations
Fig. I shows the distribution of the observation stations in the 1947 survey.
A. fair comparison of the results of several sta tions is difficult except when there is uniformity in the amount of shelter from sun and wind. Because intermediate degrees of
shelter are not easily defined the survey was limited to two types of stations: exposed
sta-lions with a flat unprotected test area free from disturbances due to trees, buildings, ctc., and sheltered stations with a test area exposed only to precipitation, e. g., a narrow strip along the south edge of a small clearing in moderately to heavily wooded country. Only exposed stations were used in the 1947 survey.
The test area at Old Glory Mountain was adjacent to the Meteorological Station at the top of the Mountain; all others were on or adjacent to airports.
108 G. J. KLEIN
At Churchill, completely exposed areas are unsuitable for snow measurements because of the prevalence of shifting bare patches which are produced by strong, steady winds. A test area slightly sheltered from the wind but exposed to the sun was therefore chosen at Churchill.
The principal topographical features of each station are given below.
Arnprior セ Very flat, open farm land with scattered wooded areas.
Churchill セ Very flat barren country with practically no trees.
Edmontonセ Elevation 2 200ft セ very flat, open farm land with scattered wooded areas.
Gander セ Flat, heavily wooded country.
Goose Bay セ Flat, heavily wooded country with low brush in the immediate vicinity
of the airport.
Maltonセ Very flat, open farm land with scattered wooded areas.
Moosonee -- On the bank of a river in very flat barren country with some thinly wooded areas.
Old Glory Mt. セ Elevation 7 790 ft セ surrounded by mountains of approximately the
same elevation.
Whitehorseセ Elevation 2400ftセ on the bank of a river in a heavily wooded valley with
mountains of 6000 to 7000 ftelevation within 10 miles in most directions.
Winnipeg セ Very flat, open farm land with very few trees.
The elevations which have been omitted in the above table were all less than 800 ft above sea level.
Fundamental considerations
The physical properties of a material generally depend upon certain of its basic features such as composition and structure. Experience has shown that this is true for snow.
Snow is a very porous material. Taking wet snow as the general case, it may be consid-ered to be a mixture of ice, air and water. The relative proportions and the physical properties of each constituent will therefore influence the physical properties of the snow. Since the properties of ice vary with temperature, temperature will be a contributing factor.
The size and shape of the grains which make up a mass of snow have a considerable influence upon its properties. New snow, because of its fragile crystals, is structurally weaker than old snow which has grains of compact form, and the cohesion of wet snow depends upon grain size just as the cohesion of damp sand depends upon its grain size. The snow grains often become bonded together during settling. This bonding can add considerably to the structural strength of the snow.
We may therefore consider the basic features upon which the physical properties of snow depend and which distinguish one form of snow from another to be: (a) temperature, (b) relative proportions of ice, air and water, (c) average size and average shape of its grains, and (d) degree of bonding between the grains.
CANADIAN SUH.VEY OF SNOW-COVERS 109
Temperature and average grain size can be measured without difficulty; the relative proportions of ice, air and water can be expressed in terms of specific gravity and percent-age free water content, and averpercent-age grain shape may be described with reference to a
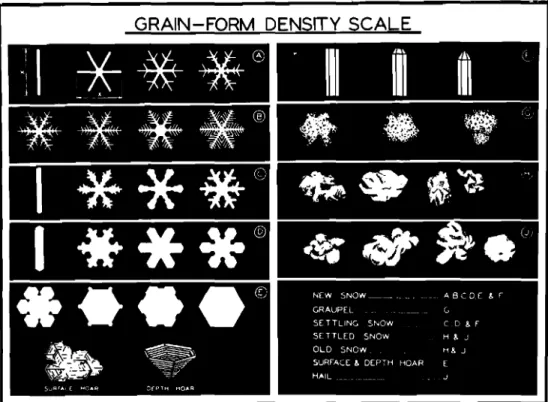
suitable chart such as the »Grain-Form Density Scale» adopted in the survey.
The most direct measure of the degree of bonding is the tensile strength of the snow. Tensile strength measurements, however, are rather inconvenient for routine use in the field. A more common measurement is that of snow hardness although it is perhaps a little less direct.
Any layer in a snow-cover can therefore be described by measurements of: r) snow temperature,
2) specific gravity,
3) percentage free water content, 4) average grain size,
5) average grain shape, and 6) snow hardness.
Instruments
The instruments, which were designed especially for the survey, had a number of
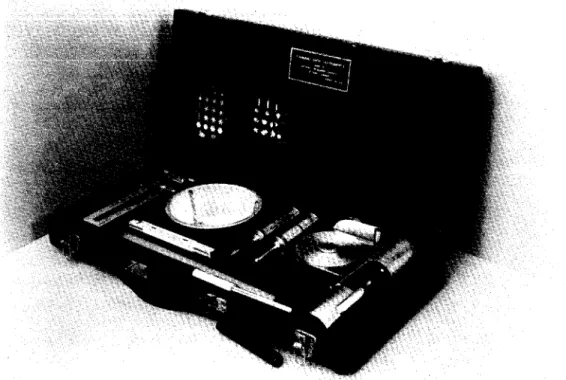
conven-ient features. The complete set, shown in Fig. 2, weighed r6 Ibs including the carrying
case.
110 G. J. kleiセ
Fig. 3. Snow sample cutters.
Snow sample cutters
The cutters and knife shown in Fig. 3 were used to obtain samples of250cc volume.
In determining the specific gravity of a snow layer, either two or four samples from the
layer, i. e., 500 or I 000 cc, were weighed at a time. The soft snow cutter, shown at the
left, had a handle shaped to facilitate rotation about its axis in order to avoid compressing the snow. The removable cover plate was used only when samples tended to slide out of the cutter or when the specific gravity of a cohesionless layer was being determined. The hard snow cutter is shown at the right. The knife was used to trim the ends of the samples.
Balance
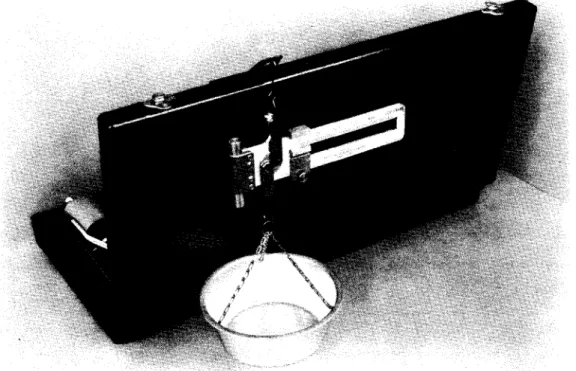
The beam type balance, shown in Fig. 4, was ideal for specific gravity and percentage
free water content measurements. It was more accurate than a spring balance and its
auxiliary rider simplified free water content measurements. The auxiliary rider contained a spring clamp which could be released by pressing the button on the rider. The counter-weight at the left could be raised or lowered to alter the sensitivity without disturbing the zero adjustment of the balance.
c|セセ|dl|セ SURVEY OF sセo|yMcovers 111
Fig. 4. Beam type balance.
Hardness gauge
Various instruments have been employed to measure snow hardness such as the Swiss
»Kegelsonde» (I) and Nakaya's impact cone mounted on a pendulum (2). The gauge used
in the survey was a spring balance type similar to one developed by Eugster and referred to by Seligman (3), and was chosen because it was very compact and covered an extremely wide range.
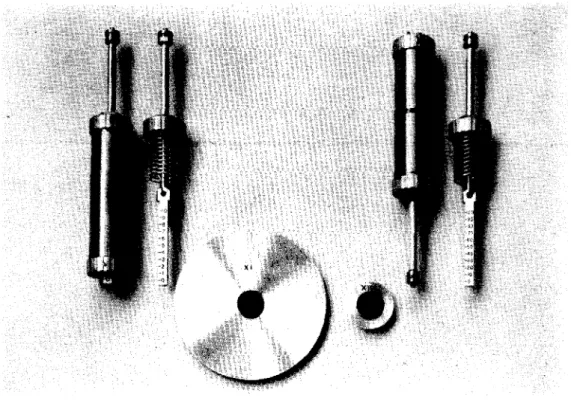
Two gauges are shown in Fig. 5; the one at the left is the low hardness gauge and the one at the right is the high hardness gauge. The latter had a spring ten times as stiff as that of the former. The corresponding spring and graduated push rod are shown beside
each gauge. The discs at the bottom of Fig. 5 had areas of roo and IO em- and were
held in place on the end of the push rod by the friction of a rubber washer cemented to
the back of each disc. Two smaller discs having areas of La andO.I em- were permanently
attached to the end of the rod.
The gauges were generally used horizontally against the wall of a test trench. When used vertically, a small correction was made for the weight of the moving parts. The read-ing was obtained by slowly pressread-ing the gauge against the snow and notread-ing the value on
the graduated scale at which the disc began to enter the snow. The hardness, in gms/cm2,
112 G. j. KLEI="
Fig. 5. Hardness gauges.
Disc Diameter em Disc Area cm'' Multiplying Factor
II. 28 100 I
3·57 10 10
I.I3 I 100
0.3 6 O.I 1000
The low hardness gauge was normally used with only the 100, 10 and I ern- discs (0
to I 000 gmsjcm-) and the high hardness gauge with only the I and o.I cm'' discs (I 000
to 100 000 gms/cm-). Readings to the nearest half division were considered sufficiently
accurate.
Cup, magnifying glass and spatula
These are shown in Fig. 6 and were used for observing the size and shape of snow grains. The circles engraved on the bottom of the cup had radii which varied by one milli-meter steps and formed a scale for observing grain size. The spatula was used to place and arrange the granules in the cup and to break up aggregates. A folding scale which was used for depth measurements is also shown in Fig. 6.
CA..xADL\X SUH.VEY OF SXOW-COVERS
Fig. 6. Cup, ャャャセァョゥヲケゥョァ glass, spatula, and scale.
T hermomeiers
113
Each set of instruments contained two 100 to _100C mercury filled thermometers
and two 50 to - 100°C liquid filled thermometers. Four thermometers with a 100 to
- 50°C range would have been more convenient but were not commercially available.
The thermometers were laboratory grade, 12 inches long.
Grain-form Density Scale
While there is an infinite variety of snow grain forms, the important feature is the degree
of compactness of the shape of the grains. This feature has been given the name
»grain-form density».
The scale of grain-form density used in the survey is shown in Fig. 7, and although the classification is more or less arbitrary this does not in any way detract from its
use-fulness.Itwas intended to be merely a scale of the degree of compactness of grain shape and
not a classification of the various forms of snowflakes and snow grains. The purpose was to provide a simple scale of grain shape which would indi.cate the texture of a snow layer when both average shape, as described by the appropriate class in the scale, and average size of its grains were given. The criterion of grain-form density was taken as the relative structural strength of the grains or crystals due to shape alone. Each class refers to many
114 G. J. KLEIN
GRAIN-FORM DENSITY SCALE
* • _
イセ
.' " セ
Fig. 7. Grain-form density scale.
different shapes of grains but all shapes in anyone class have approximately the same influence on the properties of a mass of snow. While the classes may not be uniformly spaced an attempt was made to arrange them in proper order. A description of each class is given below,
Class Description
A. Very slender needles, and plane crystals with very slender rays and not more
than three pairs of delicate branches per ray. This class is limited to new snow crystals of very slender proportions and open pattern.
B. Plane crystals of new snow with many delicate branches, and very feathery
hoar crystals.
C. Plane crystals and needles of new snow having somewhat more substantial form
than classes A and B, and partly settled snow grains of similar structural strength.
D. Plane crystals and needles of new snow having still more substantial form than
caセadian SURVEY OF SNOW-COVERS 115
E. Hexagonal plate crystals of new snow or hoar and cup crystals of hoar. The
plate crystals mayor may not have various forms of small notches in their sides or small extensions at their corners.
F. New snow crystals in the form of columns having a length to diameter ratio of
four or less, and partly settled snow grains of similar structural strength.
G. Graupel or soft hail, i. e., snowflakes which have received a thick coating of
rime during their fall to earth. Flakes with thin to moderately thick coatings belong to the class preceding G in which their shape including the rime deposit would place them.
H. Grains of settled snow and old snow with crystal facets. The facets are produced
by sublimation and their presence indicates that no recent melting has occurred.
J.
Grains of settled snow and old snow with no crystal facets. Grains which havelost their facets by abrasion during drifting or by melting which mayor may not be followed by freezing, and hail belong to this class.
The above classes can usually be identified very easily although the facets of class H are sometimes difficult to recognize. A method which will serve to demonstrate the
dif-ference between classes Hand
J
is to observe the amount of sparkle when direct sunlightfalls on a sample of old snow. Iffacets are present, they will give a distinct sparkle effect;
the fractures of broken grains are seldom flat and will not produce such clear cut reflections.
Procedure
The procedure followed at each station has been described in detail in Report MM-I92 of the National Research Council of Canada (4). An outline is given below.
At each station a suitable area of about500sq ft was selected for the weekly and daily
observations. A depth gauge in the form of a post marked off in inches was set up at one edge of the test area.
Weekly observations
Once each week a new test trench, about 3 ft X 3 ft was dug down to the ground and
the boundaries of the snow layers were located by examination of the section or by pre-liminary hardness tests. Air temperature, total depth of the snow-cover and the depths to the layer boundaries were measured, and snow temperature, hardness, average grain size, average grain shape and specific gravity were determined for each layer. Percentage
free water content was only determined when the snow temperature was very near 0°C
and then for only three or four representative layers. Each trench was filled in on comple-tion of the measurements.
Daily observations
Observations of air temperature, total depth of the snow-cover, average size and average shape of the grains in the uppermost layer, wind speed, amount of sunshine, and the
116 G. J.KLEIN
amount and kind of new precipitation were made each day. These were intended to establish continuity from one set of weekly measurements to the next.
Most of the daily and weekly observations were made at about 10:30 and almost all
of the remainder at about 15:30 local time. The aim was to obtain approximately the daily
mean value of air temperature.
Some observers reported wind at the time of the observation in miles per hour, while others used the Beaufort Scale or descriptive words. Further, the amount of sunshine
was reported either in hours of sunshine for the previous day or as »overcast», »partly
cloudy», »clear», etc. for the period since the last observation. This variation was no fault
of the observers. Report MM-202 (5) was subsequently issued to ensure a greater degree
of uniformity in the following winters' surveys. These amendments, however, were not in effect during the 1947 survey.
Description of the measurements
Most of the measurements were quite simple and were made in the usual way. A few, however, require further explanation.
The temperature of a snow layer was always taken at the center of the layer thickness. Hardness, grain size and grain shape measurements were gnerally taken as average values for the layer.
Grain size was taken as the maximum dimension of a single grain.
Whenever new snow contained graupel, the average size of the graupel, as well as the
average size and shape of all the other crystals were recorded, e. g., G 1.2, B 3.0;
other-wise only the average size and average shape were recorded.
Percentage free water content was determined by a simple calorimetric method. From
300 to 400 gms of hot water, between 50 and 80°C, were placed in the balance bucket
and its weight and temperature were measured. The balance was then set at zero and again balanced using only the auxiliary rider. A sufficient quantity of the wet snow was added
to bring the temperature to between 5 and IS0 C. The mixture was stirred to make sure
that all ice particles were completely melted. The final temperature and the weight of snow which had been added were then determined. The percentage free water content was found by the use of nomograms for the following equation:
where W = weight of water, gms
S = weight of snow, gms
T1 = initial temperature of water, °C
T2 = final temperature of water and melted snow, °C
No corrections were made for the loss of heat to the air or for the thermal capacity of the bucket which was made of aluminium and weighed slightly less than 50 gms.
CANADIAN SURVEY OF SNOW-COVERS 117
Wind speed, amount and kind of precipitation and the amount of sunshine were obtained from the records of the Meteorological Station adjacent to the test area.
The total depth of the snow-cover, the depths to the layer boundaries and the amount
of precipitation were measured in inches and wind speed in miles per hour - the standard
units in Canada. The characteristics of the snow, however, were either expressed non-di-mensionally or were measured in metric units to facilitate comparison with the compre-hensive Swiss researches in snow mechanics.
Results of the 1947 survey
The results discussed here were obtained at exposed stations during the period from the middle of January to the middle of May 1947. They clearly demonstrate the value of surveys of this kind.
In order to facilitate analysis, the observations were plotted as graphs, examples of
which are given in Fig. 8 to 13. These graphs retain practically all details making it
possible to examine the conditions under which certain changes occurred. They also reveal general trends and disclose features which might otherwise escape notice.
General results
The results of all the stations taken together show several notable features of a general nature.
Air temperature and wind had a decided influence on the condition of the snow-cover, while the effects of sunshine were relatively small. The flow of heat from the earth appeared to cause some changes in the snow structure particularly in the lower half of the snow-cover. Isolation of the effects of anyone factor, however, is not feasible because it is the combination of factors which is most important.
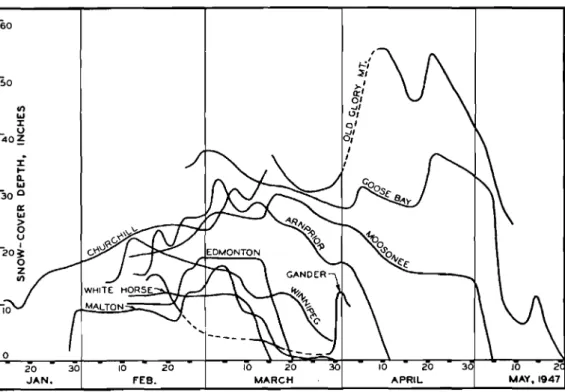
Wet snow conditions were surprisingly rare and were almost entirely confined to the short period of the spring thaw represented by the final steep slope of the snow-cover depth curves shown in Fig. 14. At Gander the main thawing period occurred late in February.
The maximum rate of ablation occurred at Goose Bay early in May when the
snow-cover depth decreased 20" in two days.
One inch below the surface the snow was harder than 100 gms/cmt in70
%
of all cases.Only rarely did the depth of moderately soft snow at the surface exceed10inches. Generally
most of the snow-cover and frequently all of it had reached or passed the settled stage. The most significant characteristic of a snow layer was hardness. Hardness, together with shape and size of grains would, in nearly all cases, give a fairly complete description of the layer.
Table I gives the range of specific gravity and hardness for the different kinds of snow layers.
There were relatively few cases of wet settling snow - often called »wet new snow»
118 G. J. KLEIN
WEATHE:R OATA WEATHE:R OATA
[ONONTON fEBRUARY lI·n EDMONTON MARCH 11-47
"'
, , T I I o I.
I!
.
N
:-'....
. ....
'1 0•
'0
'.
20"
0
2W
II
•
I II.
l.l'
' i0
'0
.s0
セQᄋQ_Ad010 010 CIDIO!"I"I"IJIJJ JJJ
II
:U
iI
illlllill L II
SuR II.C, LAyER ONLY L R R TOCo "IN S.
INCJ;i:1 Ii
QQQZゥZiZi[iセ[i[ゥャャャNQ
II
tit
I
[[JJI)
PRt:ClP1TATION. 6HAJL *SNOW .Sl.£[T eRAIN ,DRIZZLE.
)0 ONT , '" セ )() I
II! )
IIi:
.
iI
! III
iセ1
I I ,I
i I! L..,I I I01 I i i
Iijエセ
1
I:i
: I,II
-i+T
-1,1.1
1 1!
It Iiii
I0
iii •j • • •-I .,.,••-: '
:·;·'·,·1•
'0
" 20,
30
•
iI I i I...il ' I I ....Ii
·
!
i I I I'I!
I
I0
II I I I LII
iH
Ii'0
, II'
II
tcC C ' :ccc'E\e''''cwc001
0 1 I•
' r t:Dt
I I II iii' 'i1.H1J
i
I-UI
0
LA. ONLY. L R R TO C AIN !>HN'E. !i I! II
I
i
III
!iセAゥ[[G!
AVGセAエャZ[セZセA
III
•
I I .iI.
I I,; ..J
!"'*''''''
'NCO<PA£CIPITATIQN. 6HAJL ..SNOW .. 5LLE T • RAIN • DRIZZLE
""",..
Fig. 8 and 9. Weather data at Edmonton, February and March 1947.
SNC7f!-C9VER PROfLE FEBRUARY n 1!l47 rpMONION SNOW-COVERPROflh£ '£BRUARJ 14 .,.,
til
セ
E •• "GI'
セ e ri.
セpth=...".,,"",..","'","
BtLOW' SUAf'ACE. INCH[S...!
!
..
ic..
-
•
0 0 0 ""T.\
-
セ .--' 0,セ
MZZZZセセセOセセセᄋ ac-
セ [ZZZセQエゥセc"
--•
I. 10 ,:i
i
1.:;
1:1
0, ""'" "0"""J:
OCPTH B'£lOW 5UfU"ACE. INCHES. 0<> I
..
r--
•
e 0 rT•...,
f-\H
- I--'-- NEWセ
セセカ THIN CRUST....
eZZZZセセlセセn CRUST ::'-5ETTl£O ヲッZセ セセセセャゥセGn CRUST•
_OLD 1-'"""""- 2..
.JCANADIAN SURVEY OT' SNOW-COVERS
Table I
119
Grain Size
Specific Gravity Hardness gms.jcm2
mm
Type of Snow Layer
I
Max.I
:Vlax.I
I
I
Min. Min. esual :VIin. Max. Usual
Range Range
I. Dry New Snow ... 0.2 7 .048 .11 . 0 ] - . 1 0 0.5 20 1 - 10
2. Dry Settling Snow ... 0.2 5 .09 .22 . t o - - . 2 0 5 200 1 0 - 100
3· Wet Settling Snow .... 0.2 5 .10 .24 . I5---,2 0 20 100 2 0 - 100
Class H
I
4· Dry Settled Snow ... 0.2 I .20 ·33 . 2 3 - . 3 0 25 8 000 8 0 - 800
5. Dry Old Snow ... I 7 .20 ·34 .23-·3° 50 9000 8 0 - 1000
(excluding 6) I
1 I
I
20016. Loose Granular Snow .. 1 9 . I I .3 0 .r8-.28 15 20-- 100
Class J
7· Dry Settled Snow ... 0.2 1 .20 . 4セ .25 ----·35 25 6000 1 0 0 - 6000
8. Dry Old Snow ... I 8 .20 .53 .25 --.45 50 20000 1 0 0 - 2 0 000
9· ,Vet Old Snow ... I 4 .28 .52 .35-.5 0 20 5 0 0 5 0 - 5 0 0
The dividing line between settled and old snow was arbitrarily taken as I mm grain
size.
Types 5 and 6 often contained depth hoar - in fact some layers were almost entirely
composed of hoar crystals.
Snow conditions at the different stations
The total depth of the snow-cover at the different stations has been plotted in Fig.
14.It should be noted that at Goose Bay the snow-cover depth was much greater than
at Gander which is only 400 miles south-east of Goose Bay. Gander and Goose Bay are
about 30 and 130 miles inland respectively. The small amount of snow at Gander was
due to fairly mild weather with the occasional rain.
Malton and Arnprior - about zoo miles apart - had quite different snow-cover depths.
Temperatures and the frequency of precipitation were generally similar. but the amount of snow which fell at Arnprior was usually twice the amount which fell on the same day at Malton. The depth curves for the two stations have approximately the same general shape.
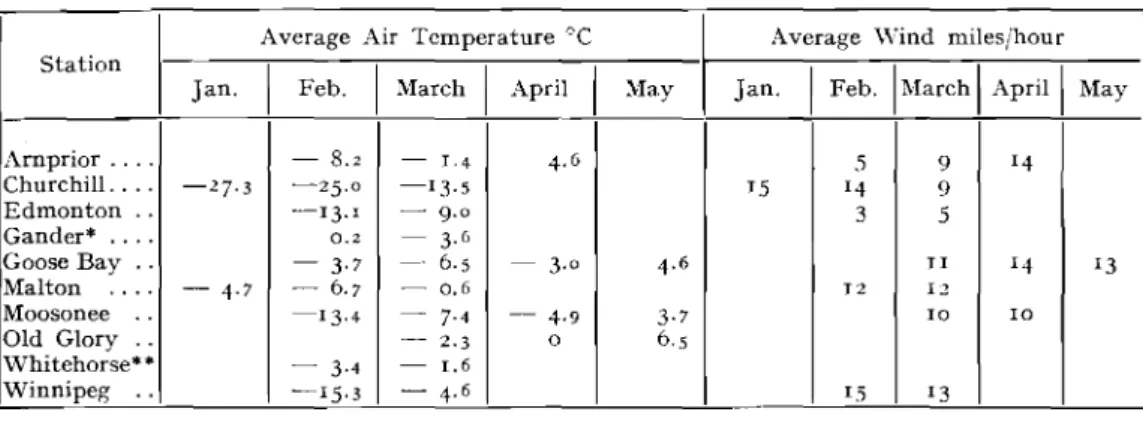
Air temperature and wind speed data for each station are presented in Table II. The values in the Table refer to that part of the month for which the corresponding snow-cover
depth curve in Fig. 14is shown as a solid line.
The snow conditions at the different stations are summarized below. The figures for
snow hardness are all in gms/cm" and »settled snow» refers to snow which has reached
or passed the settled stage, 1.e., settled snow, old snow and loose granular snow.
Arnbrior
Conditions near the surface varied from fairly soft snow to very hard crust. Classes H
120 G. J. KLEIN EDMONTON SNON-CoyERPROOLE MARCH3 1147 EDMONTON SNOW-COYER PROf!I.£ MARCH 10 t i l RPセ III
l
4 セ 2 • " o IQIXIO 4DOO 2llOO WOO..
;<..
.
セ
o • '"..
<; f-- - - ;---- I セ -f-' 0 30 ' l ) 0 ;-. tセ-
l-' III r -セ '-- dfTlU<G:::::::--m;TUDセ
Y_OLD oLOOSEセ
%
セ'"
- ' l )rom-.
セjセ
セV セャi:.
.
_」MLMLMLMLMLMLMLMMLセMLMLMLMLMLMLMLMj
セ
IXPTt'lI!KLOW SuRfACE. INCHCS.
2O::l '" w
s
4 セ 2 • " 0 III セ I I I I 0 30 eo -e . /.>
" 20I! ,H\
MM]セettャNャng 30 S£TTU:.D _•.._ -SETTLED-
1----"_ OLD I '0 ""- eo[fゥfヲM}セA
lセLLLLL
IXPTH BELOW' SVArACE. 1N(.t'l[S.LセLNBL BL}セ
Fig, 12 and 13. Snow-cover profiles at Edmonton in March 1947.
60 50 <Il
...
:r u TPセ :r l-ll....
300 II:...
> o U I RPセ o Z <Il o 20 JAN. 10 20 FEB.,
,..::
セi >-, er' 01 -oJ1 '-'I0'
-.II°1
I I ICANADIAN SURVEY OF SNOW-COVERS
Table II
121
Average Air Temperature °C Average Wind miles/hour
Station
I
II
I
I
I
MarchI
AprilI
Jan. Feb. March April May Jan. Feb. May
Arnprior .... - 8.2 - 1.4 4. 6 5 9 14 Churchill .... -27·3 -25.0 -I3·S IS 14 9 Edmonton ·
.
-13.1 - 9.0 3 5 Gander*..
,.
0.2 - 3. 6 Goose Bay· .
- 3·7 - - - 6·s - 3.0 4. 6 I I 14 13 Malton....
- 4·7 - 6.7 - 0.6 12 12 Moosonee · . -13·4 - 7·4 - 4·9 3·7 10 10 Old Glory ·. - 2·3 0 6.s Whitehorse** - 3·4 - 1.6 Winnipeg · . -15·3 - 4. 6 15 13• Limited data due to scarcity of snow .
. . See remarks on snow conditions at Whitehorse.
ice sheets. The hardness of settled snow layers generally varied from 30 to 1 000. During
the latter half of March there was a thick spring crust - hardness 8000 - at the surface.
Churchill
Strong winds caused drifting and blowing snow on completely exposed areas. Most of the snow at the test area was deposited by the wind; only about one quarter was due to direct precipitation. The wind rapidly transformed new snow into settled snow which, since temperatures were very low, was always class H and had considerable sparkle in bright sunlight. There were never any ice sheets between snow layers which made it difficult to pick out the layers by eye.
The snow at Churchill and on the Barrens has a reputation of always being extremely
hard but this was not entirely supported by the measurements - possibly because the
test area was sheltered a bit from the wind. The hardness of settled layers generally varied
from 100 to 1 000 with a few subsurface layers up to 4 000hardness. On exposed areas the
snow may have been as hard as that at Winnipeg where wind and temperature conditions were more or less similar. No extremely hard crusts which are formed by melting and freez-ing were found durfreez-ing the test period.
The size of settled snow grains increased with depth in much the same manner as shown
for the lower half of the snow-cover in Fig. II, 12and 13. This was more pronounced
at Churchill than at any other station - possibly because of the absence of ice sheets
between snow layers. The coarse layers near the ground, however, were generally fairly hard and dense and could not be described as »loose granular snow).
Edmonton
The entire snow-cover was relatively soft due, apparently, to the exceptionally low
Tem-122 G. J. KLEIN
peratures were fairly low and while crusts were reported, these were seldom ice sheets. All settled snow layers prior to March 14th were class H.
Gander
Since there was very little snow at Gander, relatively few measurements were obtained. Wet spring snow with coarse grains, spring crust and ice were most common.
Goose Bay
Goose Bay had the deepest snow-cover of all the stations with the exception of the one on Old Glory Mountain. Temperatures were moderate and strong winds were common.
From the start of the measurements until the end of April there was a layer, 12 to IS"
thick, of loose granular snow - hardness 40 to roo - near the ground, and throughout
April there was a fairly thick crust - hardness 2 000 to 4000 - at the surface or
imme-diately below freshly fallen snow. The hardness of all other settled snow layers was
be-tween roo to I 000. The high winds caused new snow to settle rapidly. With only a few
exceptions the settled snow was of class J and thin ice sheets between layers were very common.
Malton
During the last two days of January a 4" layer of hail fell accompanied by rain. This
layer became a crust - hardness above IO 000 - which was present in the snow-cover
until the spring thaw began. There was also a solid ice layer on the ground which gradually
increased to
312"
thickness at the beginning of the spring thaw. The hardness of all othersettled snow layers was between roo and I 000. Settled snow was generally of class J and
the layers were usually separated by thin ice sheets.
Moosonee
Up to the end of March there were no ice sheets between layers in the upper half of the snow-cover, but there were some in the lower half which may have been formed during the early part of the winter when the temperatures were not quite so low. Prior to the middle of April there was a layer of loose granular snow near the ground and all settled snow was class H. Thawing conditions began about the middle of April and resulted in very hard snow of class J throughout the snow-cover depth.
Old Glory Mountain
Relatively high temperatures caused new snow to settle very rapidly. Practically all layers had very coarse grains of class J and there were many ice sheets, some fairly thick,
between the snow layers. The hardness of most layers was between roo and I 000. Toward
the end of April the entire snow-cover became wet with a hardness range from 20to 300.
CANADIAN SURVEY OF SNOW-COVERS
Whitehorse
123
Settled snow layers were class
J
with hardness ranging from 20 to I 000. Groundtem-peratures were lower than air temtem-peratures indicating that the weather preceding the tests
was appreciably colder than during the test period. The results obtained at Whitehorse,
therefore, may not entirely represent snow conditions in that area.
Winnipeg
Steady winds and low temperatures were very common with the result that the entire snow-cover, except for an occasional thin layer of new snow at the surface, was hard wind-packed snow of class H. Both hardness and specific gravity were definitely high for
class H, the hardness varying from 200to 8000. The snow grains at all depths and
partic-ularly near the surface were appreciably smaller than found elsewhere. A number of thin crusts, some of them ice, occurred between snow layers but they were not as common as at most other stations.
Conclusions,
The results provide a great deal of general information about snow and the variety of forms in which it occurs on the ground, and clearly demonstrate that surveys of this kind yield data which can be of considerable assistance to both users and designers of winter equipment.
The I947 survey gives a fairly clear picture of snow conditions on exposed areas across
Canada. Subsequent measurements may alter this picture to some extent, but the
con-sistency of the results indicates that the general outline will not change appreciably. If
the survey is extended over about four winters it should provide a reasonably complete picture.
The results show that snow conditions on unsheltered areas, such as airports, are gene-rally fairly hard and that the hardness of the snow on the Barrens, in spite of its reputa-tion, is not greatly different from that on wind swept areas in most other parts of the country. In fact, the hardest form of snow, i. e., frozen spring crust, did not occur at Churc-hill during the test period nor for some time prior to the tests.
Although little would be gained by increasing the number of exposed stations, the value of the survey will be increased by the addition of an equal number of carefully selected
stations shelted from both wind and sun.It is hoped that the survey will be extended in
this direction.
The instruments, grain-form density scale and the general method proved to be entirely satisfactory. The system of weekly measurements supplemented by daily observations produced excellent results and made the best use of the observer's time and effort.
The method used in the survey provides a simple means for defining the physical
cha-racteristics of a snow-cover. It appears to fill a general need which has existed in many
124 G. J. KLEIN Acknowledgments
The author wishes to express his sincere thanks to all who have contributed to the suc-cess of the survey. Thanks are due to the observers who faithfully carried out the obser-vations, and to Dr. Andrew Thomson, Controller of the Meteorological Service of the Department of Transport; Dr. O. M. Solandt, Chairman of the Defence Research Board; Robert Legget, Chairman of the Associate Committee on Soil and Snow Mechanics; and
J.
H. Parkin, Director of the Division of Mechanical Engineering of the National ResearchCouncil of Canada for their valuable cooperation which is deeply appreciated.
Summary
During the past two winters, the specific gravity, hardness and other physical charac-teristics of each layer in the snow-cover were measured once each week at a number of observation stations. The aim of the measurements was to obtain specific data on snow conditions in different areas which would be useful in many problems and which would form the basis for future snow studies. The method and instruments are described, and the results of the first winter's observations are presented.
Literature
(I) HAEFELI, R.:Schneemechanik mit Hinweisen auf die Erdbauruechanik, Eidgenossischen Technischen Hochschule in Zurich 1939.
(2) NAKAYA, U. et al.: The Physics of Skiing, the Preliminary and General Survey,Journal of the Faculty of Science, Series II, Volume I, NO.9, Hokkaido Imperial University, 1936.
(3) SELIGMAN, G.: Snow Structure and Ski Fields, MacMillan and Company. London 1936.
(4) KLEIN, G. J.: Method of Measuring the Significant Characteristics of a Snow-Cover. Report No. MM-192 of the National Research Council of Canada. 1946.
(5) - - Snow-Cover Measurements, Supplement to Report No. MM-192. Report No. MM-202 of the National Research Council of Canada. 1947.