HAL Id: hal-02373508
https://hal.archives-ouvertes.fr/hal-02373508
Submitted on 21 Nov 2019HAL is a multi-disciplinary open access archive for the deposit and dissemination of sci-entific research documents, whether they are pub-lished or not. The documents may come from teaching and research institutions in France or abroad, or from public or private research centers.
L’archive ouverte pluridisciplinaire HAL, est destinée au dépôt et à la diffusion de documents scientifiques de niveau recherche, publiés ou non, émanant des établissements d’enseignement et de recherche français ou étrangers, des laboratoires publics ou privés.
Experimental investigation on laminar burning velocities
of ammonia/hydrogen/air mixtures at elevated
temperatures
Charles Lhuillier, Pierre Brequigny, Nathalie Lamoureux, Francesco Contino,
Christine Mounaïm-Rousselle
To cite this version:
Charles Lhuillier, Pierre Brequigny, Nathalie Lamoureux, Francesco Contino, Christine Mounaïm-Rousselle. Experimental investigation on laminar burning velocities of ammonia/hydrogen/air mix-tures at elevated temperamix-tures. Fuel, Elsevier, 2019, pp.116653. �10.1016/j.fuel.2019.116653�. �hal-02373508�
Abbreviations. GD : Goldmann and Dinkelacker. LBV : Laminar Burning Velocity. OPSF: Outwardly propagating spherical flame. PDF: Probability density function. RES: Renewable Energy Sources. NTP: Normal Temperature and Pressure (298 K, 0.1 MPa)
Experimental investigation on laminar burning velocities of
1ammonia/hydrogen/air mixtures at elevated temperatures
2Charles LHUILLIERa,b,c,1, Pierre BREQUIGNYa, Nathalie LAMOUREUXd ,Francesco CONTINOb,c, 3
Christine MOUNAÏM-ROUSSELLEa 4
a
Univ. Orléans, INSA-CVL, EA 4229 - PRISME, F-45072, Orléans, France
5
b
Vrije Univ. Brussel, FLOW - Thermo and Fluid Dynamics Research Group, Belgium
6
c
Vrije Univ. Brussel, Univ. Libre Bruxelles, BURN - Combustion and Robust Optimization Joint Research
7
Group, Belgium
8
d
Univ. Lille, CNRS, UMR 8522 - PC2A - Physicochimie des Processus de Combustion et de l’Atmosphère,
9 F-59000 Lille, France 10 11 Abstract 12
The present study introduces new laminar burning velocity data for ammonia/hydrogen/air mixtures 13
measured by means of the outwardly propagating spherical flame method at atmospheric pressure, for 14
previously unseen unburned gas temperatures ranging from 298 to 473 K, hydrogen fractions ranging from 0 15
vol.% to 60 vol.% in the fuel and equivalence ratios in the range [0.8 – 1.4]. Results show increasing 16
velocities with increasing hydrogen fraction and temperature, with maximum values obtained for rich 17
mixtures near stoichiometry. The new experimental dataset is compared to dedicated laminar burning 18
velocity correlations from the literature and to simulations using detailed kinetic mechanisms. The 19
ammonia/air correlation presents a good agreement with measurements over the whole range of 20
experimental conditions. The ammonia/hydrogen/air correlation captures the effect of the initial temperature 21
satisfactorily for equivalence ratios below 1.3 and hydrogen fractions below 50 vol.% in the fuel, but 22
discrepancies are observed in other conditions. The effect of hydrogen addition is reproduced satisfactorily 23
for hydrogen fractions between 20 and 40 vol.% in the fuel, but discrepancies are observed for rich mixtures 24
1
Corresponding author. Address: Laboratoire PRISME, Université d’Orléans, 8 rue Léonard de Vinci, 45072 Orléans, France. E-mail : charles.lhuillier@etu.univ-orleans.fr
[Tapez ici]
below 20 vol.% hydrogen and for all mixtures containing 50 vol.% hydrogen and more. An optimization of 25
both correlations is proposed thanks to the experimental data obtained, but only with partial improvement of 26
the ammonia/hydrogen/air correlation. State-of-the-art detailed kinetic reaction mechanisms yield values in 27
close agreement with the present experiments. They could thus be used along with additional experimental 28
data from different techniques to develop more accurate correlations for time-effective laminar burning 29
velocity estimates of NH3/H2/air mixtures.
30
Keywords
31
Ammonia, Hydrogen, Laminar Burning Velocity, Elevated temperature, Spherical vessel, Sustainable fuel 32
1. Introduction
33
In response to growing concerns regarding climate change, a majority of governments have agreed on 34
common objectives to mitigate this phenomenon [1]. A recent report by the Intergovernmental Panel on 35
Climate Change evaluated the possibilities and implications of a global warming limitation of 1.5°C above 36
pre-industrial levels, that would alleviate the negative effects of climate change [2]. The report indicated that 37
fossil-free Renewable Energy Sources (RES) should supply 52 to 67% of the total primary energy demand 38
by 2050 in order to sufficiently cut carbon-based greenhouse gas emissions and thus ensure the warming 39
limitation. 40
This transition will rely on diverse, mostly intermittent RES, such as wind or solar photovoltaic, and will 41
thus require flexibility and grid-balancing strategies, as well as safe and efficient transport and storage. 42
Power-to-Fuel strategies are promising options, in which excess electricity is used to produce hydrogen-43
based synthetic fuels in gaseous or liquid form. Those so-called electrofuels [3] present a high energy 44
density (> 4-5 MJ/l), are stable in time (seasonal or long-term storage), can be transported over long 45
distances and their production can be carbon-neutral. In spite of being already and increasingly recognized 46
as a fuel, molecular hydrogen (H2) presents major drawbacks caused by its high volatility and flammability,
47
including the need for a tailored infrastructure and the associated storage and transport costs and safety 48
issues. 49
Ammonia (NH3) has received recent interest as a carbon-free electrofuel [4,5] with a relatively high
50
energy density (13 MJ/l), as it can be stored in liquid form under 1.1 MPa at 300 K and its lower heating 51
[Tapez ici]
value reaches 18.8 MJ/kg. Additionally, ammonia is already transported and stored safely at industrial scale, 52
which makes it a promising complementary alternative to molecular hydrogen. Current annual production 53
reaches 180 Mt worldwide, mostly from the Haber-Bosch process using steam methane reforming as the 54
main H2 source. However, renewable hydrogen from electrolysis could be used instead while ensuring a
55
satisfactory stability of the Haber-Bosch process [6]. Grinberg Dana et al. showed that NH3 exhibits the
56
highest Power-to-Fuel-to-Power ratio when compared with methane, methanol and dimethyl-ether [7]. 57
However, the high corrosiveness and toxicity of ammonia require thorough safety precautions, especially 58
when final users are exposed. 59
Following these considerations, several studies focused on ammonia combustion, addressing many of 60
the remaining challenges regarding NH3 fundamental combustion properties, chemical kinetics modeling or
61
combustion in gas turbines and internal combustion engines as single or dual fuel [8,9]. A major drawback 62
of NH3 as a fuel is its very low combustion intensity, as illustrated by its Laminar Burning Velocity (LBV),
63
which is one order of magnitude smaller than that of conventional hydrocarbons in atmospheric conditions 64
[10–17]. This represents a challenge for NH3 as a fuel in practical combustion systems, but also for laminar
65
flame experiments themselves, as noted by Pfahl et al. [12], Takizawa et al. [14] and Hayakawa et al. [15]. 66
Indeed, as a function of the mixture composition, ignition energies have to be significantly higher than in the 67
case of conventional hydrocarbons. Moreover, as the LBV for NH3/air mixtures is very slow, the buoyancy
68
effect can cause an outwardly propagating spherical flame (OPSF) to propagate upward as well as outward, 69
thus losing its spherical shape and compromising the measurement. 70
Several experimental studies have considered enhancing the combustion by seeding NH3 with H2,which
71
could conveniently be obtained from ammonia decomposition, leading to a significant increase in the LBV 72
and extending the flammability ranges. Lee et al. investigated the combustion properties of NH3/H2/air
73
premixed laminar OPSFs as a function of hydrogen fractions in the fuel blend, for several equivalence ratios 74
from fuel-lean to fuel-rich at Normal Temperature and Pressure (NTP), i.e. 298K, 0.1 MPa [18,19]. Li et al., 75
by using the Bunsen burner method, provided LBV measurements for various NH3/H2/air mixtures at NTP
76
as a function of equivalence ratios [20]. Ichikawa et al. investigated the LBV and Markstein length of 77
several NH3/H2/air stoichiometric mixtures by means of the OPSF method also at 298 K but for an initial
[Tapez ici]
pressure ranging from 0.1 to 0.5 MPa [21]. Han et al. reported LBV measurements obtained by means of the 79
heat flux method, with NH3 blended with H2, CO or CH4 as fuels and air as the oxidizer at NTP [22]. Kumar
80
and Meyer conducted Bunsen burner experiments for different NH3/H2 blends at NTP, but their results
81
contradict those of the previously mentioned studies [23]. 82
All these studies reported that the addition of hydrogen to an NH3 blend significantly increased the LBV
83
with a maximum value around an equivalence ratio of 1.1. However, only partial agreement is found 84
between the different literature sources and the LBV dataset for NH3/H2/air flames remains significantly
85
limited, especially at temperatures above 300 K and pressures above 0.1 MPa. Moreover, the comparisons 86
between LBV measurements and numerical simulation results found in the literature show a remaining 87
potential for the improvement of the chemical kinetic mechanisms. For instance, Ichikawa et al. [21] showed 88
only qualitative agreement between their experimental LBVs and those obtained with the mechanisms of 89
Miller et al. [24], Lindstedt et al. [25], Tian et al. [26] and Konnov [27], just as Han et al. [22] exhibited 90
discrepancies between their experiments and the mechanisms of Okafor et al. [28] among others. Recently, 91
Cavaliere et al. [29] conducted a survey on ten chemical kinetic mechanisms including NH3/H2 chemistry
92
and selected those of Okafor et al. [28], Mathieu and Petersen [30] and Otomo et al. [31] to be reduced, so as 93
to decrease their computational cost. However, they still report a significant scatter in the results obtained by 94
the different mechanisms and see potential for further improvement in the NH3 and NH3/H2
sub-95
mechanisms. 96
As the use of chemical kinetic mechanisms in simulations remains very computationally intensive, 97
Goldmann and Dinkelacker proposed semi-empirical correlations, called GD correlations in the following, 98
for the LBV of NH3/air, NH3/H2/air and NH3/H2/N2/air mixtures [32]. These semi-empirical correlations
99
were based on the correlation by Metghalchi and Keck [33], by considering the LBV dataset available and 100
estimates obtained thanks to the detailed ammonia oxidation mechanism of Mathieu and Petersen [30]. The 101
correlations are simple, making them very useful to be included in computationally intensive CFD 102
simulations. The LBV is given as a function of the global equivalence ratio, the hydrogen amount, the 103
nitrogen ratio (to simulate dilution) and the unburned temperature and pressure, following the form in Eq. 1: 104
[Tapez ici]
where is a reference velocity depending only on the fuel mixture composition and the equivalence 105
ratio, and the normalized unburned gas temperature and pressure respectively, a factor to model the 106
effect of nitrogen dilution (when relevant) and a correction factor to fit the correlations to the 107
experimental values from the literature. Since literature data included only measurements around 300 K and 108
pressure up to 0.5 MPa, the factor was determined by considering only these conditions in the GD 109
correlations. The proposed correlations were found to agree very well with the experimental data available 110
in the literature, as well as with results from kinetics simulations using the detailed reaction mechanism of 111
Mathieu and Petersen from which they were derived. Since those simulation results showed no abrupt 112
behavior and an improved accuracy when increasing the pressure, Goldmann and Dinkelacker concluded 113
that the mechanism could be extrapolated to pressures above its validation range, and therefore made the 114
same assumption for their correlations. 115
However, this conclusion remains uncertain, as is the accuracy of the reaction mechanisms and LBV 116
correlations for NH3/air and NH3/H2/air mixtures at elevated temperature (above 300 K), due to the lack of
117
experimental literature data under such conditions for validation purposes. The objective of the present study 118
was to partially fill this lack of data by introducing new LBV measurements of NH3/air and NH3/H2/air
119
outwardly propagating spherical flames at 0.1 MPa of pressure for unburned gas temperatures up to 473 K. 120
The GD correlations are also discussed with respect to the new experimental data and an optimization 121
attempt is presented. 122
2. Experimental and numerical methods
123
2.1. Experimental set-up
124
We carried out the experiments in a 4.2 dm3 stainless steel spherical vessel that can be heated up to 473 K by 125
an incorporated resistive coil. A type-K thermocouple and a piezoelectric pressure transducer were used to 126
monitor the temperature Tu and pressure Pu inside the chamber, respectively. The filling procedure was
127
already described in a previous study on a similar set-up [34] and is thus only briefly summarized here. A 128
vacuum pump is used to empty the vessel to a residual pressure of less than 1 kPa and the preheated reactive 129
gases are then introduced thanks to Brooks 5850S thermal mass flowmeters, while being stirred by a fan to 130
ensure a homogeneous mixture. Bottled gases are used, including synthetic air with 20.9% ± 0.2% oxygen 131
[Tapez ici]
and a 99.999% purity, hydrogen with a 99.999% purity and ammonia with a 99.98% purity. After the intake, 132
a quiescent phase of 10 s is set in order to avoid any undesired fluid motion. Then, a discharge energy is 133
delivered for ignition at the center of the chamber thanks to two 1 mm tungsten electrodes. The spark gap 134
can be adjusted from 1 to 3 mm to favour ignition under lean conditions with a high ammonia content. 135
2.2. Experimental conditions
136
The global stoichiometric combustion reaction of NH3/H2/air is:
137
with , the hydrogen molar fraction in the fuel mixture. The global equivalence ratio is defined as: 138
where represents the molar fraction of the species s in the reactive mixture. The experimental conditions 139
are summarized in Table 1. In some boundary cases, such as fuel-lean (resp. fuel-rich) mixtures with 140
(resp. ) and a small hydrogen fraction, the mixture ignition fails to induce flame propagation or 141
buoyancy instability phenomena alter the flame propagation too much to extract meaningful data and such 142
cases are thus left aside. 143
Table 1. Experimental conditions
144 Pu (MPa) Tu (K) 0.1 {298 ; 323 ; 373 ; 423 ; 473} [0 – 0.6] [0.8 – 1.4] 145 2.3. Image processing 146
In the cases with sucessful laminar flame propagation, double Schlieren images of the flame are recorded 147
from two orthogonal angles through two pairs of opposite quartz windows (70 mm diameter) by a Phantom 148
v1210 high-speed CMOS camera, as fully described in [35]. The frame acquisition rate of the camera is 149
adjusted with respect to the propagation velocity of the flame up to 18000 fps, in order to maximize the 150
[Tapez ici]
number of usable images. Following recommendations by Huo et al. [36], a minimum number of 30 images 151
is considered for post-processing. The double Schlieren configuration allows the detection of flame 152
instabilities, but only one view is used to extract the LBV. An example of a flame image is shown in Figure 153
1. 154
155
Figure 1. Double Schlieren view at time t of a stable NH3/H2/air flame at 0.1 MPa and 473 K.
156
The radii of the spherical flames are extracted using an image postprocessing algorithm with background 157
substraction. The range of the flame radius used for the analysis is manually kept between roughly 6.5 158
and 25 mm in order to eliminate the spark ignition and wall-pressure confinement effects. The pressure 159
measured in the vessel remains constant over the whole analysis range. The stretched laminar flame 160
propagation velocity is calculated as a first-order gradient , since the burned gas is assumed 161
to be quiescent. Assuming that the flame is adiabatic and the propagation quasi-steady, is then 162
extrapolated to zero stretch using the nonlinear Equation 4 proposed by Kelley and Law [37], based on an 163
asymptotic analysis by Ronney and Sivashinsky [38] and validated by Halter et al. for methane and 164
isooctane/air flames [39]: 165
The flame stretch is calculated according to for a spherical flame, is the Markstein 166
length and the unstretched flame propagation velocity of the burned state, respectively. 167
The laminar burning velocity is finally calculated from the continuity equation through the flame 168
surface, , where burned and unburned gas densities are calculated from equilibrium 169
calculations. 170
2.4. Uncertainty considerations
[Tapez ici]
The validation of kinetic mechanisms requires accurate measurement data including quantitative uncertainty 172
ranges. In the present study, a method based on the work of Moffat [40] and developed by Brequigny et al. 173
[41] was implemented for uncertainty quantification. 174
The experimental errors are of two kind and described as experimental hardware errors , 175
reflecting the accuracy of the initial temperature, pressure and mixture composition monitoring, and imaging 176
errors , both from the imaging technique itself and the processing.
177
The temperature and pressure error terms are determined by using the correlations by Goldmann and 178
Dinkelacker [32] in Eq. , as and respectively. The exponents and , which are 179
functions and are calculated for each test condition. In most cases, the combined error from those two 180
terms is significantly smaller than ± 2%, but can be higher in a few cases at 298 K initial temperature, due to 181
the difficulty of maintaining the vessel temperature after several combustion tests, without exceeding ± 8%. 182
The uncertainties on the mixture composition are due to the accuracy of the mass flow meters (1% of the 183
full scale) and propagate on the LBV through and . Depending on the representation of chosen in 184
this article, either or can be a variable, while the other is a fixed parameter. While the uncertainty on 185
the variable must be indicated with horizontal error bars, that on the fixed parameter(s) must be propagated 186
in the depicted LBV. Since the LBV dependence on those parameters in the GD correlations is complex, the 187
propagation of the uncertainty could hardly be formulated analytically as for the temperature and pressure 188
errors. It was thus estimated by means of a Monte Carlo method as follows. The set point value of the fixed 189
parameter ( or ) is considered as the mean value of a normal probability density function (PDF), whose 190
standard deviation is given by the uncertainty on the parameter. During a great number of N = 10 000 191
iterations, a random value is taken for the parameter following that PDF. The LBV is then calculated by 192
means of the corresponding GD correlation for each iteration, all other parameters and variables remaining 193
unchanged. For each initial condition, a normal PDF for the LBV is obtained this way, of which the standard 194
deviation is considered to be the propagated uncertainty of or on the LBV. The empirical correction 195
factor of the GD correlations (Eq. 1) was applied only when < 0.5, as it degrades strongly the 196
prediction capability of the and dependences at higher hydrogen fuel fractions, as will be seen in 197
[Tapez ici]
Section 3. Overall, the LBV uncertainty resulting from mixture composition errors is thought to be 198
conservative. 199
Another uncertainty source associated with the OPSF technique is radiation-induced uncertainty. Yu et 200
al. showed that radiative losses affect the LBV of OPSFs by reducing the flame temperature and by inducing 201
an inward flow in the burned gas due to radiation cooling [42]. They proposed a fuel independent correlation 202
for the determination of the radiation-induced relative error on the LBV in such flames, which is a 203
decreasing function of the LBV and depends on Tu linearly. However, that correlation was only validated
204
numerically in the case of different hydrocarbon fuels and syngas, and it is unclear whether it is applicable 205
in our case, especially due to the absence of CO2 in the burned gas of NH3/H2/air flames. A recent numerical
206
study by Nakamura and Shindo [43] showed a significant impact of radiative heat losses on the LBV of 207
NH3/air flames using simulations of 1D freely propagating premixed flames with their own reaction
208
mechanism [44]. Under NTP conditions, the relative error increased away from stoichiometry and reached 209
about 13 % for = 0.8, 3 % for = 1.0 and about 8 % for = 1.4, corresponding to absolute errors of a few 210
millimeters per second. However, those results do not take into account the spherical geometry of the 211
presently studied flames and depend on the accuracy of the reaction mechanism that was used. Those 212
considerations are summarized in Figure 2 for NH3/air flames at NTP, which are the most radiation-affected
213
conditions due to very low LBVs. The simulation results of Nakamura and Shindo are plotted together with 214
similar simulations that we carried out in ChemkinPro [45] (see Sec. 2.5) with the absorption coefficients in 215
[43] and the detailed reaction mechanism of Otomo et al. [31], as well as results obtained by applying the 216
correlation of Yu et al. to present experimental data. Figure 2 highlights the dependence of the radiation-217
induced error on the LBV, and shows good agreement between the different estimates. Therefore, the 218
correlation of Yu et al. was used presently as the best estimate for the radiation-induced uncertainty, 219
, added only in the positive uncertainty , and decreasing with increasing LBV down to
220
less than 1% for fast flames. The same estimation method was recently used by Mei et al. [17]. 221
[Tapez ici] 222
Figure 2. Relative radiation-induced uncertainty on the LBV of NH3/air flames at NTP.
223 224
The repeatability of the tests is assessed by conducting a minimum number of three measurements for 225
each initial condition. The standard deviation proves the repeatability of the measurements and is used to 226
calculate the statistical error in the form of a 95% confidence interval by means of a Student’s t-distribution, 227 as in Eq. 5: 228
with , the value of the Student’s density function ( = 3.182 for = 3). The statistical error exceeds 229
10% in a small number of cases, generally under very lean or rich conditions, where the flame propagation is 230
mostly affected by perturbations. In general, this value is below 5% and down to 0.1%. 231
The experimental error terms are finally combined with the imaging error, the radiation error and the 232
statistical error obtained by repeating several identical measurements to calculate the overall uncertainty, 233 , given in Eq. 6: 234
Therefore, all the data are presented in the following figures with the average LBV values along with the 235
overall uncertainty, , meaning that the error bars can be assimilated to 95% confidence intervals. 236
All the uncertainties are reported in the Supplementary Material. 237
2.5. Numerical modelling
[Tapez ici]
LBV simulations were performed with Ansys ChemkinPro [45] by using three detailed kinetic mechanisms 239
for NH3/H2/air combustion [30,31,44]. Otomo’s model [31] was validated against experimental results
240
including LBVs obtained in various NH3/H2/Air mixture at ambient temperature and 0.1 MPa. Nakamura’s
241
model [44] was validated against NH3/air weak flames in micro flow reactor, including species profiles
242
measurements. Both mechanisms reveal the importance of intermediate species such as NH2, HNO and
243
N2Hx. The third one by Mathieu and Petersen [30] was mostly validated against ignition delay times and
244
was selected by Goldman and Dinkelacker [32] to fit their semi-empirical correlations. 245
The intercomparison between the experimental values and results from full kinetic computations was limited 246
to 2 cases, but in the entire range of equivalence ratio [0.8-1.4]. First, the unburned temperature is set to 247
473K, and is varied between 0 and 0.6. Second, the temperature varies in the entire range of the 248
experiments, but is fixed equal to 0.6. Those are the conditions of maximal discrepancy between the GD 249
correlations and the present experiments, as it will be seen in Sec. 3. 250
3. Results and discussion
251
This section presents the main experimental results and compares them to the LBV values estimated by 252
means of the detailed kinetic mechanisms in Sec. 2.5 and the GD correlation. The experimental corrective 253
factor defined in Section 1 is always applied in the GD correlations with the values given in [30], unless 254
otherwise stated. The extensive dataset obtained during the present study is available in the Supplementary 255
Material. 256
3.1. Effect of the equivalence ratio
257
Figure 3 shows a comparison of the present LBV measurements with experimental literature data and 258
the GD correlation for NH3/air flames under NTP. The very low LBVs result in a significant scatter in the
259
experimental data, due to technique-dependent uncertainties that are exacerbated by the instability 260
phenomena already described in Sec. 1 and Sec. 2.2 for the OPSF technique. While the data for 261
stoichiometric flames show a good general consistency across the studies, lean and rich flames exhibit 262
differences between the measurements up to more than 2 cm/s. While this discrepancy might seem 263
reasonable in other cases, it represents presently an error of more than 50%, due to the very low LBVs. 264
Present measurements are in the middle of the literature scatter, including very recent measurements with 265
[Tapez ici]
different techniques by Han et al. [22] and Mei et al. [17]. Error bars are asymmetric due to the positive-only 266
radiation-induced uncertainty, which is especially significant at low LBVs. 267
268
269
Figure 3. Laminar burning velocities of NH3/air flames under atmospheric conditions. Symbols:
270
experiments. Line: GD correlation at 0.1 MPa, 298 K [32]. 271
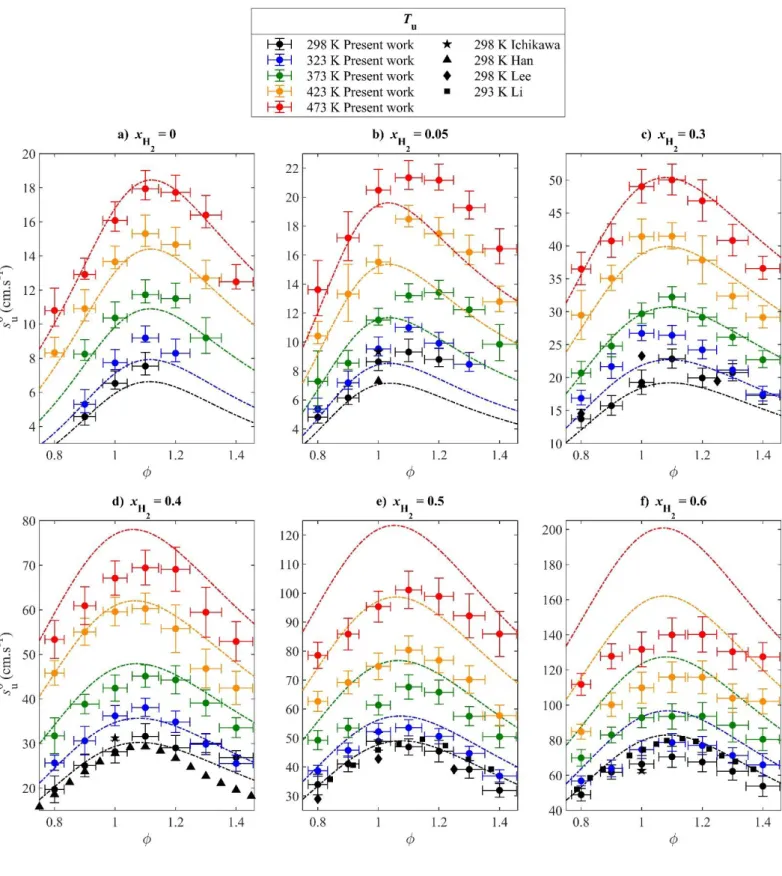
Figure 4 shows the variation of the measured LBV as a function of the equivalence ratio over the whole 272
temperature range for NH3/air and NH3/H2/air flames, along with experimental data from the literature close
273
to 298 K and 0.1 MPa and GD correlations values. For NH3/H2/air flames, present measurements at 298 K
274
are in reasonable agreement with the experimental literature data. For (Fig. 4b), good agreement 275
is found with Ichikawa et al. [21] at stoichiometry, while a small discrepancy is observed with Han et al. 276
[22]. For (Fig. 4c), the present measurements partially agree with those of Lee et al. [19] and a 277
very good agreement is found with Han et al. at stoichiometry. For (Fig. 4d), our values agree with 278
those of Han et al. for equivalence ratios between 0.8 and 1.2, and disagree for = 1.3 and 1.4, while a 279
slight mismatch is observed with a value of Ichikawa et al. at stoichiometry. For (Fig. 4e), very 280
good agreement is found with the data of Li et al. [20], except for = 1.4 and partial agreement is observed 281
[Tapez ici]
with the data of Lee and coworkers. For (Fig. 4f), present values agree with those of Li et al. only 282
below stoichiometry, and a good agreement is found at stoichiometry with Ichikawa and coworkers. Overall, 283
a comparative assessment of the uncertainties relative to LBV measurement using different methods would 284
be of interest in the case of NH3/H2/air flames, along with additional measurements with various techniques,
285
in order to evaluate the reliability of the global dataset. This is however beyond the scope of the present 286
work. 287
The measured LBVs present a classical bell shape as a function of the equivalence ratio, with a 288
maximum near = 1.1 for all temperatures and hydrogen fractions up to . However, for mixtures 289
with , the variation in the experimental LBV as varies becomes smaller around the maximum 290
due to the effect of hydrogen, resulting in a relatively “flatter” shape of the data distribution and a slight shift 291
of the maximum towards = 1.2, as illustrated in Fig. 4f. At Tu = 373 K for instance, this results in a
292
relative increase of about 30 % of the LBV between = 0.9 and = 1.1, and a decrease of 18% between 293
= 1.1 and = 1.3 for , while the relative increase and decrease reach only 13 % and 5 % 294
respectively for . 295
The NH3/air GD correlation reproduces well the shape of the LBV as a function of , even at elevated
296
temperatures, as shown in Fig. 4a. The shape is also relatively well reproduced by the NH3/H2/air GD
297
correlation for , as illustrated in Fig. 4c and 4d for = 0.3 and 0.4. Those are cases where 298
the effect of the equivalence ratio in the GD correlation was validated against literature measurements at 299
NTP conditions. In the cases for which limited experimental data were available or only data that do not 300
agree with the present results, the NH3/H2/air GD correlation fails to reproduce accurately the shape of the
301
present measurements. In particular for , Fig. 4b shows that the correlation underestimates the 302
LBVs for rich mixtures at all temperatures. The correlation values are not symmetric with respect to the 303
maximum LBV, which is underestimated itself both in its magnitude and equivalence ratio of occurrence as 304
compared to the experiments. Fig. 4f shows that when the estimated shape is symmetric, but does 305
not accurately reproduce the much “flatter” shape of the present experimental points, especially at higher 306
[Tapez ici]
temperatures. Thus, the availability of reliable experimental LBV data seems to be critical for the behavior 307
of the GD correlations with respect to the equivalence ratio, when the original correction factor is applied. 308
309
Figure 4. Laminar burning velocities of NH3/air and NH3/H2/air mixtures at Pu = 0.1 MPa.
310
Symbols: experiments; vertical error bars are 95% confidence intervals. Lines: GD correlation [32]. 311
3.2. Effects of hydrogen enrichment
[Tapez ici]
The influence of the fuel hydrogen fraction on the LBV is presented in Fig. 5 at NTP conditions. For the 313
sake of readability, only three equivalence ratios are depicted, along with corresponding LBV data from the 314
literature and GD correlation values. Note that the Bunsen burner study of Li et al. [20] did not always 315
provide data at the exact equivalence ratios that are depicted, so the closest values were plotted. The LBV 316
exhibits an exponential increasing trend with volumetric hydrogen addition in the fuel. Present LBV 317
measurements agree well with available literature data for a large majority of cases, as well as with GD 318
correlation values. However, significant discrepancies are noticed for and , as noted in 319
Sec. 3.1. In those conditions, the present data agree with the value of Ichikawa et al. [21], but disagree with 320
the data of Li et al. [20] and the correlation. The good agreement between the correlation and Li et al.'s data 321
is explainable by the high relative weight of that experimental dataset in the NH3/H2/air LBV literature at the
322
time of establishing the correlation. The latter was thus mainly fitted on that dataset, through the correction 323
factor . Therefore, the accuracy of the measurements at high hydrogen fractions in the fuel might be 324
questioned, with respect to the chosen experimental method. The OPSF method used by Ichikawa et al. and 325
the present authors yields closely agreeing values at = 1.0. Under NTP conditions, the GD correlation 326
slightly underestimates present LBVs when and , agrees well with all 327
measurements for , and significantly overestimates LBVs for and . The 328
data of Lee et al. [19] show slight discrepancies with the other data and the correlation but remain in the 329
trend. However, the data of Kumar et al. [23] are off the trend and will thus be left aside in the 330
considerations of Sec. 3.4, as it was originally the case when the GD correlation was developed in [32]. 331
[Tapez ici] 332
Figure 5. Laminar burning velocities of NH3/H2/air mixtures at Tu = 298 K and Pu = 0.1 MPa. Symbols:
333
experiments; vertical error bars are 95% confidence intervals. Lines: GD correlation [32]. 334
The behavior of the GD correlation with respect to the hydrogen fraction is confirmed by LBV 335
measurements at higher temperatures, as shown in Figure 6 in the case , where the maximum LBV 336
value is reached in most conditions. The measured and estimated values both exhibit exponential increasing 337
trends as a function of the fuel hydrogen fraction for all temperatures, but with different slopes when 338
depicted in a logarithmic scale. A general underestimate of the present data by the GD correlation is 339
observed for low hydrogen fractions, while the LBVs at high hydrogen fractions are largely overestimated. 340
However, the correlation is in close agreement with data of Han et al. [22] up to 40% H2 at Tu = 298 K.
341
It should be noted that only the correlation for NH3/H2/air mixtures was plotted here. The NH3/air
342
correlation agrees much better with experimental values for , as previously seen in Fig. 4a. So, a 343
lack of continuity is observed between the NH3/H2/air and NH3/air correlations when the hydrogen fraction
344
becomes very small. Again, this is likely a consequence of the limited availability of accurate measurement 345
data for correlation fitting at the time it was established. Since most of the previously available data were 346
within the range , the best correlation prediction is found here. It should be noted here that 347
the mechanism by Mathieu and Petersen [30], used also to establish the correlation, is found to 348
underestimate, respectively overestimate, the LBV of mixtures with low, respectively high hydrogen content 349
[32]. 350
[Tapez ici] 351
Figure 6. Laminar burning velocities of NH3/H2/air mixtures at Pu = 0.1 MPa and = 1.1. Filled symbols:
352
present measurements. Hollow triangles: measurements of Han et al. [22]. Lines: GD correlation [32]. 353
This is partly confirmed by Figure 7 that shows the evolution of the LBV with at 473 K. Present 354
measurements are compared with GD correlation values and simulations results using the detailed kinetic 355
mechanisms introduced in Sec. 2.5. In such conditions, the mechanism of Mathieu and Petersen 356
underestimates the experimental LBVs when = 0.8, when = 1.0 and and when = 1.2 and 357
. The mechanism of Otomo et al. is found to slightly underestimate the LBV in most cases, 358
especially for intermediate hydrogen fuel fractions. The mechanism of Nakamura et al. shows the best 359
overall agreement with the present data at elevated temperature as a function of the hydrogen fuel fraction. 360
The GD correlation estimates diverge significantly from both the experimental and kinetic modelling trends 361
when increases, even though it is based on the Mathieu and Petersen mechanism. This is probably a 362
consequence of the scarcity and accuracy of the available experimental dataset at high hydrogen fractions 363
used to fit the correlation in the first place, through the correction factor that is applied here. The behavior 364
of the correlation without applying is much closer to the Mathieu and Petersen’s mechanism (no plotted 365
here for readability), and yields thus accurate estimates for . 366
[Tapez ici] 367
Figure 7. Laminar burning velocities of NH3/H2/air mixtures at Pu = 0.1 MPa and Tu = 473 K. Symbols:
368
experiments. Lines: numerical models. 369
3.3. Effects of the temperature increase
370
Increasing the unburned gas temperature leads to an increase in the LBV and allows a more stable flame 371
propagation in most cases. The respective influences of the equivalence ratio and hydrogen fraction on the 372
LBV remain qualitatively unchanged when the temperature is increased: the experimental data distributions 373
keep similar bell shapes in Fig. 4 and the slopes of the different distributions remain approximately parallel 374
in Fig. 6 with increasing temperature. 375
The influence of the unburned gas temperature on the LBV is well estimated by the NH3/air GD correlation
376
(Fig. 4a), as well as by the NH3/H2/air GD correlation when for lean mixtures (Fig. 4b) and
377
when (Figs. 4c and 4d). In order to isolate the temperature effect, the values of the 378
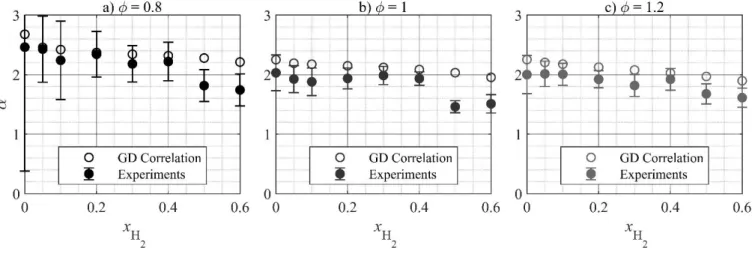
temperature exponent, , assuming an exponential temperature dependence of the LBV as in Eq. 1 are 379
depicted in Figure 8 as a function of the H2 fraction. The experimental values of , as well as the associated
380
uncertainties were estimated by means of a Monte Carlo method to allow for the propagation of the 381
uncertainties on the LBV measurements as described in Sec. 2.4. For each test point and each iteration, is 382
determined as the slope of by means of a least-squares linear regression, where is 383
randomly chosen from a normal PDF with the average measured LBV as mean value and the global positive 384
LBV uncertainty as standard deviation. The mean value and standard deviation of the resulting -385
[Tapez ici]
distribution are taken as the best guess and uncertainty for . Results show satisfactory agreement with the 386
values given by the GD correlations, as a function of both the equivalence ratio and the hydrogen fraction, 387
indicating the ability of the correlation to accurately estimate the temperature effect in most cases. However, 388
no agreement is found between the experimental and estimated temperature behavior when the fuel contains 389
50% H2 or more.
390
391
Figure 8. Temperature dependence of the LBV. : temperature exponent as in Eq. 1.
392
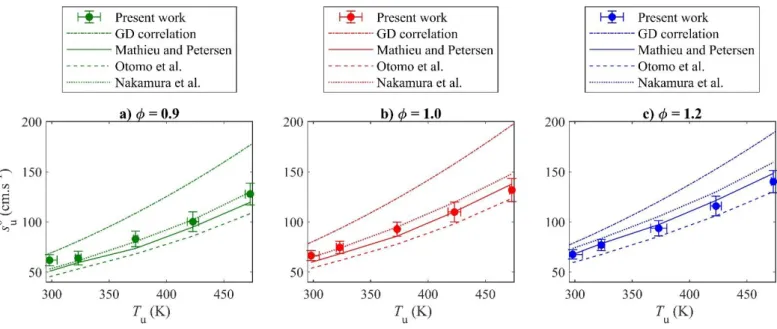
This is emphasized in Figure 9, where the experimental LBVs are shown as a function of the initial gas 393
temperature along with the GD correlation and results from kinetic simulations for = 0.6. Again, the 394
estimations by the GD correlation diverge away from the experimental trend and the kinetic model 395
estimations, in particular those obtained with Mathieu and Petersen’s mechanism for the same reasons 396
mentioned in Sec. 3.2. While the different kinetic reaction mechanisms tested here show similar trends with 397
respect to the temperature effect on the LBV, their estimations remain scattered and do not completely agree 398
with the present measurements. While the mechanism of Otomo et al. generally underestimates the LBVs 399
(as emphasized in the Supplementary Material), the mechanisms of Mathieu and Petersen agrees well, while 400
the one of Nakamura et al. slightly overestimates the experimental data for rich mixtures. It should be 401
remembered here that the error bars shown in Fig. 9 are considered to be conservative due to the use of the 402
GD correlation to estimate the uncertainty caused by the mixture composition error as explained in Sec. 2.4. 403
[Tapez ici] 404
Figure 9. Comparison of the predictive capabilities of various models with respect to the temperature effect
405
on the LBV for Pu = 0.1 MPa and = 0.6.
406
3.4. Correlation optimization
407
In an attempt to optimize the correlations proposed by Goldmann and Dinkelacker [32], the new 408
experimental dataset was used to adjust the coefficient correlations for Pu ≤ 0.5 MPa and Tu ≤ 700 K. To that
409
end, the present LBV experimental dataset was consolidated with the literature data [10,11,20–22,12–19] 410
and used to fit the correction factor by means of a least-squares algorithm. The form of the correction 411
factor was extended by introducing two new coefficients and to take into account the temperature 412
dependence, analogously to the pressure dependence: . In each case, the 413
accuracy of the obtained correlation is assessed by the mean absolute percentage error , the maximum 414
absolute percentage error , the minimum absolute percentage error and the coefficient of 415
determination over the considered dataset of size N, as in [32]. Different comparisons were conducted 416
and are summarized for the NH3/air and NH3/H2/air correlations in Table 2 and Table 3, respectively.
417
Unsurprisingly, the GD correlation compares well with the consolidated experimental dataset for 418
NH3/air mixtures as seen in Table 2, since a satisfactory agreement was found with the new experimental
419
data at elevated temperatures in Sec. 3.1 and 3.3. The extended correlation with the new coefficients of 420
[Tapez ici]
Table 4 presents a slightly worsened mean absolute percentage error but a better coefficient of determination 421
than the GD correlation. 422
Table 2. Accuracy of the NH3/air correlation against experiments for Pu ≤ 0.5 MPa.
423
424
However, Table 3 shows that the new consolidated dataset does not compare well with the GD 425
correlation for NH3/H2/air mixtures, since increases from 8.26 % to 11.56 % and R² drops from 0.977 to
426
0.867. This was expected following the discrepancies observed in Sec. 3.1, 3.2 and 3.3 between the GD 427
correlation and the present experimental values, especially at high hydrogen fractions. For this reason, a 428
comparison between the GD correlation and the experimental dataset for was attempted. The 429
original correlation proved to be slightly more accurate in that case, though not reaching the accuracy shown 430
against the former experimental dataset. Thus, the present attempts to fit the new correlation on the new 431
consolidated dataset resulted in a poorer accuracy when considering the entire H2 range. Considering that the
432
original correlation behaves differently for small and large hydrogen fractions, it was decided to apply the 433
optimization only in the range , leading to an improvement in accuracy of the correlation 434
against the consolidated dataset, as seen in Table 3. 435
Table 3. Accuracy of the NH3/H2/air correlation against experiments for Pu ≤ 0.5 MPa.
436
Comparison Tu (%) (%) (%) N
GD vs. previous literature data ≤ 300 K 0.28 15.0 47.06 0.795 82
GD vs. consolidated data ≤ 473 K 0.08 12.04 47.06 0.948 122
New coefficients vs. consolidated data ≤ 473 K 0.13 13.05 58.41 0.9664 122
Comparison Tu
(%)
(%) (%) N
GD vs. previous literature data ]0 – 0.6] ≤ 300 K 0.05 8.26 36.55 0.977 93 GD vs. consolidated data ]0 – 0.6] ≤ 473 K 0.03 11.56 49.15 0.867 418 GD vs. consolidated data ]0 – 0.4] ≤ 473 K 0.03 10.31 41.72 0.963 295
[Tapez ici] 437
The corresponding coefficients in Table 4 can be used for the correction factor in LBV calculations in 438
the range , all other coefficients in the GD correlations remaining unchanged compared to 439
[32]. However, the new correlation estimates the consolidated dataset less accurately than the original GD 440
correlation estimates the original dataset. Ultimately, a better understanding of the role of NH3 and H2
441
reactions in the detailed kinetic mechanisms should help in better predicting the laminar burning velocity, 442
especially for mixtures containing very low or very high hydrogen fractions. Refined mechanisms could 443
then be used to establish more reliable correlations for reduced computational intensity. 444
Table 4. New coefficients for the empirical correction factor with temperature dependence.
445 Case k1 k2 k3 k4 k5 k6 NH3/air 1.9112 1.0019 -0.0444 0.3526 0.7444 -0.1078 NH3/H2/air = ]0 – 0.4] 2.0873 1.0081 -0.1559 0.5383 0.7357 -0.0702 446
4. Summary and conclusions
447
An extensive new experimental dataset of ammonia/air and ammonia/hydrogen/air laminar burning 448
velocities was obtained at atmospheric pressure for equivalence ratios ranging from 0.8 to 1.4, hydrogen 449
fractions in the fuel from 0 % to 60 % and unburned gas temperatures from 298 to 473 K by means of the 450
outwardly propagating spherical flame method. Experimental hardware, imaging, radiation-induced and 451
statistical errors were taken into account. Results are in good agreement with previous measurements from 452
the literature obtained with the same method and the heat flux method under NTP, but discrepancies are 453
observed with measurements obtained with the Bunsen burner method for high hydrogen fractions. More 454
than 260 new data points are presented, that significantly enrich the literature data, especially at high 455
temperatures and hydrogen fuel fractions. 456
[Tapez ici]
A comparison of the present measurements with the LBV correlations recently developed by Goldmann 457
and Dinkelacker, as well as with chemical kinetic simulations using state-of-the-art reaction mechanisms, 458
led to the following summary: 459
1. The original NH3/air correlation agrees well with the present experimental data for all
460
temperatures, thus validating its ability to accurately approximate the LBV of mixtures at 461
higher temperatures. 462
2. The original NH3/H2/air correlation underestimates the LBV of rich mixtures with low
463
hydrogen fractions, while it generally overestimates the LBV of mixtures with high hydrogen 464
fractions, especially at elevated temperature and regardless of the equivalence ratio. The LBV 465
of mixtures with intermediate hydrogen fractions are estimated satisfactorily in most cases. This 466
is explained by the better accuracy and availability of experimental data in that range at the time 467
the correlation was first developed. 468
3. The influence of the temperature is reproduced satisfactorily by the NH3/H2/air correlation,
469
except for mixtures with , where the influence of the temperature is again 470
overestimated. 471
4. Current reaction mechanisms show satisfactory agreement with the present experimental data 472
over the whole range of investigation, but a significant scatter remains between them. 473
5. An attempt to optimize the correlations by fitting them on the new consolidated experimental 474
dataset through an experimental correction factor was successful for a limited set of conditions 475
only. 476
As a result, while the detailed kinetic mechanisms may still require some fine tuning to improve their 477
accuracy, the development of new LBV correlations for NH3/H2 fuels requires careful validation based on
478
fully validated reaction mechanisms and accurate experimental data. However, the present optimization 479
proposed for the GD correlations should allow to conduct turbulent combustion simulations with satisfactory 480
accuracy and low computational cost for hydrogen fractions in the fuel smaller than 50%. 481
Acknowledgements
[Tapez ici]
The research leading to these results has received funding from the French Government’s “Investissement 483
d’Avenir” program: “Laboratoire d’Excellence CAPRYSSES” (Grant No ANR-11- LABX-0006-01). 484
References
485
[1] UNFCCC. Paris Agreement. Paris: 2015. 486
[2] Rogelj J, Shindell D, Jiang K, Fifita S, Forster P, Ginzburg V, et al. Mitigation pathways compatible 487
with 1.5°C in the context of sustainable development. IPCC Spec Rep 2018:93–174. 488
[3] Tatin A, Bonin J, Robert M. A Case for Electrofuels. ACS Energy Lett 2016:1062–4. 489
doi:10.1021/acsenergylett.6b00510. 490
[4] Zamfirescu C, Dincer I. Using ammonia as a sustainable fuel. J Power Sources 2008;185:459–65. 491
doi:10.1016/j.jpowsour.2008.02.097. 492
[5] Giddey S, Badwal SPS, Munnings C, Dolan M. Ammonia as a Renewable Energy Transportation 493
Media. ACS Sustain Chem Eng 2017;5:10231–9. doi:10.1021/acssuschemeng.7b02219. 494
[6] Cheema II, Krewer U. Operating envelope of Haber–Bosch process design for power-to-ammonia. 495
RSC Adv 2018;8:34926–36. doi:10.1039/C8RA06821F. 496
[7] Grinberg Dana A, Elishav O, Bardow A, Shter GE, Grader GS. Nitrogen-Based Fuels: A Power-to-497
Fuel-to-Power Analysis. Angew Chemie - Int Ed 2016;55:8798–805. doi:10.1002/anie.201510618. 498
[8] Valera-Medina A, Xiao H, Owen-Jones M, David WIF, Bowen PJ. Ammonia for power. Prog Energy 499
Combust Sci 2018;69:63–102. doi:10.1016/j.pecs.2018.07.001. 500
[9] Kobayashi H, Hayakawa A, Somarathne KDKA, Okafor EC. Science and technology of ammonia 501
combustion. Proc Combust Inst 2019;37:109–33. doi:10.1016/j.proci.2018.09.029. 502
[10] Zakaznov VF, Kursheva LA, Fedina ZI. Determination of normal flame velocity and critical diameter 503
of flame extinction in ammonia-air mixture. Combust Explos Shock Waves 1978;14:710–3. 504
doi:10.1007/BF00786097. 505
[11] Ronney PD. Effect of Chemistry and Transport Properties on Near-Limit Flames at Microgravity. 506
Combust Sci Technol 1988;59:123–41. doi:10.1080/00102208808947092. 507
[12] Pfahl UJ, Ross MC, Shepherd JE, Pasamehmetoglu KO, Unal C. Flammability limits, ignition energy, 508
and flame speeds in H2-CH4-NH3-N2O-O2-N2 mixtures. Combust Flame 2000;123:140–58. 509
[Tapez ici]
doi:10.1016/S0010-2180(00)00152-8. 510
[13] Jabbour T, Clodic DF. Burning Velocity and Refrigerant Flammability Classification. Trans - Am Soc 511
Heat Refrig Air Cond Eng 2004;110:522–33. 512
[14] Takizawa K, Takahashi A, Tokuhashi K, Kondo S, Sekiya A. Burning velocity measurements of 513
nitrogen-containing compounds. J Hazard Mater 2008;155:144–52. 514
doi:10.1016/j.jhazmat.2007.11.089. 515
[15] Hayakawa A, Goto T, Mimoto R, Arakawa Y, Kudo T, Kobayashi H. Laminar burning velocity and 516
Markstein length of ammonia/air premixed flames at various pressures. Fuel 2015;159:98–106. 517
doi:10.1016/j.fuel.2015.06.070. 518
[16] Davis SG, Pagliaro JL, Debold TF, van Wingerden M, van Wingerden K. Flammability and explosion 519
characteristics of mildly flammable refrigerants. J Loss Prev Process Ind 2017;49:662–74. 520
doi:10.1016/j.jlp.2017.05.019. 521
[17] Mei B, Zhang X, Ma S, Cui M, Guo H, Cao Z, et al. Experimental and kinetic modeling investigation 522
on the laminar flame propagation of ammonia under oxygen enrichment and elevated pressure 523
conditions. Combust Flame 2019;210:236–46. doi:10.1016/j.combustflame.2019.08.033. 524
[18] Lee JH, Lee SI, Kwon OC. Effects of ammonia substitution on hydrogen/air flame propagation and 525
emissions. Int J Hydrogen Energy 2010;35:11332–41. doi:10.1016/j.ijhydene.2010.07.104. 526
[19] Lee JH, Kim JH, Park JH, Kwon OC. Studies on properties of laminar premixed hydrogen-added 527
ammonia/air flames for hydrogen production. Int J Hydrogen Energy 2010;35:1054–64. 528
doi:10.1016/j.ijhydene.2009.11.071. 529
[20] Li J, Huang H, Kobayashi N, He Z, Nagai Y. Study on using hydrogen and ammonia as fuels: 530
Combustion characteristics and NOx formation. Int J Energy Res 2014;38:1214–23. 531
doi:10.1002/er.3141. 532
[21] Ichikawa A, Hayakawa A, Kitagawa Y, Kunkuma Amila Somarathne KDD, Kudo T, Kobayashi H. 533
Laminar burning velocity and Markstein length of ammonia/hydrogen/air premixed flames at elevated 534
pressures. Int J Hydrogen Energy 2015;40:9570–8. doi:10.1016/j.ijhydene.2015.04.024. 535
[22] Han X, Wang Z, Costa M, Sun Z, He Y, Cen K. Experimental and kinetic modeling study of laminar 536
[Tapez ici]
burning velocities of NH3/air, NH3/H2/air, NH3/CO/air and NH3/CH4/air premixed flames. 537
Combust Flame 2019;206:214–26. doi:10.1016/j.combustflame.2019.05.003. 538
[23] Kumar P, Meyer TR. Experimental and modeling study of chemical-kinetics mechanisms for H2-539
NH3-air mixtures in laminar premixed jet flames. Fuel 2013;108:166–76. 540
doi:10.1016/j.fuel.2012.06.103. 541
[24] Miller JA, Smooke MD, Green RM, Kee RJ. Kinetic Modeling of the Oxidation of Ammonia in 542
Flames. Combust Sci Technol 1983;34:149–76. doi:10.1080/00102208308923691. 543
[25] Lindstedt RP, Lockwood FC, Selim MA. Detailed kinetic modelling of chemistry and temperature 544
effects on ammonia oxidation. Combust Sci Technol 1994;99:253–76. 545
doi:10.1080/00102209408935436. 546
[26] Tian Z, Li Y, Zhang L, Glarborg P, Qi F. An experimental and kinetic modeling study of premixed 547
NH3/CH4/O2/Ar flames at low pressure. Combust Flame 2009;156:1413–26. 548
doi:10.1016/j.combustflame.2009.03.005. 549
[27] Konnov AA. Implementation of the NCN pathway of prompt-NO formation in the detailed reaction 550
mechanism. Combust Flame 2009;156:2093–105. doi:10.1016/j.combustflame.2009.03.016. 551
[28] Okafor EC, Naito Y, Colson S, Ichikawa A, Kudo T, Hayakawa A, et al. Experimental and numerical 552
study of the laminar burning velocity of CH4–NH3–air premixed flames. Combust Flame 553
2018;187:185–98. doi:10.1016/j.combustflame.2017.09.002. 554
[29] Cavaliere R, Costa M, Bai XS, da Rocha RC, Costa M, Bai XS, et al. Chemical kinetic modelling of 555
ammonia/hydrogen/air ignition, premixed flame propagation and NO emission. Fuel 2019;246:24–33. 556
doi:10.1016/j.fuel.2019.02.102. 557
[30] Mathieu O, Petersen EL. Experimental and modeling study on the high-temperature oxidation of 558
Ammonia and related NOx chemistry. Combust Flame 2015;162:554–70. 559
doi:10.1016/j.combustflame.2014.08.022. 560
[31] Otomo J, Koshi M, Mitsumori T, Iwasaki H, Yamada K. Chemical kinetic modeling of ammonia 561
oxidation with improved reaction mechanism for ammonia/air and ammonia/hydrogen/air 562
combustion. Int J Hydrogen Energy 2018;43:3004–14. doi:10.1016/j.ijhydene.2017.12.066. 563
[Tapez ici]
[32] Goldmann A, Dinkelacker F. Approximation of laminar flame characteristics on premixed 564
ammonia/hydrogen/nitrogen/air mixtures at elevated temperatures and pressures. Fuel 2018;224:366– 565
78. doi:10.1016/j.fuel.2018.03.030. 566
[33] Metghalchi M, Keck JC. Burning velocities of mixtures of air with methanol, isooctane, and indolene 567
at high pressure and temperature. Combust Flame 1982;48:191–210. doi:10.1016/0010-568
2180(82)90127-4. 569
[34] Galmiche B, Halter F, Foucher F. Effects of high pressure, high temperature and dilution on laminar 570
burning velocities and Markstein lengths of iso-octane/air mixtures. Combust Flame 2012;159:3286– 571
99. doi:10.1016/j.combustflame.2012.06.008. 572
[35] Brequigny P, Endouard C, Mounaïm-Rousselle C, Foucher F. An experimental study on turbulent 573
premixed expanding flames using simultaneously Schlieren and tomography techniques. Exp Therm 574
Fluid Sci 2018;95:11–7. doi:10.1016/j.expthermflusci.2017.12.018. 575
[36] Huo J, Yang S, Ren Z, Zhu D, Law CK. Uncertainty reduction in laminar flame speed extrapolation 576
for expanding spherical flames. Combust Flame 2018;189:155–62. 577
doi:10.1016/j.combustflame.2017.10.032. 578
[37] Kelley AP, Law CK. Nonlinear effects in the extraction of laminar flame speeds from expanding 579
spherical flames. Combust Flame 2009;156:1844–51. doi:10.1016/j.combustflame.2009.04.004. 580
[38] Ronney PD, Sivashinsky GI. A Theoretical Study of Propagation and Extinction of Nonsteady 581
Spherical Flame Fronts. SIAM J Appl Math 1989;49:1029–46. doi:https://doi.org/10.1137/0149062. 582
[39] Halter F, Tahtouh T, Mounaïm-Rousselle C. Nonlinear effects of stretch on the flame front 583
propagation. Combust Flame 2010;157:1825–32. doi:10.1016/j.combustflame.2010.05.013. 584
[40] Moffat RJ. Describing the uncertainties in experimental results. Exp Therm Fluid Sci 1988;1:3–17. 585
doi:10.1016/0894-1777(88)90043-X. 586
[41] Brequigny P, Uesaka H, Sliti Z, Segawa D, Foucher F, Dayma G, et al. Uncertainty in measuring 587
laminar burning velocity from expanding methane-air flames at low pressures. 11th Mediterr. 588
Combust. Symp., Tenerife, Spain: 2019. 589
[42] Yu H, Han W, Santner J, Gou X, Sohn CH, Ju Y, et al. Radiation-induced uncertainty in laminar 590
[Tapez ici]
flame speed measured from propagating spherical flames. Combust Flame 2014;161:2815–24. 591
doi:10.1016/j.combustflame.2014.05.012. 592
[43] Nakamura H, Shindo M. Effects of radiation heat loss on laminar premixed ammonia/air flames. Proc 593
Combust Inst 2019;37:1741–8. doi:10.1016/j.proci.2018.06.138. 594
[44] Nakamura H, Hasegawa S, Tezuka T. Kinetic modeling of ammonia/air weak flames in a micro flow 595
reactor with a controlled temperature profile. Combust Flame 2017;185:16–27. 596 doi:10.1016/j.combustflame.2017.06.021. 597 [45] ANSYS Chemkin-Pro 2019. 598 599