Supporting information for
Red-light activated photoCORMs of Mn(I) species bearing electron
deficient 2,2'-azopyridines.
E. Kottelat,
aA. Ruggi*
aand F. Zobi*
aDépartement de Chimie, Université de Fribourg, Chemin du Musée 9, CH-1700 Fribourg.
Email:
albert.ruggi@unifr.ch
,
fabio.zobi@unifr.ch
.
S1. NMR spectra of ligands and complexes (2-11).
S2. Crystallographic details (12-16)
S3 MLCT- σ Hammet parameter correlation of complexes 1-5 (17)
S4. Results of DFT calculations (18)
S1. NMR spectra of ligands and complexes
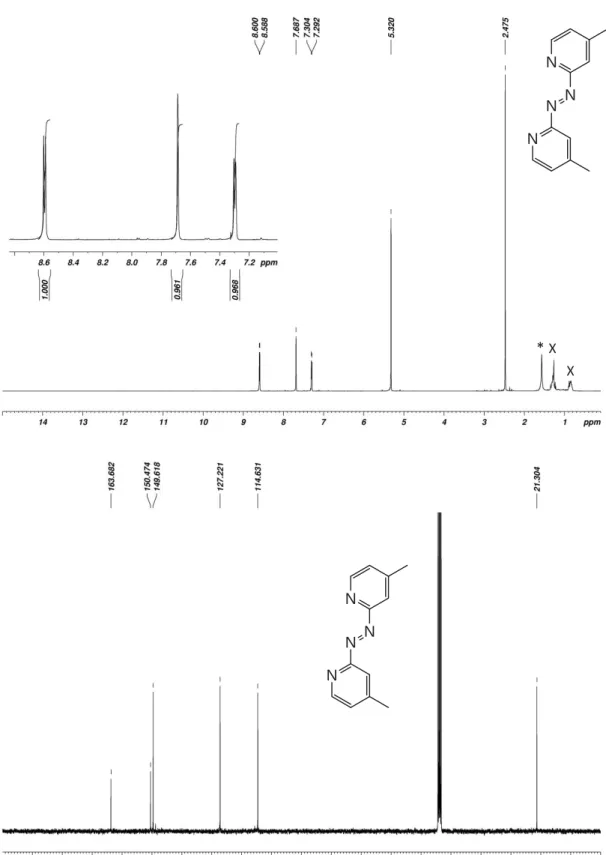
Figure S1. 1H- (top) and 13C-NMR spectra of 1,2-bis(4-methylpyridin-2-yl)diazene (Azpy_Me) in
CD2Cl2. Asterisk (*) indicates traces of water and (x) grease.
N N N N N N N N *X X
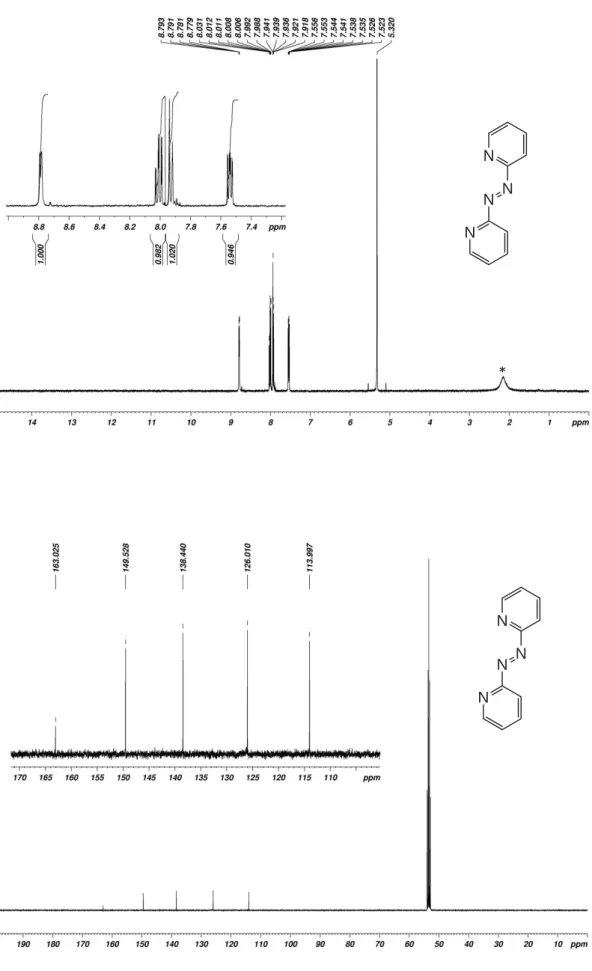
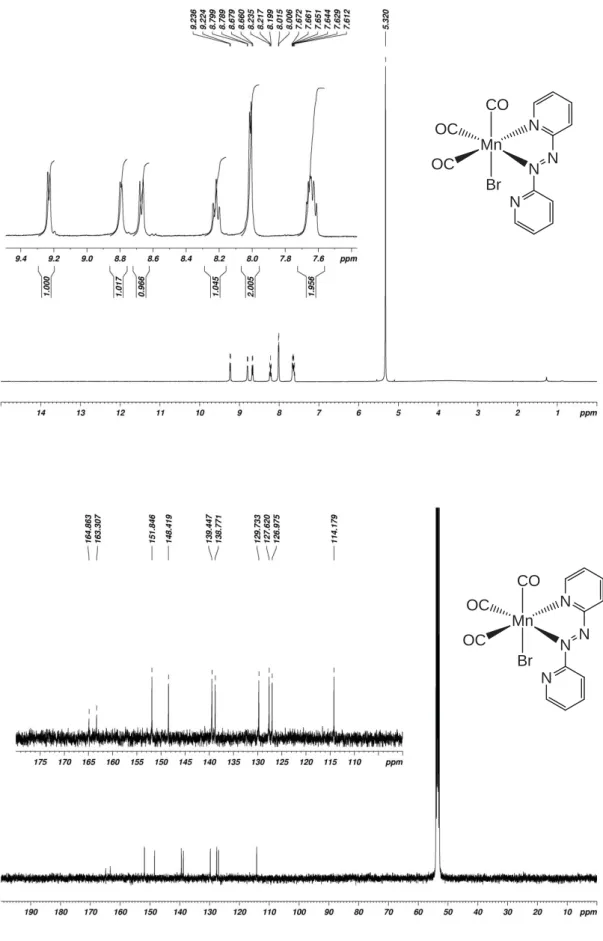
Figure S2. 1H- (top) and 13C-NMR spectra of 1,2-di(pyridin-2-yl)diazene (Azpy_H) in CD
2Cl2. Asterisk
(*) indicates traces of water.
N N N N N N N N *
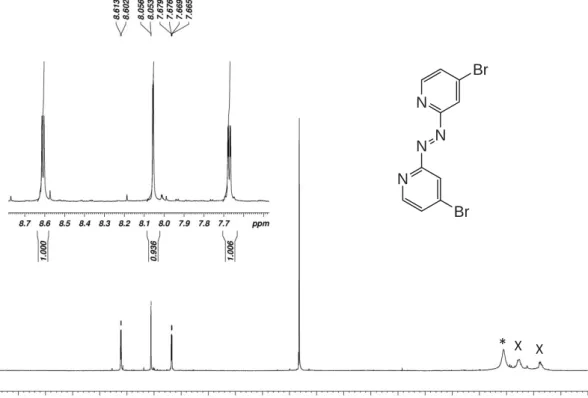
Figure S3. 1H- (top) and 13C-NMR spectra of 1,2-bis(4-bromopyridin-2-yl)diazene (Azpy_Br) in CD 2Cl2.
Asterisk (*) indicates traces of water and (x) grease.
N N N N Br Br N N N N Br Br * X X
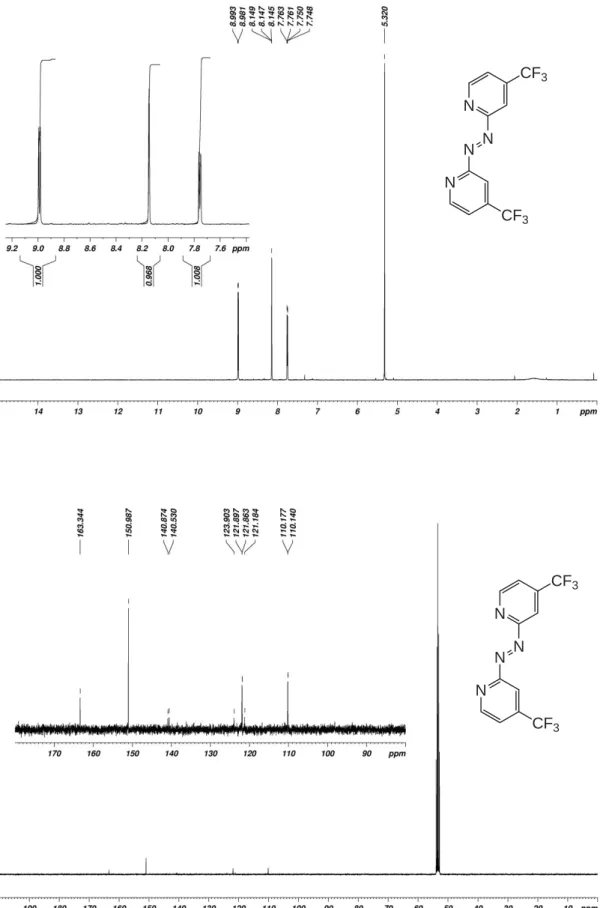
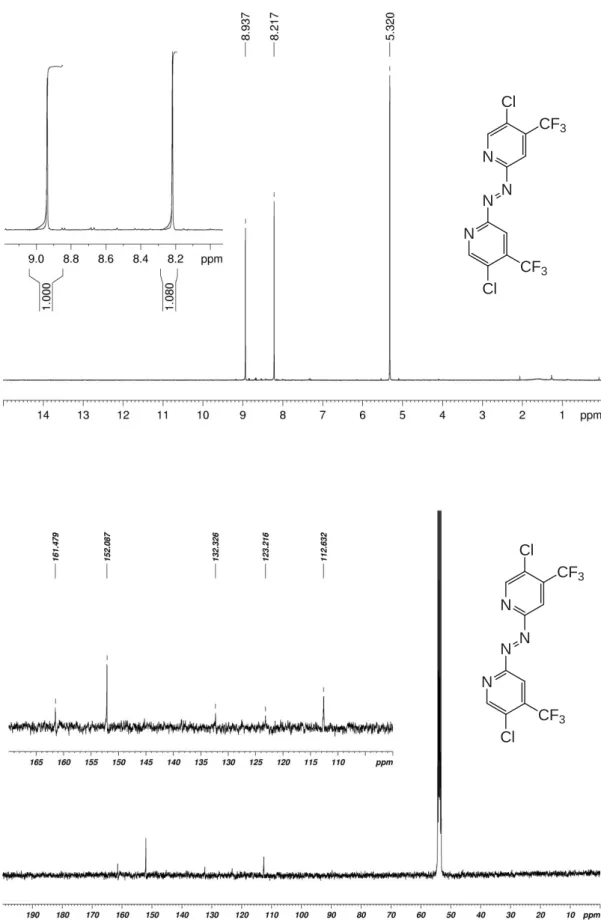
Figure S4. 1H- (top) and 13C-NMR spectra of 1,2-bis(4-(trifluoromethyl)pyridin-2-yl)diazene (Azpy_CF 3) in CD2Cl2. N N N N CF3 CF3 N N N N CF3 CF3
Figure S5. 1H- (top) and 13C-NMR spectra of 1,2-bis(5-chloro-4-(trifluoromethyl)pyridin-2-yl)diazene (Azpy_CF3Cl) in CD2Cl2. N N N N CF3 Cl CF3 Cl N N N N CF3 Cl CF3 Cl
Mn OC OC CO Br N N N N CH3 CH3
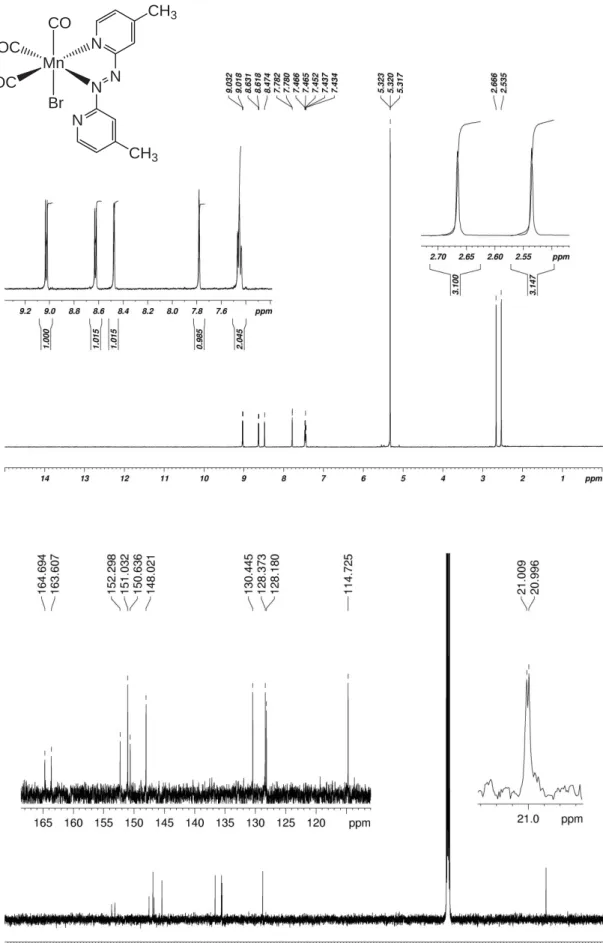
Figure S6. 1H- (top) and 13C-NMR spectra of complex 1 in CD 2Cl2.
Figure S7. 1H- (top) and 13C-NMR spectra of complex 2 in CD 2Cl2. Mn OC OC CO Br N N N N Mn OC OC CO Br N N N N
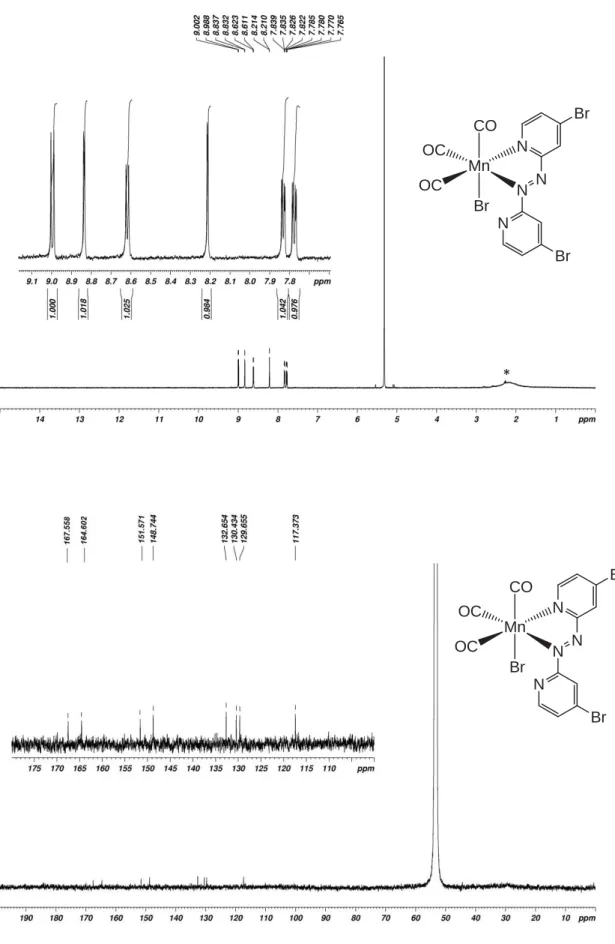
Figure S8. 1H- (top) and 13C-NMR spectra of complex 3 in CD
2Cl2. Asterisk (*) indicates traces of water. Mn OC OC CO Br N N N N Br Br * Mn OC OC CO Br N N N N Br Br
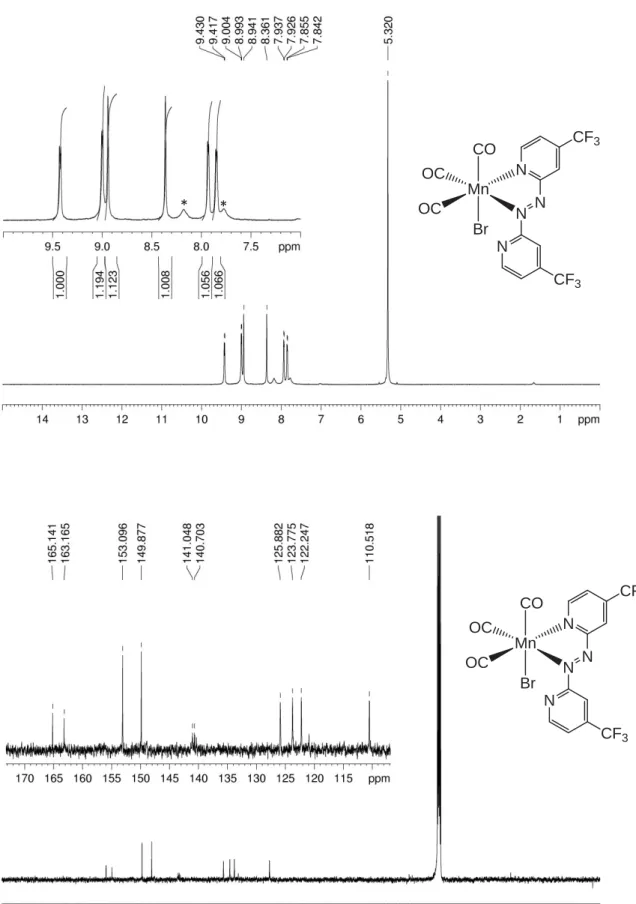
Figure S9. 1H- (top) and 13C-NMR spectra of complex 4 in CD
2Cl2. Asterisks (*) indicate paramagnetic
decomposition product. Mn OC OC CO Br N N N N CF3 CF3 Mn OC OC CO Br N N N N CF3 CF3 * *
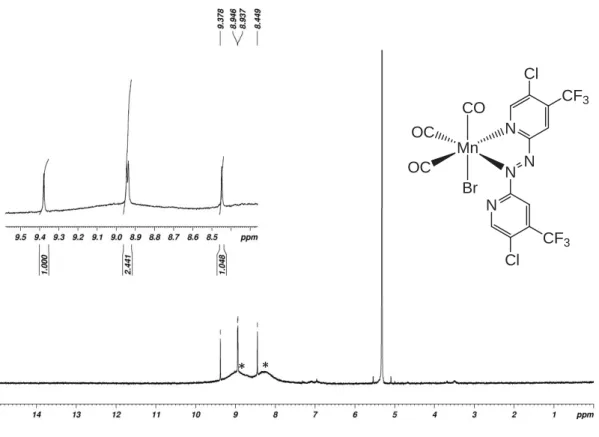
Figure S10. 1H-NMR spectrum of complex 5 in CD
2Cl2. Asterisks (*) indicate paramagnetic
decomposition product. Mn OC OC CO Br N N N N CF3 Cl CF3 Cl * *
S2. Crystallographic details
Table S1. Crystal data and structure refinement for 1,2-bis(4-(trifluoromethyl)pyridin-2-yl)diazene
(Azpy_CF3).
Identification code shelx
Empirical formula C12 H6 F6 N4
Formula weight 320.21
Temperature 200(2) K
Wavelength 0.71073 Å
Crystal system Triclinic
Space group P -1
Unit cell dimensions a = 4.6634(4) Å α= 113.797(8)°.
b = 11.6504(12) Å β= 93.861(8)°. c = 13.1188(14) Å γ = 100.985(8)°. Volume 631.90(12) Å3 Z 2 Density (calculated) 1.683 Mg/m3 Absorption coefficient 0.167 mm-1 F(000) 320 Crystal size 0.200 x 0.100 x 0.020 mm3
Theta range for data collection 1.719 to 24.989°.
Index ranges -5<=h<=5, -13<=k<=13, -15<=l<=15
Reflections collected 8137
Independent reflections 2095 [R(int) = 0.0982]
Completeness to theta = 24.989° 94.1 %
Refinement method Full-matrix least-squares on F2
Data / restraints / parameters 2095 / 0 / 199
Goodness-of-fit on F2 0.779
Final R indices [I>2sigma(I)] R1 = 0.0463, wR2 = 0.0864
R indices (all data) R1 = 0.1351, wR2 = 0.1029
Extinction coefficient n/a
Table S2. Crystal data and structure refinement for
1,2-bis(5-chloro-4-(trifluoromethyl)pyridin-2-yl)diazene (Azpy_CF3Cl).
Identification code shelx
Empirical formula C12 H4 Cl2 F6 N4
Formula weight 389.09
Temperature 200(2) K
Wavelength 0.71073 Å
Crystal system Triclinic
Space group P -1
Unit cell dimensions a = 4.7813(5) Å α= 75.795(8)°.
b = 6.6169(7) Å β= 86.893(8)°. c = 11.6910(12) Å γ = 88.052(8)°. Volume 357.95(7) Å3 Z 1 Density (calculated) 1.805 Mg/m3 Absorption coefficient 0.526 mm-1 F(000) 192 Crystal size 0.670 x 0.050 x 0.050 mm3
Theta range for data collection 1.799 to 24.993°.
Index ranges -5<=h<=5, -7<=k<=7, -13<=l<=13
Reflections collected 4600
Independent reflections 1265 [R(int) = 0.1694]
Completeness to theta = 24.993° 99.8 %
Refinement method Full-matrix least-squares on F2
Data / restraints / parameters 1265 / 0 / 109
Goodness-of-fit on F2 1.046
Final R indices [I>2sigma(I)] R1 = 0.0349, wR2 = 0.0782
R indices (all data) R1 = 0.0397, wR2 = 0.0810
Extinction coefficient n/a
Table S3. Crystal data and structure refinement for 1,2-bis(4-bromopyridin-2-yl)diazene (Azpy_Br).
Identification code EK210
Empirical formula C10 H6 Br2 N4
Formula weight 342.01
Temperature 300(2) K
Wavelength 0.71073 Å
Crystal system Monoclinic
Space group P 21/n
Unit cell dimensions a = 3.9747(3) Å α= 90°.
b = 9.2426(11) Å β= 95.821(7)°. c = 14.9310(14) Å γ = 90°. Volume 545.69(9) Å3 Z 2 Density (calculated) 2.081 Mg/m3 Absorption coefficient 7.402 mm-1 F(000) 328 Crystal size 0.420 x 0.120 x 0.080 mm3
Theta range for data collection 2.595 to 24.985°.
Index ranges -4<=h<=4, -10<=k<=10, -17<=l<=17
Reflections collected 6662
Independent reflections 952 [R(int) = 0.1061]
Completeness to theta = 24.985° 99.9 %
Absorption correction Integration
Max. and min. transmission 0.8404 and 0.1446
Refinement method Full-matrix least-squares on F2
Data / restraints / parameters 952 / 0 / 73
Goodness-of-fit on F2 1.118
Final R indices [I>2sigma(I)] R1 = 0.0322, wR2 = 0.0708
R indices (all data) R1 = 0.0401, wR2 = 0.0732
Extinction coefficient n/a
Table S4. Crystal data and structure refinement for 2.
Identification code ek186
Empirical formula C13 H8 Br Mn N4 O3
Formula weight 403.08
Temperature 200(2) K
Wavelength 0.71073 Å
Crystal system Triclinic
Space group P -1
Unit cell dimensions a = 7.0251(4) Å α= 87.090(5)°.
b = 8.8782(5) Å β= 80.778(5)°. c = 12.4114(7) Å γ = 69.965(4)°. Volume 717.85(7) Å3 Z 2 Density (calculated) 1.865 Mg/m3 Absorption coefficient 3.720 mm-1 F(000) 396 Crystal size 0.220 x 0.170 x 0.150 mm3
Theta range for data collection 1.662 to 24.987°.
Index ranges -8<=h<=8, -10<=k<=10, -14<=l<=14
Reflections collected 9293
Independent reflections 2529 [R(int) = 0.0491]
Completeness to theta = 24.987° 100.0 %
Refinement method Full-matrix least-squares on F2
Data / restraints / parameters 2529 / 0 / 199
Goodness-of-fit on F2 1.046
Final R indices [I>2sigma(I)] R1 = 0.0275, wR2 = 0.0701
R indices (all data) R1 = 0.0307, wR2 = 0.0716
Extinction coefficient n/a
Table S5. Crystal data and structure refinement for 2a.
Identification code shelx
Empirical formula C30 H24 Br4 Mn2 N12
Formula weight 982.13
Temperature 200(2) K
Wavelength 0.71073 Å
Crystal system Monoclinic
Space group P 21/c
Unit cell dimensions a = 12.0263(9) Å α= 90°.
b = 7.7630(4) Å β= 105.517(6)°. c = 19.2201(15) Å γ = 90°. Volume 1729.0(2) Å3 Z 2 Density (calculated) 1.886 Mg/m3 Absorption coefficient 5.395 mm-1 F(000) 956 Crystal size 0.060 x 0.050 x 0.040 mm3
Theta range for data collection 1.757 to 24.999°.
Index ranges -14<=h<=14, -9<=k<=9, -10<=l<=22
Reflections collected 2987
Independent reflections 2987 [R(int) = ?]
Completeness to theta = 24.999° 99.1 %
Refinement method Full-matrix least-squares on F2
Data / restraints / parameters 2987 / 0 / 217
Goodness-of-fit on F2 0.876
Final R indices [I>2sigma(I)] R1 = 0.0743, wR2 = 0.1732
R indices (all data) R1 = 0.1380, wR2 = 0.1982
Extinction coefficient n/a
S3. MLCT- σ
σ Hammet parameter correlation of complexes 1-5
-10
0
10
20
30
40
50
60
70
-0.2
0.0
0.2
0.4
0.6
0.8
1.0
N N N N X XBr
CF3/Cl
CF3
H
H
a
mme
tt
σ
par ao
f X
s
u
b
s
titu
e
n
t
Relative shift MLCT band (nm)
CH3
from H.C. Brown J. Org. Chem. 1958, 23, 420σ
paraCF
3+
σ
metaCl
*
Figure S11. Correlation between the relative MLCT shift of complexes 1-5 and Hammet parameters σ
S4. Results of DFT calculations
Table S6. Selected bond distances and angles of complex 1 compared with DFT calculated values.
X-Rays length (Å)
DFT length (Å)
C(1)-Mn(1)
1.805(3)
1.826
C(2)-Mn(1)
1.806(3)
1.802
C(3)-Mn(1)
1.829(3)
1.834
Br(1)-Mn(1)
2.5206(5)
2.570
Mn(1)-N(3)
2.007(2)
1.995
Mn(1)-N(1)
2.014(2)
2.041
X-Rays angles (°)
DFT angles (°)
C(1)-Mn(1)-C(2)
88.82(13)
92.79
C(1)-Mn(1)-C(3)
87.68(12)
91.60
C(2)-Mn(1)-C(3)
90.55(12)
92.24
C(1)-Mn(1)-N(3)
172.48(11)
168.44
C(2)-Mn(1)-N(3)
93.15(11)
94.32
C(3)-Mn(1)-N(3)
99.55(11)
97.21
C(1)-Mn(1)-N(1)
96.01(11)
93.50
C(2)-Mn(1)-N(1)
93.90(10)
95.24
C(3)-Mn(1)-N(1)
174.27(11)
170.73
N(3)-Mn(1)-N(1)
76.62(8)
76.80
C(1)-Mn(1)-Br(1)
89.78(10)
85.53
C(2)-Mn(1)-Br(1)
177.96(8)
177.53
C(3)-Mn(1)-Br(1)
87.92(9)
86.01
N(3)-Mn(1)-Br(1)
88.43(6)
87.62
N(1)-Mn(1)-Br(1)
87.72(6)
86.67
Figure S12. Correlation between the calculated HOMO-1/LUMO gap and the relative MLCT
absorption of complexes 1-5. R2 = 0.99.
620 630 640 650 660 670 680 690 700
2.25
2.30
2.35
2.40
2.45
(H
-1
)-L
(e
V
)
λabs (nm)
S5. Electronic absorption spectra
Figure S13. Changes observed in the electronic absorption spectra of 1 (A), 2 (B), 3 (C) and 5 (D) upon
photoirradiation at λmax (vis.).
-50 0 50 100 150 200 250 300 350 400 0.00 0.02 0.04 0.06 0.08 0.10 0.12 0.14 0.16 Data: Data1_B Model: ExpDec1 Equation: y = A1*exp(-x/t1) + y0 Weighting: y No weighting Chi^2/DoF = 2.6677E-7 R^2 = 0.99985 y0 0.0065 ±0.00025 A1 0.14308 ±0.00038 t1 91.80698 ±0.63116 A b sor b ance ( a . u. ) Time [min] -20 0 20 40 60 80 100 120 140 160 180 200 0.00 0.02 0.04 0.06 0.08 0.10 0.12 Data: Data1_B Model: ExpDec1 Equation: y = A1*exp(-x/t1) + y0 Weighting: y No weighting Chi^2/DoF = 5.8703E-7 R^2 = 0.99946 y0 0.01098 ±0.00038 A1 0.10773 ±0.00063 t1 41.6559 ±0.60658 Ab s o rb a n c e ( a . u .) Time [min]
Figure S14. Fitting of the monoexponential decay of thermal (top) and photodecomposition kinetics
370 420 470 520 570 620 0 0.5 1 1.5 2 2.5 400 450 500 550 600 650 0 0.5 1 1.5 2 400 450 500 550 600 650 0 0.5 1 1.5 2
Figure S15. Changes observed in the electronic absorption spectra of a Mb solution upon
photoirradiation at λmax (vis.) in the presence of 3 (A), 4 (B) and 5 (C).