HAL Id: hal-00643189
https://hal.archives-ouvertes.fr/hal-00643189
Submitted on 24 Nov 2011
HAL is a multi-disciplinary open access
archive for the deposit and dissemination of
sci-entific research documents, whether they are
pub-lished or not. The documents may come from
teaching and research institutions in France or
abroad, or from public or private research centers.
L’archive ouverte pluridisciplinaire HAL, est
destinée au dépôt et à la diffusion de documents
scientifiques de niveau recherche, publiés ou non,
émanant des établissements d’enseignement et de
recherche français ou étrangers, des laboratoires
publics ou privés.
Segmentation of complex nucleus configurations in
biological images
Florence Cloppet, Arnaud Boucher
To cite this version:
Florence Cloppet, Arnaud Boucher. Segmentation of complex nucleus configurations in biological
images. Pattern Recognition Letters, Elsevier, 2010, 31, pp.755-761. �hal-00643189�
Segmentation of complex nucleus configurations in biological images
F. Cloppet and A. Boucher
LIPADE, Université Paris Descartes
45, rue des Saints Pères 75006 Paris- France
{florence.cloppet ; arnaud.boucher}@mi.parisdescartes.fr
Corresponding author
Florence Cloppet
LIPADE -UFR de Mathématiques et d’Informatique
Université Paris Descartes
45, Rue des Saints Pères 75006 Paris - France
[email protected]
Tel : 33-1-44-55-35-58
Fax : 33-1-44-55-35-35
Abstract
This paper presents a new segmentation method of complex nucleus configurations. The specificity of this work is to introduce prior information about the usual shape of cells nuclei, in order to optimize the selection of markers from which the flooding will start, during the watershed-based segmentation.
Keywords:
Nucleus segmentation, prior information, watershed-based segmentation, biomedical imaging.1. Introduction
Over the past fifteen years, the field of optical imaging has been developing rapidly with the advent of a wide range of new probes (especially fluorescent ones), with the advances in microscopy (immuno-fluorescence light microscope, confocal microscope, video microscopy...) and image analysis. All these advances have revolutionized our understanding and knowledge of the dynamic structures and events related to living cells.
As cell nuclear morphology is a hot topic research now in biology, the biological background of this paper is based on alterations in nuclear morphology. The knowledge of the cellular structure that underlies nuclear morphometric changes, with respect to a non pathological shape, is still limited. But such changes are frequently observed in various nuclei, including several human diseases as cancer, laminopathies, a subset of diseases caused by mutations in Lamins A/C or LMNA gene involved in the architectural proteins (Lamins A and C) of the cell nucleus membrane. Several biological functions seem to be related to major changes in the geometry of the nucleus. Nuclear size and shape are good visual descriptors of abnormal nuclear behavior, and could lead to a quick and efficient diagnosis of nucleus normality.
The development of large scale quantitative biological research or high throughput drug screens can lead to greater understanding of the mechanisms that underlie nuclear morphometric changes, and thus might help to find a treatment. However, the increasing quantity and complexity of image data render manual analysis unreasonably time consuming. Therefore, automatic techniques to analyze nuclei shape in a way that yields both quantitative and objective measurements are of considerable interest. To deal with such large screening tests, it is important to develop methods that allow highly reliable shape description and characterization (Cloppet et al., 2000). This involves computer vision problems for which efficient solutions have not yet been found, such as extracting in a highly precise way the contour of each nucleus, even if the nuclei are aggregated or overlapping.
Section 2 gives some details about the typical problems encountered in the images and deals with the problem of segmentation, while section 3 describes our contribution to segment complex nucleus configurations. Section 4 illustrates the relevance of the developed method through results presented and discussed. Finally, section 5 is devoted to concluding remarks.
2. Segmentation
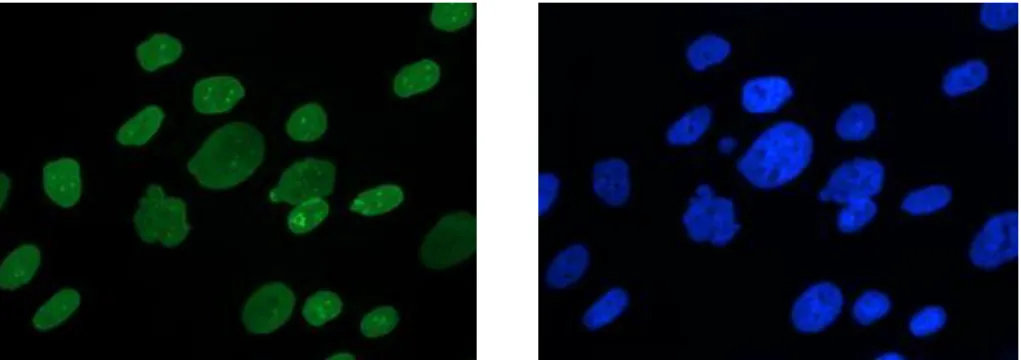
In this study, digitized pictures of immunostained nuclei (see Figure 1) were sampled using a conventional epifluorescent microscope (Leica DMR) coupled to a Princeton-Roper camera. As mentioned above, the presence of the mutated lamin protein resulting in abnormal nuclear shape, is proved by the immunodetection of lamin A/C (primary antibody directed against lamin A/C, secondary antibody coupled to the fluorescence probe FITC: Fluoresceine Iso Thio Cyanat). Other fluorescent staining, with DAPI (Di Aminido Phenyl lndol) can also be used to visualize DNA.
Fig. 1. Nuclei of cells in immunofluorescence images:
Images of lamin repartition (left) and DNA (right)
In fact, the major problem with such 2D images is that they are disturbed by out-of-focus light mostly due to the thickness of the specimen. Nuclei are sometimes occluded by overlapping material from higher or lower focal planes (see Figure 2).
Fig. 2. Occluded nuclei due to overlapping material from higher focal plane
This problem of overlapping areas could be solved by using a confocal microscope, but this makes the acquisition of images much slower. Indeed, at the moment, this is hardly compatible with high throughput drug screens. Furthermore, both sources of images (confocal or light microscope) present similar disturbances due to the auto-fluorescence of the medium, the acquisition noise induced by the camera detector, and various imperfections of the optical system.
Another source of problem is the density of the observed nuclei. In fact, in high density population, nuclei are clustered together with attaching borders (see Figure 3).Therefore, the segmentation step developed to extract each nucleus, in complex nucleus configurations, such as overlapping nuclei and/or clustered nuclei, has to be done with high precision. Segmentation remains a major challenge in image analysis. It refers to the task of detecting boundaries of objects of interest in an image. It should yield a partitioning of the image into disjoint
uniform regions (according to a feature such as gray level, color or texture). It can rely both on the uniformity of the feature inside the region or on edge evidence. Segmentation has been widely studied as shown by Pal and Pal., 1993, and Freixenet and al., 2002. In this section, we will consider methods that can deal only with objects of complex topologies, and that have been proven to be powerful especially in biomedical imaging. Several approaches have been proposed, and they are mainly divided into two categories: energy-driven segmentation (Kass et al., 1987; Zhu and Yuille, 1996; Caselles et al., 1997) and watershed-based segmentation (Vincent and Soille, 1991; Beucher and Meyer, 1992).
In the first category, the segmentation is obtained as a result of the minimization of an energy function, composed of a data-driven term and a regularization term. To prevent the problems encountered by snake-based methods with topological changes, Osher and Sethian (1988) proposed a level set approach, which represents a deformable two-dimensional contour as a level curve of a three dimensional function that is deformed by internal and external forces. The multiphase level set method (Luminata et al., 2002) allows the representation of complex topologies. In the context of biological object segmentation, these methods usually failed to separate objects that are in contact or overlap. Recent methods, based on deformable contours (Zimmer and Olivo-Marin, 2005) or level sets (Zhang et al., 2004), prevent the contours of the nuclei that are in contact from merging. They introduce in the energy functional an overlap penalty between each pair of contours. They can extract regions in contact, but cannot manage to segment overlapping regions. These methods are very useful in applications of isolated cells tracking, as it can be assumed that each cell contour is not very different between two consecutive images of a video, that is the result contours of the previous image (at time t-1) can be use as initial contours of the image at time t. The only initialization step done manually is the first one made on image at t=1. But it remains a major drawback for high throughput drug screens, which is the biological context of the study.
In the second category, the image is processed as a height function that describes a landscape (Beucher and Lantuejoul, 1979). Among the watershed-based segmentation methods, the watershed transform (Vincent and Soille 1991) has proven to be a powerful and fast technique for both contour detection and region-based segmentation. An intuitive description of this transform can be done as follows: consider the image is a topographical relief, where the height of each point is directly related to its gray level, and imagine rain is falling on this relief: the watersheds are the lines that separate the catchments basins. It is generally computed on the gradient of the original image, so that the watersheds are located at high gradient points.
Many interesting properties, among which simplicity, speed and complete partition of the image, are useful for many different image segmentation applications. It has been applied to biological images (Costa et al., 1997; Chen et al. 2006) and has given good results, especially on blurred gray-level images with low contrast and weak boundaries. However, there are some drawbacks such as over-segmentation, or great sensitivity to noise…. In fact, fluctuations in the gradient magnitude image as well as noise can be considered as local minima, and lead to over-segmentation. The watershed segmentation can be improved, in particular by the introduction of knowledge. Nguyen and Ji, 2006, and Hamarneh and Li, 2009 have introduced knowledge into the evolution of region boundaries during the merging process applied to limit over-segmentation A more commonly used solution is the use of knowledge to select good region markers, that represent the number and approximate location of the desired regions. Grau and al. 2004 and Lefevre 2007, have shown that both markers spatial positions and content can be used as a knowledge source in order to decrease over-segmentation. The algorithm of Lefevre 2007, requires a manually made spatial initialization to determine the initial positions of the markers, and involves a supervised pixel classification from which the knowledge used to select the best markers is built. Obviously this step increases the computational cost. The method of Grau and al. 2004, developed for anatomical structures in medical images, used a prior model of the anatomical structure that is expected to be segmented in the form of a statistical atlas. This atlas is used to generate the markers automatically.
In this paper, we propose a fully automated method of segmentation for complex nucleus configurations, especially in aggregated and/or overlapping nucleus configurations where no satisfactory solution has yet been found. This method introduces prior information based on geometrical properties, via configurations nucleus templates, and gray-level criterion that gives a semantic understanding of these configurations. This high level
interpretation of the biological information will allow an automated detection of the desired markers that are connected with the number of nuclei implied in such complex nucleus configurations.
3. Segmenting overlapping and/or clustered nuclei
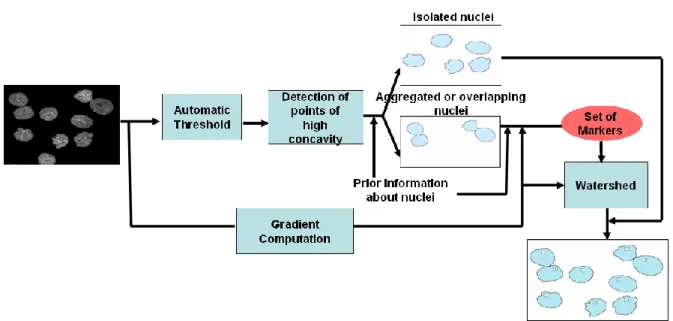
Figure 3 shows the flow chart of the full automated cell segmentation procedure. It is a three steps approach. First clusters of cells nuclei are segmented form the background, with an automated thresholding. Then the isolated cells nuclei are extracted. Finally, complex nucleus configurations, such as overlapping or clustered nuclei, are processed. The main difficulty is to first detect whether a connected component extracted on the image corresponds to a single nucleus or to a group of several nuclei. This information will be helpful for selecting the right markers in order to avoid over or sub-segmentation of cells nuclei.
Fig. 3. Block diagram of the segmentation system
3.1. Markers Selection with use of prior information
Overlapping/clustered nuclei have intersecting contours in points of high concavity. To select those involved in the segmentation process among the whole set of concavity points, prior information about normal or abnormal nuclei shape has to be used.
For example, normal nuclei have a slightly elongated but regular shape with a quite a small area (see Figure 4a), while abnormal nuclei might be much bigger (see Figure 4b) and/or lobulated (See Figure 4c). In fact, points of significant concavity that are extracted can correspond to clustered or overlapping nuclei areas, but also to lobulated areas of abnormal nuclei. (See Figure 5)
a- slightly elongated but regular b – big c- big and lobulated
a b c
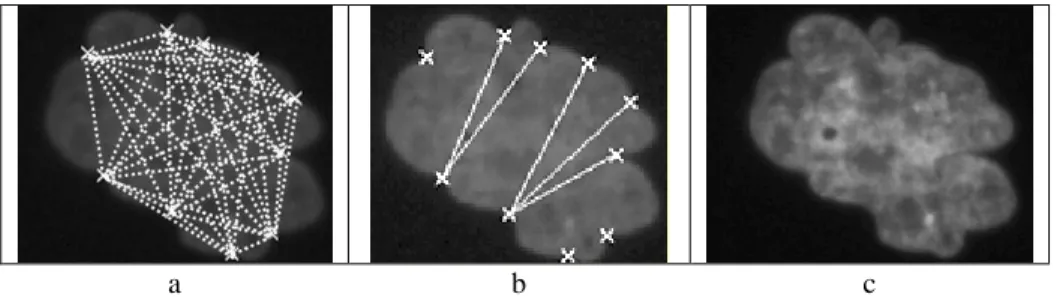
Fig. 5. Points of significant concavity in overlapping nuclei (a) clustered nuclei (b) and
lobulated abnormal nucleus (c)
In order to identify these three types of areas, segments linking significant concavity points (see Figure 6a) are explored for selecting the one(s) that correspond(s) to true separation segment(s) (see Figure 6b).
a b
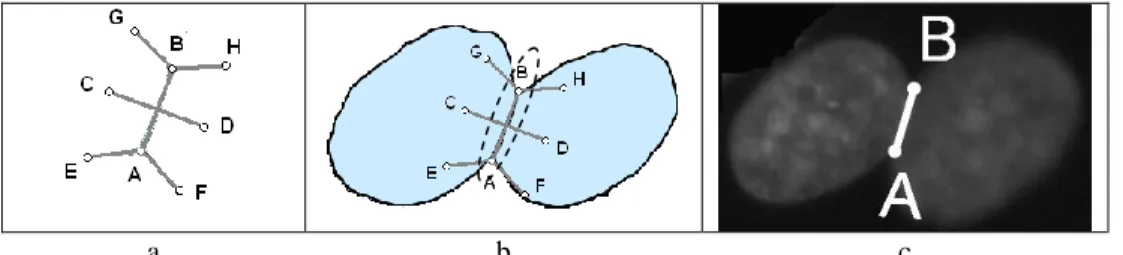
Fig. 6. Selection of a true separation segment [AB] (b) among all potential segments linking two significant
For this purpose, two templates of high biological plausibility (based on visual inspection of about 300 nuclei) have been established:
- overlapping template, - aggregated template.
The overlapping template (see Figure 7a), is based on the hypothesis that if two nuclei overlap, the connected component has to be elongated enough to contain two nuclei. [AB] is the potential segment of separation that connects two significant concavity points A and B, I is the middle point of this segment, [CD] is a segment perpendicular to [AB] at point I, [EF] and [GH] are perpendicular to [AB] respectively at points A and B.
At the moment, the distances CD and AB are equal as well as EF and GH. If the nuclei were circles, we could have fixed equal values to AB, CD, EF and GH. But as they are not, EF has to be smaller than AB and has been evaluated to the third of distance AB after observing a high number of nuclei.
To select the segment [AB] as a true separation segment between overlapping nuclei, all the points C, D, E, F, G, H of the template have to be inside the connected component (see Figure 7b).
Fig. 7. Use of the overlapping template (a) to select (b) the true
separation segment (c) in overlapping nuclei configurations
The problem with this template is that in case of very big and lobulated nuclei, potential segments of separation might fit the overlapping template, though there is no overlapping area (see Figure 8).
Fig. 8. In case of very big and lobulated nucleus potential segments of separation (a)
can fit the overlapping template (b) but don’t satisfy the gray-level criterion (c)
Therefore, in order to distinguish these two configurations, a study of gray levels intensity along [AB] is performed. In case of overlapping nuclei, the gray level intensity is higher in the area of overlapping than the mean intensity of the connected component. In case of a big lobulated nucleus, no significant variation of gray levels can be observed, and then the potential segment of separation is rejected (see Figure 8c).
The aggregating template (see Figure 9a) illustrates the fact that in aggregating areas, there is a narrow pathway where the two nuclei are in contact. This template is more restrictive than the overlapping template. It differs by the angles the consistent segments [EA][EF] and [GB][GH] make with the potential segment of separation [AB]. The distances CD, EA, AF, GB, BH (with equal values for EA, AF, GB, BH) are also evaluated
a b c
by observing a high number of nuclei. The angles are measured using left and right tangent vectors at concavity points A and B.
If the aggregating template fits (see Figure 9b), the segment [AB] is validated as a line of separation between nuclei in contact (see Figure 9c). As the template could be too rigid, some flexibility is introduced, and a rule is applied as follows: "Only one point among the points C, D, E, F, G, H can be outside the connected component".
a b c
Fig. 9. Use of the Aggregating template (a) to select (b) the true separation
segment (c) in aggregated nuclei configurations
3.2. Watershed transform
If the connected component includes several nuclei, they have to be separated. The watershed transform is then used. The critical step of this transform is the setting of the markers which are the starting points of flooding. The marker image used for watershed segmentation is a binary image consisting of either single marker points (generally the ultimate point) or larger marker regions, where each connected marker is placed inside an object of interest. Each initial marker has a one-to-one relationship to a specific watershed region, thus the number of markers will be equal to the final number of watershed regions.
In the developed method, marker regions, based on knowledge extracted at the previous step about nuclei configurations, are used rather than ultimate points, which failed in case of complex nucleus configurations to extract the good number of nuclei. These markers regions are usually extracted as low gradient zones in the image, which is the case in the middle of the nucleus. Indeed, the selected marker regions are the segments [OM] and [NP], which are by definition positioned approximately at the middle of each region located on both sides of the validated segment of separation (see Figure 10), and which width is fixed to 10 pixels to prevent them to be trapped in a local minimum.
I: middle point of [AB] (segment of separation). J: middle point of [AJ].
K: middle point of [IB].
d: perpendicular line to [AB] at point I.
E, F: points of intersection between the line parallel to d at point J and the
contour of the connected component or another validated segment of separation.
G, H: points of intersection between the line parallel to d at point K and the
contour of the connected component or another validated segment of separation.
M, N: middle point of [EJ] and [JF] respectively. O, P: middle point of [GK] and [KH] respectively.
Fig. 10. Definition of marker regions
If the nuclei have been identified at the previous step as aggregating nuclei, a marker is set in the middle (see Figure 10) of the regions located on both sides of the validated segment of separation. If the nuclei overlap, there will be one more marker in the overlapping area along the segment [AB] (see Figure 11). Then the gradient image is considered as a topographical surface that is flooded from the markers.
Fig. 11. Initializing step of the watershed transform in case of overlapping nuclei
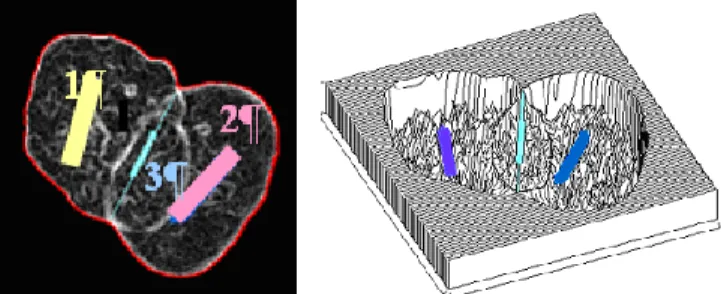
Finally, a post-processing is applied to connect each region to the corresponding nucleus (see Figure 12): regions 1 and 3 form the first nucleus and regions 2 and 3 form the second one.
Fig. 12. Result of overlapping nuclei segmentation
4. Results
To test the efficiency of the proposed method, 50 digitized pictures (1392x1040 pixels) of immunostained nuclei, sampled using a conventional epifluorescent microscope (Leica DMR) coupled to a Princeton-Roper camera, were tested and evaluated. It is not possible to obtain a ground truth based on experts manual segmentation on a great number of nuclei Therefore, on these images containing 712 nuclei, a visual analysis of the results was done by three biological experts, in order to assess the relevance of the extracted nuclei in terms of number of nuclei, but they also have to check that no minor deformation of nuclei shape is missed. As these minor deformations have a fundamental influence in drawing the right conclusions about shape normality, it is important to well extract them during the segmentation step. This expert analysis gives in results the following nuclei repartition (See Table 1).
Isolated Nuclei Aggregated Nuclei Overlapping Nuclei Total 553 (77.67%) 89 (12.50%) 70 (9.83%) 712
Table 1: Nucleus distribution according to biological experts
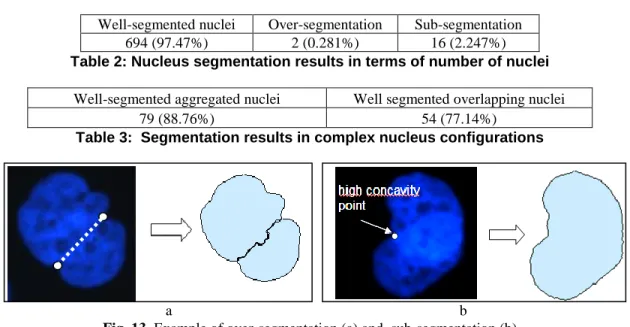
The results of the proposed system (see Table 2) show that 97.47% of nuclei are well segmented in terms of number of nuclei, according to biological experts. Furthermore, no minor deformation is missed. All isolated nuclei are well extracted, so that the 2.53% of nuclei that are not well segmented are implied in complex nucleus configurations. The rate of over-segmentation (i.e. individual nuclei that are split in more than one particle) is very low (0.28%), and show the relevance of the extracted markers. The remaining cases of over-segmentation are observed in some very lobulated nuclei, where two high concavity points match the aggregating template (see Figure 13a) and satisfy the gray-level criterion.
Sub-segmentation (i.e. nucleus configurations are not split in the right number of individual nuclei) rate is slightly higher. According to Table 3, it can be shown that most of the errors of sub-segmentation are observed during the segmentation of overlapping nuclei. They are due to the fact that only one point of high concavity is detected (see Figure 13 b), therefore no segment of separation can be extracted.
1
2
Well-segmented nuclei Over-segmentation Sub-segmentation 694 (97.47%) 2 (0.281%) 16 (2.247%)
Table 2: Nucleus segmentation results in terms of number of nuclei
Well-segmented aggregated nuclei Well segmented overlapping nuclei
79 (88.76%) 54 (77.14%)
Table 3: Segmentation results in complex nucleus configurations
a b
Fig. 13. Example of over-segmentation (a) and, sub-segmentation (b)
The average computational cost of the proposed method has been measured around 3 sec per aggregated or overlapping nucleus configurations, with a Java-based implementation on a Pentium T8100 2.1 GHz / 1 GB RAM laptop. For a whole image containing approximately 30% of nuclei involved in complex nucleus configurations, the average computational cost has been measured around 30 sec per image.
5. Conclusion
In this paper we tackle the problem of segmentation of complex nuclei configuration, such as aggregated or overlapping nuclei, where no satisfactory solution was found in the past. The developed method is based on the marker based watershed algorithm which is one of the most widely accepted solutions in biomedical imaging. This kind of algorithm requires a spatial initialization made either automatically or manually to define the initial position of the catchment basins (i.e. the markers).
We propose a method based on an automatic generation of markers introducing prior information based on geometrical properties by the way of configuration nuclei templates, and on gray-level criterion. Prior information gives a semantic understanding of the nucleus configurations that is useful to determine the right number of markers and their approximate location. This method is not time consuming and yield to a very low rate of over-segmentation.
Future works will be devoted to the introduction of a formal learning step in order to obtain optimal aggregated/overlapping templates based on biological knowledge extracted as rules or image samples. That will make the general application of the proposed method even more reliable and flexible as it will be able to adapt to new nucleus configurations.
Regularization of watershed lines (Nguyen et al. 2003, Tai et al., 2007) can also be introduced in order to smooth the extracted contours, so as to limit inaccuracies in subsequent measurements of shape features.
6. References
Beucher S., Lantuejoul C., 1979. Use of watersheds in contour detection. International Workshop on Image Processing, Real-time edge and motion detection/estimation, vol 132, 1-12.
Beucher S., Meyer F., 1992. The morphological approach of segmentation: the watershed transformation. Mathematical Morphology in image processing , E. Dougherty, ed., New York Marcel Dekker, chapter 12, 43-481
Caselles, V., Kimmel, R., Sapiro, G., 1997. Geodesic active contours. International Journal of Computer Vision 22(1) 61-79.
Chen; X., Zhou; X., Wong, S.T.C., 2006. Automated segmentation, classification, and tracking of cancer cell nuclei in time-lapse microscopy. IEEE Transactions on Biomedical Engineering 53(4), 762 – 766.
Cloppet, F., Oliva, J.M., Stamon, G., 2000. Angular Bisector Network, a simplified generalized Voronoï diagram : application to processing complex intersections in biomedical images. IEEE Transactions on Pattern Analysis and Machine Intelligence, vol 22 n°1, 120-128.
Cloppet, F., Boucher, A., 2008. Segmentation of overlapping/ aggregating nuclei cells in biological images. Proceedings ICPR 2008 (19th International Conference on Pattern Recognition).
Costa, J. A.F., Mascarenhas, N.D., De Andrade Netto, M.L., 1997. Cell nuclei segmentation in noisy images using morphological watersheds. Proc. SPIE vol. 3164, 314-324.
Freixenet, J., Muñoz, X., Raba, D., Martí, J., Cufí,X., 2002. Yet another survey on image segmentation: region and boundary information integration. Heyden,A., Sparr, G., Nielsen, M., Johansen, P. eds, ECCV 2002, LNCS vol 2352, 408-422.
Grau, V., Mewes, A., Alcañiz, M., Kkinis, R., Warfield, S., 2004. Improved watershed transform for medical image segmentation using prior information. IEEE Transactions on Medical Imaging 23(4), 447-458.
Nguyen, H.T., Worring, M., Van Den Boomgare, R., 2003. Watersnakes: energy driven watershed segmentation. IEEE Transactions on Pattern Analysis and Machine Intelligence 25(3), 330-342.
Kass, M., Witkins, A., Terzopoulos, D., 1987. Snakes: active contours models. International Journal of Computer Vision 1(4), 321-331.
S. Lefèvre, 2007. Knowledge from markers in watershed segmentation. Proceedings of : International Conference on Computer Analysis of Image and Patterns (CAIP), Lecture Notes in Computer Science vol 4673, 579–586. Osher, S.J., and Sethian, J.A., 1998. Fronts propagating with curvature dependent speed: algorithms based on
Hamilton-Jacobi formulations. Journal Computational Physics, bol 72, 12-49.
Pal, N.R., Pal, S.K., 1993. A review on image segmentation techniques. Pattern Recognition 26(9), 1277-1294. Luminata, A.,Vese, L.A., Chan, T.F., 2002. A multiphase level set framework for image segmentation using the
Mumford and Shah model. International Journal of Computer Vision 50(3), 271-293.
Tai, X.C, Hodneland, E., Weickert, J., Buroresthliev, N. V., Lundervold, A., Gerdes, H.H., 2007, Level set methods for watershed image segmentation. Scale Space and Variational Methods in Computer Vision, LNCS 4485, 178-190.
Vincent, L., Soille, P., 1991. Watershed in digital spaces, an efficient algorithm based on immersion simulation. IEEE Transactions on Pattern Analysis Machine Intelligence 13(6), 583-598.
Zhang, B., Zimmer, C., Olivo-Marin, J.C., 2004. Tracking fluorescent cells with coupled geometric active contours. IEEE International Symposium on Biomedical Imaging vol.1, 476-479.
Zhu, S.C., Yuille, A., 1996. Region competition : unifying snakes, region growing and Bayes/MDL for multiband image segmentation, . IEEE Trans Pattern Analysis and Machine Intelligence 18(9), 884-900.
Zimmer, C., Olivo-Marin, J.C., 2005. Coupled Parametric Active Contours. IEEE Transactions on Pattern Analysis Machine Intelligence 27(11), 1838-1842.
Acknowledgements
The authors would like to thank N. Levy, P. Cau, C. Navarro and S. Perreira (Inserm U910 "Génétique Médicale et Développement", Faculté de Médecine de la Timone, 13385 Marseille Cedex 05) for providing images, and for their valuable suggestions and inspiring conversations.
![Fig. 6. Selection of a true separation segment [AB] (b) among all potential segments linking two significant concavity points (a) in various nuclei configurations](https://thumb-eu.123doks.com/thumbv2/123doknet/15015642.680992/6.918.261.680.427.939/selection-separation-segment-potential-segments-significant-concavity-configurations.webp)