HAL Id: insu-02520618
https://hal-insu.archives-ouvertes.fr/insu-02520618
Submitted on 1 Dec 2020
HAL is a multi-disciplinary open access
archive for the deposit and dissemination of
sci-entific research documents, whether they are
pub-lished or not. The documents may come from
teaching and research institutions in France or
abroad, or from public or private research centers.
L’archive ouverte pluridisciplinaire HAL, est
destinée au dépôt et à la diffusion de documents
scientifiques de niveau recherche, publiés ou non,
émanant des établissements d’enseignement et de
recherche français ou étrangers, des laboratoires
publics ou privés.
Distributed under a Creative Commons Attribution - NoDerivatives| 4.0 International
Is there a Nascent Plate Boundary in the Northern
Indian Ocean?
Aurélie Coudurier-Curveur, Çağıl Karakaş, Satish C. Singh, Paul Tapponnier,
Hélène Carton, Nugroho Hananto
To cite this version:
Aurélie Coudurier-Curveur, Çağıl Karakaş, Satish C. Singh, Paul Tapponnier, Hélène Carton, et al..
Is there a Nascent Plate Boundary in the Northern Indian Ocean?. Geophysical Research Letters,
American Geophysical Union, 2020, 47, �10.1029/2020GL087362�. �insu-02520618�
Is There a Nascent Plate Boundary in the
Northern Indian Ocean?
A. Coudurier‐Curveur1,2 , Ç. Karakaş1,3 , S. Singh1,2 , P. Tapponnier1,4, H. Carton2 , and N. Hananto5
1Earth Observatory of Singapore, Nanyang Technological University, Singapore,2Equipe de Géosciences Marines, Institut
de Physique du Globe de Paris (CNRS, Paris Diderot, Sorbonne Paris Cité), Paris Cedex 05, France,3Schlumberger
Research Center, Stavanger, Norway,4Institute of Crustal Dynamics, China Earthquake Administration, Haidian, Beijing, China,5Research Center for Oceanography, Indonesian Institute of Sciences, Jakarta Utara, Indonesia
Abstract
The northern Indian Ocean has been widely recognized as an area of broadly distributed deformation within the composite India‐Australia‐Capricorn plate, hosting several diffuse boundary zones and a diffuse triple junction. The occurrence, along reactivated fracture zones, of the exceptionally large (Mw= 8.6 and Mw= 8.2) 2012 Wharton Basin strike‐slip earthquakes, however, questions whether thiscomposite plate is breaking apart along a discrete boundary. Using recent bathymetric and seismic data, we analyze the most prominent fracture zone (F6a), whose structural trace is particularly well expressed. We identify 60 kilometric‐scale pull‐apart basins with geometric properties (length/width ratios) similar to those observed along continental strike‐slip plate boundaries. Four of the pull‐aparts formed above narrow, subvertical faults extending into the oceanic crust. Within the broad Wharton deformation zone, the significant slip rates (0.8 to 2.5 mm/yr) and unusually large coseismic displacements recorded along F6a suggest that it may be a nascent plate boundary.
Plain Language Summary
Oceanic plates are usually rigid and aseismic, except along their boundaries. In 2012, two extraordinary earthquakes with magnitudes M > 8, typical of plate boundary events, occurred in the Wharton Basin, inside the India‐Australia‐Capricorn plate, slicing the seafloor along straight, old fracture zones bearing evidence of active tectonic deformation. Using submarine relief and seismic data, we study the freshest fracture zone (F6a) to examine whether it might qualify as a nascent plate boundary between India and Australia. Wefind that localized cracks along it and narrow rectangular basins (pull‐aparts) resemble those along large continental strike‐slip boundary faults, supporting the inference that the composite Indo‐Australian plate is breaking apart.1. Introduction
Since the early 1970s, the north‐central Indian Ocean, which constitutes the major part of the composite India‐Australia‐Capricorn plate, has been identified as a region of significant intraplate deformation challenging the concept of rigid plates that deform only along their boundaries (e.g., Bull & Scrutton, 1990). Evidence for such deformation includes high levels of intraplate seismicity (e.g., Gordon, 1998; Petroy & Wiens, 1989; Stein & Okal, 1978; Tinnon et al., 1995; Wiens et al., 1985), abnormally high heat flow (Weissel et al., 1980), significant stress field rotations (Cloetingh & Wortel, 1986), long‐wavelength gravity undulations (e.g., Stein et al., 1989), and deformed oceanic crust and overlying sediments both in the Central Indian Basin (e.g., Eittreim & Ewing, 1972) and in the Wharton Basin (WB) (e.g., Deplus, 2001; Singh et al., 2017) (Figure 1a). This widely deforming region between India and Australia has been interpreted as hosting a diffuse plate boundary zone (e.g., Wiens et al., 1985; Gordon et al., 1998; Stein et al., 1990; DeMets et al., 1994) to account for relative plate motion differences (Minster and Jordan, 1978; Wiens et al., 1985), stress orientation changes (Cloetingh & Wortel, 1986), and contrasting styles of faulting (e.g., Bull & Scrutton, 1990; Deplus et al., 1998). Despite such overall consensus, however, the occurrence, since 2000, of very large strike‐slip earthquakes in the Wharton Basin (e.g., Abercrombie et al., 2003; Robinson et al., 2001) including the translithospheric, 2012, Mw= 8.2 and Mw= 8.6 events, and an increase in the seismicity
rate since the 2004 Sumatra megathrust earthquake (Delescluse et al., 2012), do suggest a possible
©2020. The Authors.
This is an open access article under the terms of the Creative Commons Attribution License, which permits use, distribution and reproduction in any medium, provided the original work is properly cited.
RESEARCH LETTER
10.1029/2020GL087362
Key Points:
• Sixty kilometric‐scale pull‐apart basins show aspect ratios similar to those observed along crustal‐scale strike‐slip faults
• At least four deep pull‐aparts rooted into lithospheric faults illustrate a progressive localization of deformation along F6a • Sinistral slip rates <2 mm/yr and
exceptionally large 2012 coseismic slip support the evolution of F6a into a nascent plate boundary
Supporting Information: • Supporting Information S1 • Table S1 Correspondence to: A. Coudurier‐Curveur, coudurier@ipgp.fr Citation:
Coudurier‐Curveur, A., Karakaş, Ç., Singh, S., Tapponnier, P., Carton, H., & Hananto, N. (2020). Is there a nascent plate boundary in the northern Indian Ocean? Geophysical Research Letters, 47, e2020GL087362. https://doi.org/ 10.1029/2020GL087362
Received 2 FEB 2020 Accepted 1 MAR 2020
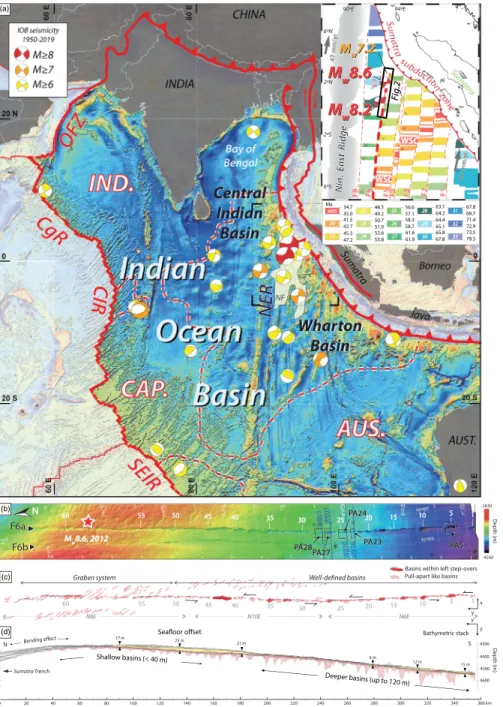
Figure 1. F6a reactivated fracture zone in Indian Ocean Basin tectonic setting. (a) The composite India (IND.)‐Australia (AUS.)‐Capricorn (CAP.) plate (bold red contour) hosts diffuse deformation zones delimited by red and white dashed lines (after Royer & Gordon, 1997), along which there are high levels of intraplate seismicity. Colored beach balls are Mw= 6 to Mw> 8 earthquakes focal mechanisms from 1950 to 2019 (USGS/GCMT). Oceanic background image shows gravity
anomalies from satellite altimetry (Sandwell et al., 2014) overlaid on SRTM30 bathymetry and topography. NER: Ninety East Ridge; OFZ: Owen Fracture Zone; CgR: Carlsberg Ridge; CIR: Central Indian Ridge; SEIR: Southeast Indian Ridge. Beige region (NF) within Wharton Basin shows extent of Nicobar fan sediments (after McNeill et al., 2017). Thin dashed black rectangle indicates location of top right inset. Top right inset: Tectonic setting of northern Wharton Basin showing magnetic anomalies (color coded Chrons 20 to 33, Singh et al., 2011, Jacob et al., 2014). Red dashed lines indicate fracture zones F1 to F8, from east to west. Thick red dashed line is F6 fracture zone. Beach balls indicate focal mechanisms of three largest earthquakes of 2012 Wharton Basin sequence. Gray arrows indicate plate motion direction and velocity from GPS data (relative to Sunda Plate) (Prawirodirdjo et al., 2010). WSC: fossil Wharton spreading center. Target symbols indicate locations used to calculate convergence rates between India and Australia. Black rectangle indicates location of Figure 1b. (b) Shaded relief bathymetric dataset along F6a fracture zone, colored according to depth. Pull‐apart basins 1 to 60 are targeted white. Red star is epicenter of the Mw= 8.6, 2012 Wharton
Basin earthquake (GCMT/USGS). Black boxes are locations of close‐up sections of Figure 2. Blue lines indicate seismic profile locations. (c) Tectonic interpretation of F6a and associated normal faults. First‐order fault segments of left‐lateral, reactivated F6a FZ are shown in black. Pull‐apart basins at fault steps are dark red. Other pull‐apart like basins are light orange. Normal faults along and alongside of F6a and F6b are shown in red. (d) Stack of bathymetric profiles highlighting (1) detailed geometry of oceanicfloor (gray), (2) seafloor offset west and east of F6a (transparent yellow), and (3) depths of 60 pull‐apart basins (transparent orange). The two bathymetric escarpments (light yellow) likely reflect age, density, and thermomechanical contrasts in oceanic crust on opposite sides of F6a (e.g., Hall & Gurnis, 2005; Sandwell, 1984; Sandwell & Schubert, 1982), as well as active faulting accounting for such sharp features.
10.1029/2020GL087362
Geophysical Research Letters
localization of deformation along a more discrete boundary, within the Wharton Basin east of the Ninety‐East ridge (e.g., Hill et al., 2015).
The Wharton Basin seafloor is shaped by the elongated, continuous, north‐south (NS) trending fossil frac-ture zone (FZs) of the Wharton Spreading Centre (WSC), which are reactivated as left‐lateral strike‐slip faults in the present‐day stress field (e.g., Deplus et al., 1998; Graindorge et al., 2008; Singh et al., 2017; Hananto et al., 2018; Figure 1a). Among the well‐identified FZ (F2–F8; Singh et al., 2011; Jacob et al., 2014), and more specifically among those whose seafloor traces have been mapped with multibeam bathymetry (Deplus et al., 1998; Hananto et al., 2018; Singh et al., 2017), the F6a FZ displays the clearest morphologic expression with en échelon structures, tensile cracks, and pull‐apart basins, which implies that it is the most active one (Deplus et al., 1998; Hananto et al., 2018; Singh et al., 2017). Seismological and geodetic investiga-tions of the Mw= 8.6, 2012 Indian Ocean earthquake (e.g., Hill et al., 2015; Meng et al., 2012; Satriano
et al., 2012; Wei et al., 2013) have suggested that several of the NS reactivated FZ, particularly F6a, hosted a large part of the complex 2012 rupture, an interpretation further refined with high‐resolution bathymetric and seismic data acquisition into a model of en échelon rupturing of stepping NS fault strands (Singh et al., 2017). The F6a FZ extends over a length of at least 1,000 km; in the 2012 rupture area, it forms the western boundary of the 4 ± 0.5 km thick Late Paleocene‐Early Eocene oceanic crust (Chrons 24–25; Figure 1) and truncates the overlying pelagic sediments and the 1.5 to≈4‐km‐thick Late Miocene Nicobar Fan sediments (e.g., Carton et al., 2014; Hananto et al., 2018; Hüpers et al., 2017; McNeill et al., 2017; Singh et al., 2011).
Here, we investigate whether or not the F6a fracture zone might represent a nascent plate boundary. To do so, we use (1) the high‐resolution multibeam bathymetric data acquired in 2016 during the MIRAGE (Marine Investigation of the Rupture Anatomy of the 2012 Great Earthquake) experiment in the Wharton basin (Hananto et al., 2018; Figure S1) to better document the distribution and geometric characteristics of pull‐apart basins along the F6a fracture zone, and (2) seismic profiles from the 2015 MEGATERA (Mentawai Gap—Tsunami Earthquake Risk Assessment) experiment (Singh et al., 2017; Figure S1 in the supporting information) to constrain the mode and timing of deformation recorded in the pull‐apart basins. We finally discuss how our morphologically and kinematically constrained slip rates compare with strike‐slip plate boundary examples worldwide.
2. Pull‐Apart Basins Along the Reactivated F6a Fracture Zone
Using the high‐resolution (28‐m horizontal grid spacing) MIRAGE bathymetry dataset, and following the interpretation (e.g., SAMUDRA survey, Deplus et al., 1998; MEGATERA experiment, Singh et al., 2017) of a few pull‐apart basins along F6a as markers of left‐lateral reactivation of that fracture zone, we mapped, between 0°15′S to 2°30′N, and characterized in much greater detail 60 such basins (numbered 1 to 60; Figure 1b) and their bounding normal faults. These basins show the clearest bathymetric expression in the central and southern sections of F6a, where they are bounded by normal faults nearly aligned with F6a, in contrast with the northernmost section, where such faults stand within a graben‐like depression and are significantly oblique to the F6a azimuth (N8E on average; Figure 1c). The strike of these normal faults (≈N 140°E) is parallel to the regional direction of maximum compression (Figure S1; Singh et al., 2017; Hananto et al., 2018). To the south, we identify eight left step‐overs between tens of kilometers long segments arranged in an en échelon pattern, and separated by clear rhomboidal pull‐apart basins (dark red basins on Figure 1c). The 52 other basins are mainly bounded on one side by one major normal fault (light red basins in Figures 1c and 1d) along which we also identified six compressive, push up features in the southern stretch of F6a (Figure S2). Although they are not pull‐apart basins sensu stricto (i.e., associated with clear fault step‐overs), we also refer to them as pull‐aparts (PA) since they are local deeps along a strike‐slip fault. We measured the length, depth, and maximum width of these pull‐aparts directly from the bathymetric dataset. The length range between 350 and almost 8,000 m. They tend to be consistently greater than 3,500 m in the northern section (PA53 to PA60; Figure S3). The basin width distribution also shows wide dis-persion, especially in the southern and central sections, with maximum widths ranging between 300 and 2,750 m (Figure S3). We quantify the maximum depth (i.e., bathymetric relief) of each basin by measuring the difference between the average depth of the seafloor (west of F6a) over distances of 2 to 5 km, and the maximum basin depth across profiles orthogonal to F6a. The bathymetric stack (Coudurier‐Curveur,
10.1029/2020GL087362
Geophysical Research Letters
2012; Armijo et al., 2015) along F6a (Figures 1d and S2) shows that the deepest basins (up to≈120 m) are located in the southern part of F6a and that the basin depths decrease almost linearly northwards to a minimum of≈45 m in the northernmost stretch of F6a (i.e., PA48 to PA60).
3. Mode and Timing of Crustal‐Scale Deformation Along the Reactivated F6a
Fracture Zone
The reactivation of the N8°E‐trending fracture zones F6a,b and F7a,b and the structural characteristics of the Wharton Basin (basement depth, crustal and overlying sedimentary thicknesses, first‐order fault identification, and associated deformation) have been highlighted in recent studies (Hananto et al., 2018; Singh et al., 2017). To characterize further the deep structure of the 350‐km‐long F6a FZ in our study area, we interpreted and correlated in greater detail the high‐resolution airgun seismic reflection profiles WB02, WB03, WB10, and WB16 (Singh et al., 2017) that cross the four particularly well‐expressed pull‐apart basins PA23, PA24, PA27, and PA28 (Figures 2 and S1). We identify and map 15 reflectors in a consistent fashion on all four profiles. The reactivated F6a faults clearly cut and offset both the basement and sediment layers (Figure 2). On either sides of fracture zone F6a, the sedimentary cover reflectors are only mildly disturbed by smaller faults (Figure S4).
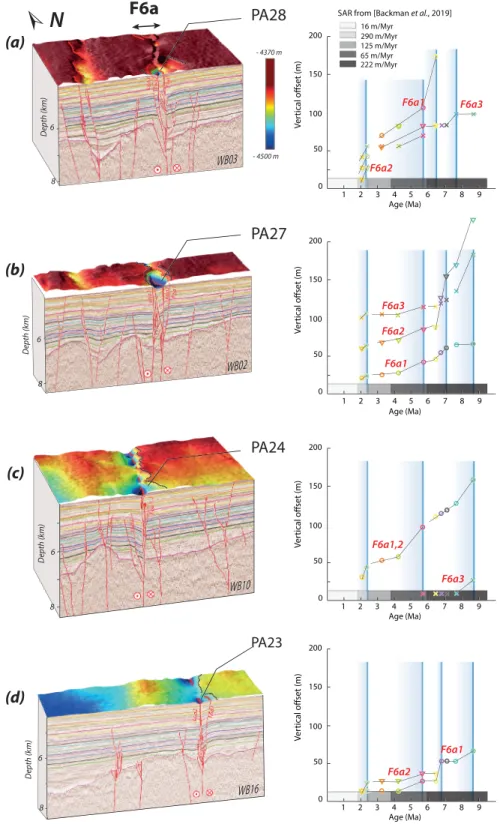
The four basins have sediment thicknesses between 2.4 and 3 km and widths between 1.5 and 2.5 km. The shallowest parts of pull‐apart basins 27 and 28 are bounded by three main faults (F6a1, F6a2, and F6a3) with dip‐slip components, which connect with two main, parallel, subvertical faults at basement depth (≈7 km bsf). For pull‐apart basins 23 and 24, a single, subvertical F6a structure is predominant. In the bathymetry, PA27 and PA28 are better expressed than PA23 and PA24. On all four profiles, the sedimentary reflectors offsets increase with depth from tens of meters to a few hundreds of meters (Figures 2 and S5–S8), which confirms syntectonic deposition of the Nicobar Fan turbidites (Singh et al., 2017), with a maximum top basement total offset of≈0.4 km (PA28, profile WB03; Figures 2 and S6). Note as well that the total offsets measured in PA23 and 24 are likely increased by local scale folding (Figure 2).
Constraining the rates of deformation and onset of reactivation of the fracture zones in the Wharton Basin has been challenging due to the limited geophysical data across such large‐scale offshore structures. The recent results from IODP drilling sites U1480 and U1481 offshore Sumatra (Figures S1 and S4) indicate that deposition of the Nicobar Fan began≈9.5 million years ago and stopped at ≈2 Ma (Dugan et al., 2017; Hüpers et al., 2017; McNeill et al., 2017) withfluctuating sediment accumulation rates (Backman et al., 2019). Although the two drilling sites are somewhat distant (≈150 km west) from the F6a FZ, they may be reason-ably used to inferfirst‐order constraints on the timing of deformation/reactivation of F6a.
Figure 2 shows plots of the depth‐increasing cumulative vertical offsets (in meters) measured for the 15 reflectors as a function of time (Ma) across the F6a system, for PA23, PA24, PA27, and PA28, with age‐depth relationships derived from the age constraints at site IODP U1480 (see Figure S4 for details). These plots show clear, consistent changes in slope and highlight at least two main, contemporary reactivation phases, at≈5.7 and ≈2.3 Ma, across most of the fault splays in all four basins. We infer that most of the clearest, well preserved pull‐apart basins in the oceanic floor along F6a likely formed during the last reactivation phase and hence are younger than 2.3 Ma. This recent phase may be coeval with that identified along F6b1, west of F6a (Figure 6 in Singh et al., 2017), previously assumed to be 7 million years old, based on an age estimate preceding that based on IODP drilling (Backman et al., 2019; McNeill et al., 2017).
4. Discussion: F6a, a Possible Nascent Plate Boundary?
4.1. Fault Behavior and Localization of Deformation
The diversity of the pull‐apart basin sizes (Figures 1 and S3) suggests that not all of them formed at the onset of the last reactivation of F6a (2.3 Ma), but later on, as new strands of the fault formed with increasing slip (e.g., Aydın & Nur, 1982). Such behavior is highlighted by the development of younger normal faults within the basins, as observed on the seismic profiles (Figure 2). Consequently, several short pull‐apart basins asso-ciated with the en échelon geometry of F6a might coalesce to form longer basins over time. The“mega‐pull apart” 41–44 may yield evidence of that ongoing process (Figure 1c). Additionally, the clear southward increase of basin depths (Figures 1d and S3) likely indicates earlier localization of strike‐slip sheer along
10.1029/2020GL087362
Geophysical Research Letters
Figure 2. Interpreted bathymetry and seismic reflection profile close‐ups across reactivated fracture zone F6a, and associated vertical offset of reflectors as a function of age (Ma). (Left) Block diagrams integrating seismic profiles and bathymetric sections across pull‐apart basins PA28, PA27, PA24, PA23 (from north to south). PA27 and PA28 have clear bathymetric signatures associated with well‐defined sets of parallel, subvertical faults cutting through Nicobar Fan deposits. The two pull‐apart like basins PA23 and PA24 have slightly less clear basin morphologies and pull‐apart geometry and are mostly bounded by one single fault reaching the oceanicfloor. (Right) Variations with time of vertical offsets of mapped reflectors across F6a fault splays for PA28, PA27, PA24, and PA23 (see Figure S4 for details on depth/age conversion of reflectors). Most fault splays show acceleration phases (segments with increased slopes) in the last 9 Ma. The slope changes around 2.3 Ma on all profiles likely mark the most recent, still ongoing, F6a reactivation.
10.1029/2020GL087362
Geophysical Research Letters
F6a, as also suggested by (1) the location of the eight largest left‐stepping pull‐aparts in its southern and central sections (Figure 1c) and (2) the dif-ferent style of active faulting in its northernmost section. There, normal faults oblique to F6a, limiting graben structures, contrast with faults aligned with F6a in the southern and central sections (Figure 1c). The northern, shallow pull‐apart basins within the grabens likely indicate an incipient stage of pull‐apart development with smaller bounding faults (Rahe et al., 1998). It is also possible that, due to the proximity to the Sunda subduction zone, bending stresses enhance the development of gra-bens in the northern,flexed crust.
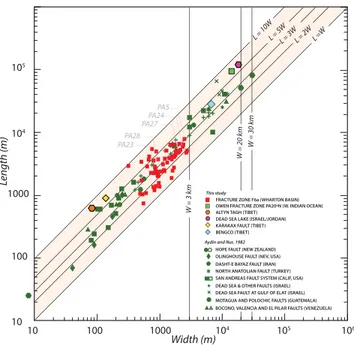
Figure 3 shows the length‐to‐width ratios, in log‐log coordinates (after Aydın & Nur, 1982, and Meyer et al., 1998, comparable plot for compres-sional push‐ups), of the 60 pull‐apart basins identified in this study. In addition, it also shows data for 62 pull‐apart basins or rhomb‐shaped gra-bens associated with major strike‐slip faults and plate boundaries world-wide, largely extracted from Aydın and Nur (1982), and complemented with five pull‐apart basins from oceanic setting (Owen fracture zone) and from Tibetan faults (Altyn Tagh, Karakax, and Beng Co faults; Armijo et al., 1989; Peltzer et al., 1989; Figure S9) (Table S1). The pull‐apart basins along F6a are as large as those along the San Andreas and Dead Sea faults, with a maximum“cut‐off” width of 3 km, likely con-trolled by rheological boundaries within the oceanic crust/lithosphere (e.g., Meyer et al., 1998). In support of this inference, note that the maxi-mum depth of normal faulting along the boundaries of the largest/longest pull‐aparts is ≈3 km, coinciding with the depth of the basement. Despite the range of dimensions (Figure 3), our dataset is fairly consistent with the linear correlation linking length (l) and width (w), following the equation l≃ 3.2 w (Aydın & Nur, 1982), with absolute minimum and max-imum l/w ratios of 1 and 10, respectively. This suggests that the reactivated F6a fracture zone behaves like crustal‐scale, localized, plate boundary strike‐slip faults, not only for secondary extensional structures dimensions but also for slip amounts. The scale invariant aspect ratios highlighted by the length/width plot, which reflect self‐similar growth (Meyer et al., 1998), likely imply that the pull‐apart sizes are proportional to the cumulative strike‐slip displacements along F6a (e.g., Aydın & Nur, 1982; McCaffrey & Petford, 1997).
4.2. Slip Rate Estimates
Following the above interpretations, we use the geometric dimensions of the longest and presumably oldest pull‐apart along F6a (PA5) to constrain and bound the total cumulative horizontal displacement accrued across that reactivated fracture zone during the last 2.3 Ma. We take into account two distinct markers and plausible models (Figure 4). Thefirst one, dubbed “void‐crack model,” is based on the extreme assump-tion of the simple opening of a dilataassump-tional jog. The present size of the PA5 basin is restored to an initial orthogonal crack by closing the entire basin with a horizontal displacement equal to its length parallel to F6a. Such a reconstruction yields a maximum bound for cumulative Quaternary slip (dmax) of 5.8 ± 0.2 km along the southern part of F6a (Figure 4b). Analog experiments (e.g., Rahe et al., 1998; Sugan et al., 2014), however, show that oblique dip‐slip faults form progressively to accommodate subsi-dence within releasing bends. To take this into account, we consider a second, alternative“graben model” (Figure 4c). In this model, we simply estimate the horizontal extension consistent with seafloor subsidence across PA5. As observed in the four pull‐apart basins PA23, PA24, PA27, and PA28, sedimentation appears to have been syntectonic; hence, restoring the bathymetric shape of the basin may be taken to provide a mini-mum slip estimate (dmin). Such a restoration, almost parallel to PA5 yields a minimini-mum strike‐slip offset on order of≈1.9 km (Figure 4d).
Assuming that such minimum and maximum left‐lateral offsets accrued during the last 2.3 Ma would imply slip rates along F6a of≈0.8 to ≈2.5 mm/yr, about a mean of ≈1.7 mm/yr. Such slip rate estimates are about one order of magnitude slower than those along well‐known strike‐slip plate boundaries such as the San Figure 3. Pull‐apart characteristic aspect ratio. Log length vs. log width plot
(after Aydın & Nur, 1982) for pull‐apart basins and rhomb‐shaped grabens associated with major worldwide strike‐slip faults (green symbols: data from Aydın & Nur, 1982; other colored symbols: oceanic (Owen FZ, Fournier et al., 2011) and Tibetan plateau examples (Armijo et al., 1989; Peltzer et al., 1989; this study, Figure S9) combined with measurements of 60 pull‐apart basins identified along F6a (red squares) (Table S1). Most of the F6a pull‐apart basin length‐to‐width ratios fall within the l/w = [2–5] range. See the Supporting Information for more details.
10.1029/2020GL087362
Geophysical Research Letters
Andreas (e.g., 1.8 cm/yr, Lindsey & Fialko, 2013) or other large continental strike‐slip faults (e.g., North Anatolian fault, 2.5 cm/yr, Reilinger et al., 2006; Altyn Tagh fault, 1 to 2 cm/yr, e.g., Mériaux et al., 2005, 2012; Tapponnier et al., 2001), but only about half those along other plate boundary faults such as the Dead Sea Fault (0.4 cm/yr, Klinger et al., 2000), or the Owen Fracture Zone (3 ± 1 mm/yr in the last 3–6 Ma, Fournier et al., 2011) on the northwest side of the Indian Ocean (Figure 1a). The mean PA5 slip rate is also less than the relative Australia/India plate motion (≈1 cm/yr, MORVEL 2010 and NUVEL‐1A models, www.unavco.org, DeMets et al., 1994; Table S2).
As highlighted by the occurrence of the 2012 Mw= 8+ earthquake sequence, however, which coinvolved the
rupture of additional faults within the Wharton basin (e.g., Hill et al., 2015; Satriano et al., 2012), slip parti-tioning along more than one reactivated fracture zone (e.g., F7 and F5, Graindorge et al., 2008), for which we have little or no constraints, likely takes up the missing, more distributed, shear strain between India and Australia. On the other hand, the 30‐ to 50‐m coseismic slip estimated for the largest, Mw= 8.6, 11 April
Figure 4. Constraining maximum and minimum slip amounts across PA5. (a) Pull‐apart evolution considering “void‐crack model.” Final displacement is directly linked to lateral length of pull‐apart. (b) Bathymetric dataset and morphotectonic map of PA5. Lateral length of pull‐apart is 5.8 ± 0.2 km. AA′ black line indicates location of profile shown in (d). (c) Pull‐apart evolution considering “graben model.” Final displacement corresponds to sum of horizontal offsets along each dip‐slip fault (d1and d2) of the graben‐type basin. (d) Topographic profile across PA5 and horizontal
offset measurements (d1= 1,145 m, d2= 770 m). Total slip (d) is 1,915 m.
10.1029/2020GL087362
Geophysical Research Letters
2012 event rupture (Hill et al., 2015; Meng et al., 2012; Wei et al., 2013) would yield recurrence times of such very large events on order of≈20,000 years, much longer than along classic plate boundary faults.
5. Conclusions
The Wharton Basin hosts particularly long, reactivated fracture zones, thick sedimentary deposits from the Nicobar Fan that recorded Miocene to Pleistocene deformation, and it is the site of some of the greatest oceanic“intraplate” earthquakes. The F6a fracture zone has the most prominent and fresh bathymetric expression, with markers of left‐lateral reactivation represented by as many as 60 very clear, kilometer‐size pull‐apart basins. That the characteristic dimensions of such basins are in line with those observed along major strike‐slip plate boundaries indicates that F6a behaves as a localized, lithospheric‐scale strike‐slip fault. Vertical offsets that increase with depth along the pull‐apart basin's bounding faults reveal distinct syntectonic deposition episodes implying different reactivation phases, the most recent of which started≈2.3 million years ago. A ≈2 mm/yr left‐lateral slip‐rate is consistent with the opening of the largest Quaternary pull‐apart (PA5) along F6a. This suggests that F6a is already the dominant shear zone accommodating the differential motion between the Indian and Australian plates, and hence a nascent plate boundary between the two.
References
Abercrombie, R. E., Antolik, M., & Ekström, G. (2003). The June 2000 Mw7.9 earthquakes south of Sumatra: Deformation in the
India–Australia Plate. Journal of Geophysical Research, 108(B1), 2018. https://doi.org/10.1029/2001JB000674
Armijo, R., Lacassin, R., Coudurier‐Curveur, A., & Carrizo, D. (2015). Coupled tectonic evolution of Andean orogeny and global climate. Earth‐Science Reviews, Elsevier, 143, 1–35. https://doi.org/10.1016/j.earscirev.2015.01.005
Armijo, R., Tapponnier, P., & Han, T. (1989). Late Cenozoic right‐lateral strike‐slip faulting in southern Tibet. Journal of Geophysical Research, 94(B3), 2787–2838.
Aydın, A., & Nur, A. (1982). Evolution of pull‐apart basins and their scale independence. Tectonics, 1(1), 91–105.
Backman, J., Chen, W., Kachovich, S., Mitchison, F., Petronotis, K., Yang, T., & Zhao, X. (2019). Data report: Revised age models for IODP Sites U1480 and U1481, Expedition 362. In L. C. McNeill, B. Dugan, K. E. Petronotis, & the expedition 362 scientists (Eds.), Sumatra Subduction Zone. Proceedings of the International Ocean Discovery Program, (Vol. 362). College Station, TX: international discovery program. https://doi.org/10.14379/iodp.proc.362.202.2019
Bull, J. M., & Scrutton, R. A. (1990). Fault reactivation in the central Indian Ocean and the rheology of oceanic lithosphere. Nature, 344(6269), 855–858. https://doi.org/10.1038/344855a0
Carton, H., Singh, S. C., Hananto, N. D., Martin, J., Djajadihardja, Y. S., Udrekh, et al. (2014). Deep seismic reflection images of the Wharton Basin oceanic crust and uppermost mantle offshore northern Sumatra: Relation with active and past deformation. Journal of Geophysical Research: Solid Earth, 119, 32–51. https://doi.org/10.1002/2013JB010291
Cloetingh, S., & Wortel, R. (1986). Stress in the Indo‐Australian plate. Tectonophysics, 132(1–3), 49–67.
Coudurier‐Curveur, A. (2012), Evolution morpho‐tectonique de la marge de subduction andine, nord Chili, PhD. Thesis. Delescluse, M., Chamot‐Rooke, N., Cattin, R., Fleitout, L., Trubienko, O., & Vigny, C. (2012). April 2012 intra‐oceanic seismicity off
Sumatra boosted by the Banda‐Aceh megathrust. Nature, 490(7419), 240–244. https://doi.org/10.1038/nature11520
DeMets, C., Gordon, R. G., Argus, D. F., & Stein, S. (1994). Effect of recent revisions to the geomagnetic reversal time scale on estimates of current plate motions. Geophysical Research Letters, 21, 2191–2194. https://doi.org/10.1029/94GL02118
Deplus, C. (2001). Indian Ocean actively deforms. Science, 292(5523), 1850–1851. https://doi.org/10.1126/science.1061082
Deplus, C., Diament, M., Hébert, H., Bertrand, G., Dominguez, S., Dubois, J., et al. (1998). Direct evidence of active deformation in the eastern Indian oceanic plate. Geology, 26(2), 131–134. https://doi.org/10.1130/0091‐7613(1998)026<0131:DEOADI>2.3.CO;2 Dugan, B., McNeill, L., Petronotis, K., and the Expedition 362 Scientists (2017), Expedition 362 Preliminary Report: Sumatra Subduction
Zone. International Ocean Discovery Program. https://doi.org/10.14379/iodp.pr.362.2017.
Eittreim, S. L., & Ewing, J. (1972). Mid‐plate tectonics in the Indian Ocean. Journal of Geophysical Research, 77(32), 6413–6421. Fournier, M., Chamot‐Rooke, N., Rodriguez, M., Huchon, P., Petit, C., Beslier, M. O., & Zaragosi, S. (2011). Owen fracture zone: The
Arabia‐India plate boundary unveiled. Earth and Planetary Science Letters, 302(1‐2), 247–252. https://doi.org/10.1016/j.epsl.2010.12.027 Gordon, R. G. (1998). The plate tectonic approximation: Plate nonrigidity, diffuse plate boundaries, and global plate reconstructions.
Annual Review of Earth and Planetary Sciences, 26, 615–642. https://doi.org/10.1146/annurev.earth.26.1.615
Gordon, R. G., DeMets, C., & Royer, J.‐Y. (1998). Evidence for long‐term diffuse deformation of the lithosphere of the equatorial Indian Ocean. Nature, 395(6700), 370–374.
Graindorge, D., Klingelhoefer, F., Sibuet, J. C., McNeill, L., Henstock, T. J., Dean, S., et al. (2008). Impact of lower plate structure on upper plate deformation at the NW Sumatran convergent margin from seafloor morphology. Earth and Planetary Science Letters, 275(3‐4), 201–210. https://doi.org/10.1016/j.epsl.2008.04.053
Hall, C. E., & Gurnis, M. (2005). Strength of fracture zones from their bathymetric and gravitational evolution. Journal of Geophysical Research, 110, B01402. https://doi.org/10.1029/2004JB003312
Hananto, N., Boudarine, A., Carton, H., Singh, S. C., Avianto, P., Dyment, J., et al. (2018). Evidence of pervasive trans‐tensional defor-mation in the northwestern Wharton Basin in the 2012 earthquakes rupture area. Earth and Planetary Science Letters, 502, 174–186. https://doi.org/10.1016/j.epsl.2018.09.007
Hill, E. M., Yue, H., Barbot, S., Lay, T., Tapponnier, P., Hermawan, I., et al. (2015). The 2012 Mw8.6 Wharton Basin sequence: A cascade of
great earthquakes generated by near‐orthogonal, young, oceanic mantle faults. Journal of Geophysical Research: Solid Earth, 120, 3723–3747. https://doi.org/10.1002/2014JB011703
Hüpers, A., Torres, M. E., Owari, S., McNeill, L. C., Dugan, B., Henstock, T. J., et al. (2017). Release of mineral‐bound water prior to subduction tied to shallow seismogenic slip off Sumatra. Science, 356(6340), 841–844. https://doi.org/10.1126/science.aal3429
10.1029/2020GL087362
Geophysical Research Letters
Acknowledgments
This research was partly supported by the Singapore National Research Foundation and Ministry of Education under the Earth Observatory of Singapore Research Center of Excellence initiative. The bathymetric data were acquired during the MIRAGE 1 (Marine Investigation of the Rupture Anatomy of the 2012 Great Earthquake, https://doi.org/10.17600/16003200) experiment in the Wharton Basin. The seismic profiles were acquired during the MEGATERA (Mentawai Gap— Tsunami Earthquake Risk Assessment) experiment (http://www.marine-geo. org/tools/search/entry.php?id= FK150523). We thank Qin Yanfang for processing of the four seismic lines used in this work. The morphologic analyses were performed using the ENVI soft-ware, and the maps andfigures designed using Adobe Illustrator. This work comprises Earth Observatory of Singapore contribution No. 286.
Jacob, J., Dyment, J., & Yatheesh, V. (2014). Revisiting the structure, age, and evolution of the Wharton Basin to better understand subduction under Indonesia. Journal of Geophysical Research: Solid Earth, 119, 169–190. https://doi.org/10.1002/2013JB010285 Klinger, Y., Avouac, J. P., Dorbath, L., Karaki, N. A., & Tisnerat, N. (2000). Seismic behaviour of the Dead Sea fault along Araba valley,
Jordan. Geophysical Journal International, 142(3), 769–782.
Lindsey, E. O., & Fialko, Y. (2013). Geodetic slip rates in the southern San Andreas Fault system: Effects of elastic heterogeneity and fault geometry. Journal of Geophysical Research: Solid Earth, 118, 689–697. https://doi.org/10.1029/2012JB009358
McCaffrey, K. J. W., & Petford, N. (1997). Are granitic intrusions scale invariant? Journal of the Geological Society, London, 154, 1–4. https://doi.org/10.1144/gsjgs.154.1.0001
McNeill, L. C., Dugan, B., Backman, J., Pickering, K. T., Pouderoux, H. F. A., Henstock, T. J., et al. (2017). Understanding Himalayan erosion and the significance of the Nicobar Fan. Earth and Planetary Science Letters, 475, 134–142. https://doi.org/10.1016/j. epsl.2017.07.019
Meng, L., Ampuero, J. P., Stock, J., Duputel, Z., Luo, Y., & Tsai, V. C. (2012). Earthquake in a maze: Compressional rupture branching during the 2012 Mw8.6 Sumatra earthquake. Science, 337(6095), 724–726. https://doi.org/10.1126/science.1224030
Mériaux, A.‐S., Tapponnier, P., Ryerson, F. J., Xiwei, X., King, G., van der Woerd, J., et al. (2005). The Aksay segment of the northern Altyn Tagh fault: Tectonic geomorphology, landscape evolution, and Holocene slip rate. Journal of Geophysical Research, 110, B04404. https://doi.org/10.1029/2004JB003210
Mériaux, A.‐S., van der Woerd, J., Tapponnier, P., Ryerson, F. J., Finkel, R. C., Lasserre, C., & Xu, X. (2012). The Pingding segment of the Altyn Tagh Fault (91°E): Holocene slip‐rate determination from cosmogenic radionuclide dating of offset fluvial terraces. Journal of Geophysical Research, 117, B09406. https://doi.org/10.1029/2012JB009289
Meyer, B., Tapponnier, P., Bourjot, L., Métivier, F., Gaudemer, Y., Peltzer, G., et al. (1998). Crustal thickening in Gansu‐Qinghai, litho-spheric mantle subduction, and oblique, strike‐slip controlled growth of the Tibet plateau. Geophysical Journal International, 135(1), 1–47. https://doi.org/10.1046/j.1365‐246X.1998.00567.x
Minster, J. B., & Jordan, T. H. (1978). Present‐day platemotions. Journal of Geophysical Research, 83(B11), 5331–5354. https://doi.org/ 10.1029/JB083iB11p05331
Peltzer, G., Tapponnier, P., & Armijo, R. (1989). Magnitude of Late Quaternary left lateral displacements along the north edge of Tibet. Science, 246, 1285–1289. https://doi.org/10.1126/science.246.4935.1285
Petroy, D. E., & Wiens, D. A. (1989). Historical seismicity and implications for diffuse plate convergence in the Northeast Indian Ocean. Journal of Geophysical Research, 94(B9), 12,301–12,319.
Prawirodirdjo, P., McCaffrey, R., Chadwell, D., Bock, Y., & Subarya, C. (2010). Geodetic observations of an earthquake cycle at the Sumatra subduction zone: Role of interseismic strain segmentation. Journal of Geophysical Research, 115, B03414. https://doi.org/10.1029/ 2008JB006139
Rahe, B., Ferrill, D. A., & Morris, A. P. (1998). Physical analogue modeling of pull‐apart basin evolution. Tectonophysics, 285, 21–40. Reilinger, R., McClusky, S., Vernant, P., Lawrence, S., Ergintav, S., Cakmak, R., et al. (2006). GPS constraints on continental deformation in
the Africa‐Arabia‐Eurasia continental collision zone and implications for the dynamics of plate interactions. Journal of Geophysical Research, 111, B05411. https://doi.org/10.1029/2005JB004051
Robinson, D. P., Henry, C., Das, S., & Woodhouse, J. H. (2001). Simultaneous rupture along two conjugate planes of the Wharton Basin earthquake. Science, 292(5519), 1145–1148. https://doi.org/10.1126/science.1059395
Royer, J. Y., & Gordon, R. G. (1997). The motion and boundary between the Capricorn and Australian plates. Science, 277(5330), 1268–1274. https://doi.org/10.1126/science.277.5330.1268
Sandwell, D. T. (1984). Thermomechanical evolution of oceanic fracture zones. Journal of Geophysical Research, 89(B13), 11,401–11,413. https://doi.org/10.1029/JB089iB13p11401
Sandwell, D. T., Müller, R. D., Smith, W. H., Garcia, E., & Francis, R. (2014). New global marine gravity model from CryoSat‐2 and Jason‐1 reveals buried tectonic structure. Science, 346(6205), 65–67. https://doi.org/10.1126/science.1258213
Sandwell, D. T., & Schubert, G. (1982). Lithosphericflexure at fracture zones. Journal of Geophysical Research, 87(B6), 4657–4667. https://doi.org/10.1029/JB087iB06p04657
Satriano, C., Kiraly, E., Bernard, P., & Vilotte, J. P. (2012). The 2012 Mw8.6 Sumatra earthquake: Evidence of westward sequential seismic
ruptures associated to the reactivation of a N‐S ocean fabric. Geophysical Research Letters, 39, L15302. https://doi.org/10.1029/ 2012GL052387
Singh, S. C., Carton, H., Chauhan, A. S., Androvandi, S., Davaille, A., Dyment, J., et al. (2011). Extremely thin crust in the Indian Ocean possibly resulting from Plume—Ridge Interaction. Geophysical Journal International, 184(1), 29–42. https://doi.org/10.1111/ j.1365‐246X.2010.04823.x
Singh, S. C., Hananto, N., Qin, Y., Leclerc, F., Avianto, P., Tapponnier, P. E., et al. (2017). The discovery of a conjugate system of faults in the Wharton Basin intraplate deformation zone. Science Advances, 3(1), e1601689. https://doi.org/10.1126/sciadv.1601689
Stein, C. A., Cloetingh, S., & Wortel, R. (1989). Seasat‐derived gravity constraints on stress and deformation in the northeastern Indian Ocean. Geophysical Research Letters, 16(8), 823–826.
Stein C. A., Cloetingh, S. A. P. L., & Wortel, R. (1990), Kinematics and mechanics of the Indian ocean diffuse plate boundary zone. In Proceedings of the Ocean Drilling Program, Scientific Results, 116.
Stein, S., & Okal, E. A. (1978). Seismicity and tectonics of the Ninetyeast Ridge area: Evidence for internal deformation of the Indian plate. Journal of Geophysical Research, 83(B5), 2233–2245.
Sugan, M., Wu, J. E. L., & McClay, K. (2014). 3D analogue modelling of transtensional pull‐apart basins: Comparison with the Cinarcik basin, Sea of Marmara, Turkey. Bollettiino di Geofisica Teorica ed Applicata, 55(4), 699–716. https://doi.org/10.4430/bgta0129 Tapponnier, P., Zhiqin, X., Roger, F., Meyer, B., Arnaud, N., Wittlinger, G., & Jingsui, Y. (2001). Oblique stepwise rise and growth of the
Tibet Plateau. Science, 294(5547), 1671–1677.
Tinnon, M. J., Holt, W. E., & Haines, A. J. (1995). Velocity gradients in the northern Indian Ocean inferred from earthquake moment tensors and relative plate velocities. Journal of Geophysical Research, 100(B12), 24,315–24,329.
Wei, S., Helmberger, D., & Avouac, J. P. (2013). Modeling the 2012 Wharton basin earthquakes off‐Sumatra: Complete lithospheric failure. Journal of Geophysical Research: Solid Earth, 118, 3592–3609. https://doi.org/10.1002/jgrb.50267
Weissel, J. K., Anderson, R. N., & Geller, C. A. (1980). Deformation of the Indo–Australian plate. Nature, 287(5780), 284.
Wiens, D. A., DeMets, C., Gordon, R. G., Stein, S., Argus, D., Engeln, J. F., et al. (1985). A diffuse plate boundary model for Indian Ocean tectonics. Geophysical Research Letters, 12(7), 429–432. https://doi.org/10.1029/GL012i007p00429