Determining the Optimal River Gauge Location for a
Flood Early Warning System in Uganda using HEC-RAS and AHP
By Joyce Cheung
Bachelor of Science in Engineering Science Smith College, 2009
SUBMITTED TO THE DEPARTMENT OF CIVIL AND ENVIRONMENTAL ENGINEERING IN PARTIAL FULFILLMENT OF THE REQUIREMENTS FOR THE DEGREE OF MASTER OF ENGINEERING IN CIVIL & ENVIRONMENTAL ENGINEERING
AT THE
MASSACHUSETTS INSTITUTE OF TECHNOLOGY JUNE 2014
@2014 Joyce Cheung. All rights reserved.
TESS CHETNSTOG E
dR
RA R IE
The author hereby grants to MIT permission to reproduce and to distribute publicly paper and electroniccopies of this thesis document in whole or in part in any medium now known or hereafter created.
Signature of Author:
Signature redacted
U
V
k
Joyce CheungDepartment of Civil and Environmental Engineering May 9, 2014
Signature redacted_
Certified by:
Accepted by:
Richard Schuhmann Senior Lecturer f Civil and Environmental Engineering Thesis Suprvisor
Signature redacted
Heidi 1. Nepf Chair, Departmental Committee for Graduate Students
Determining the Optimal River Gauge Location for a
Flood Early Warning System in Uganda using HEC-RAS and AHP
by Joyce Cheung
Submitted to the Department of Civil & Environmental Engineering on May 9, 2014 in Partial Fulfillment of the
Requirements for the Degree of Master of Engineering in Civil & Environmental Engineering
Abstract
Flooding of the Manafwa River in Eastern Uganda causes significant damage in the district of Butaleja, and often occurs without advance warning. In 2012, the American Red Cross in Uganda requested MIT to develop a flood early warning system (FEWS) that can be used to expedite disaster response in the event of imminent flooding. A minimum flood warning lead time of 2 hours was requested by the American Red Cross. Although there is an existing river gauge situated upstream of Butaleja, at Busiu Bridge, it was not known whether flood warning thresholds from Busiu Bridge could provide an adequate lead time for emergency responses to reach Butaleja. The purpose of this study was therefore (1) to determine the travel time for a flood wave to reach an area of interest in Butaleja (defined by the Red Cross) from Busiu Bridge, (2) to determine the water level at Busiu Bridge that corresponds to subsequent overbank discharge in that region of Butaleja, and (3) to use the Analytic Hierarchy Process (AHP) to integrate stakeholder input with hydrologic and hydraulic modeling results in order to determine the optimal location for an additional river gauge on the Manafwa River upstream of the current gauge at Busiu Bridge. The hydraulic model HEC-RAS was used to simulate the flow of the Manafwa River through Butaleja. Based on flow data from a storm event in 2006 when precipitation was fairly widespread across the watershed, the HEC-RAS results indicated that the travel time for a flood wave at Busiu Bridge to reach Butaleja is 3.4 hours, which provides sufficient warning based upon the Red Cross criteria. It was determined that if the stage at Busiu Bridge reaches 1.90 m, over 70% of the river in the defined area of interest in Butaleja will experience bank-full stage and overbank discharge 3.4 hours later. Given a precipitation event concentrated in the Bududa highlands, the flood wave travel time can diminish to 2.5 hrs if incoming flows increase; therefore upstream gauges were considered to support the gauge at Busiu Bridge. Hydrologic analyses performed by Kaatz (2014) suggested that upstream gauges can be adequately used to forecast floods provided that the
precipitation and river conditions are suitable for a slow-moving flood wave. By integrating the
hydrologic and hydraulic analyses with stakeholder input, installing another river gauge upstream of Busiu Bridge at the Bridge near Bubulo Red Cross (BBRC) would provide additional accuracy and lead time for the flood early warning system. Water level monitoring efforts implemented in Butaleja would validate modeled flooding thresholds reported here.
Thesis Supervisor: Richard Schuhmann
Acknowledgements
I sincerely express my gratitude to everyone who has supported this project. Specifically, I want to thank my thesis supervisor, Dr. Richard Schuhmann for his time and guidance, and especially for challenging me to think critically and write clearly and concisely. I would also like to thank Julie Arrighi, the Country Representative at the American Red Cross in Uganda, for arranging the logistics and
providing invaluable information pertaining to this project. Furthermore, I want to extend my
acknowledgements to members of the Uganda Red Cross Society, namely Shaban Mawanda, Nasa, Tumwa, and Geoffrey, for accompanying us through our field work and participating in the AHP questionnaire. I want to thank Leo Mwebembezi, Frank Kigozi, and Maximo Twinomuhangi of the Ministry of Water and Environment in Uganda; Max Kigobe of Makerere University; and Andrea Schalla of GIZ for collaborating with us on the project. I am also thankful to the local volunteers and residents who assisted with the field measurements.
Special thanks to my colleagues and teammates, William W. Finney Ill and Joel A. Kaatz, for their collaboration, genuine support, and utmost enthusiasm throughout this project. I could not have asked for a better team.
I also truly appreciate the support I received from Dr. Eric E. Adams; Ph.D. candidate Yohannes Gebretsadik; GIS specialist Daniel Sheehan; and librarian Anne Graham.
Last but not least, I am grateful to have the unconditional love and support from my family, friends, and Luisa.
Travel to Uganda was made possible through MIT's Master of Engineering Program in the Department of Civil & Environmental Engineering; MIT's Community Service Fund; and MIT's Public Service Center
CEE-IAP Grant, with financial contributions from alumni, foundations, and partner programs.
Table of Contents
Abstract ... 3
Acknow ledgem ents...5
Table of Contents ... 7 List of Figures...9 List of Tables...10 1 Introduction ... 11 1.1 Study Purpose ... 11 1.2 Study Site ... 11
1.3 Development of a Flood Early Warning System for the Manafwa River Basin...14
2 Flood M onitoring & Flood W arning Lead Tim e... 16
2.1 M eteorological/ Precipitation M easurem ent ... 16
2.2 River Level Observations...17
2.3 Possible River Gauge Locations... 18
2.4 Flood W arning Lead Tim e ... 24
3 Hydraulic M odeling ... 25
3.1 Hydraulic M odel & HEC-RAS Dom ain... 25
3.2 HEC-RAS M odel Setup & Inputs ... 26
3.2.1 F low Data ... 26
3.2.2 Steady-State M odel... 26
3.2.3 Data Preparation...27
3.3 HEC-RAS M odel Sim ulation & Overbank Flooding Threshold... 33
3.3.1 Travel Tim e... 33
3.3.2 Overbank Flow ... 35
3.3.3 Lim itations of the Hydraulic M odel ... 39
4 Selection of an Upstream River Gauge Location ... 41
4.1 Stakeholder Input...41
4.2 Site Criteria...41
4.3 Decision M aking with the Analytic Hierarchy Process (AHP)... 43
4.4 Integration of Hydrologic and Hydraulic Results w ith Stakeholder Input ... 45
6 Conclusion & Proposed Development of the Project ... 50
6.1 Modifications to Hydraulic Model & Thresholds ... 50
6.2 River Network Sensor System ... 50
6.3 Use of Rain Gauges ... 51
W orks Cited ... 52
Appendices...54
Appendix A - Stakeholder Input on Potential River Gauge Locations (Survey Template) ... 55
Appendix B - Cross-Section Geometry Edits in ArcGIS and HEC-RAS... 59
Appendix C - Cross-Section Profiles Measured in January 2014... 63
List of Figures
Figure 1-1: Manafwa River Basin, highlighted in red (Cecinati, 2013)... 12
Figure 1-2: Manafwa River Sub-basins for 2012-2013 (left) and 2013-2014 (right), Kaatz (2014) ... 12
Figure 1-3: Elevation changes as Manafwa River flows from Mt. Elgon and Bududa to Butaleja...13
Figure 2-1: Location of Rain Gauges in the Manafwa River Basin ... 16
Figure 2-2: Location of Existing River Gauge and Map of Potential River Gauge Locations...18
Figure 2-3: Busiu Bridge (top left) and River Gauge (top right and bottom)...19
Figure 2-4: Shikoye Bridge (left) and Mulatski Primary School (right)... 20
Figure 2-5: Uganda Red Cross Society Bubulo Branch (left)...20
Figure 2-6: Uganda Kufu Police Post (top left), Kufu Bridge (top right),... 21
Figure 2-7: Pasa Bridge (left) and the Pasa-Manafwa Junction (right)...22
Figure 2-8 : B uw agogo B ridge ... 22
Figure 2-9 : M ukaya B ridge ... 23
Figure 2-10 : B uw esw a B ridge ... 23
Fig u re 2-11 : Kato B ridge ... 24
Figure 3-1: H EC-RA S D o m ain ... 25
Figure 3-2: Diffusive, Kinematic, and Dynamic Flood Waves (Julien, 2002)... 27
Figure 3-3: HEC-RAS Layers, Created Using HEC-GeoRAS in ArcGIS ... 28
Figure 3-4: Cross-Sections Created in ArcGIS for Input to HEC-RAS ... 29
Figure 3-5b: Cross Section Elevations shown on GoogleEarth ... 30
Figure 3-6a: Geometry Data (Cross-Sections) in HEC-RAS - Plan View ... 31
Figure 3-7: Travel Time from Busiu Bridge to Doho Rice Scheme Headworks in Butaleja ... 33
Figure 3-8: Travel Time from Busiu Bridge to Doho Rice Scheme Headworks in Butaleja...34
Figure 3-9b: Typical Cross-Section in Butaleja ... 36
Figure 3-10: Stage at Busiu Bridge & Flooding in Butaleja for the November 2006 Storm ... 37
Figure 3-11: Selected Rating Curves Generated from HEC-RAS for the 2006 Storm Event...38
Figure 3-12: Stage at Busiu Bridge & Flooding in Butaleja for the Theoretical Storm... 39
Figure 4-1: W eights for Each Rating Criterion ... 43
Figure 4-2: Weighted Ratings for Each River Gauge Site Using AHP; n=9, 22 April 2014 ... 44
Figure 4-3: Matrix Product for Each River Gauge Site Using AHP ... 44
Figure 5-1: Schematic on a possible flood warning sequence ... 47
List of Tables
Table 1-1: Key Features of a Flood Early Warning System (adapted from Sene, 2013, Table 1.5) ... 15
Table 3-1: Estimated Travel Time for a Flood Wave to Reach Butaleja... 34
Table 4-1: Site Criteria for River Gauge... 42
1 Introduction
1.1 Study Purpose
Flooding of the Manafwa River in Eastern Uganda causes significant damage in the district of Butaleja, and often occurs without advance warning. During floods, residents in Butaleja experience property damage, loss of food crops, unsanitary living conditions, and fatalities (IFRC, 2010). There is also limited access for emergency vehicles to enter and provide aid to the community during floods because of damaged roads (IFRC, 2007). To facilitate flood relief responses, the American Red Cross Society in Uganda requested the Massachusetts Institute of Technology (MIT) provide technical expertise in developing a Flood Early Warning System (FEWS) that can be used to expedite disaster response in the event of imminent flooding. The Master of Engineering (M.Eng) Program at MIT undertook and commenced this project in September 2012; project completion is anticipated for May 2015.
In order to develop a flood early warning system, it is critical to understand the hydrologic and hydraulic response of the Manafwa River Basin to precipitation (both spatial and temporal). It is also crucial to obtain input from project stakeholders to establish the key site criteria for selecting an appropriate river gauge location to provide information upon which to base a flood warning. Although a river gauge exists upstream of Butaleja, at Busiu Bridge, it is not currently used to provide flood early warnings; it was not known whether stage measurements at Busiu Bridge could provide an adequate lead time for emergency responses to reach Butaleja. The purpose of this study was therefore three-fold: (1) to determine the travel time for a flood wave to reach an area of interest in Butaleja (defined by the Red Cross) from Busiu Bridge, (2) to determine the water level at Busiu Bridge that corresponds to subsequent overbank discharge in that region of Butaleja, and (3) to use the Analytic Hierarchy Process (AHP) to integrate stakeholder input with hydrologic and hydraulic modeling results in order to determine the optimal location for an additional river gauge on the Manafwa River upstream of the current gauge at Busiu Bridge.
1.2 Study Site
The Manafwa River Basin, located in Eastern Uganda, has a watershed area of 2280 km2
. The watershed is drained by the Manafwa River and its tributaries that originate from the steep slopes of
Mt. Elgon. From Mt. Elgon, the Manafwa River flows westward through the districts of Bududa, Manafwa, Mbale, and Butaleja, and it ultimately discharges into Lake Kyoga (Figure 1-1).
Manefwa River Basin
Figure 1-1: Manafwa River Basin, highlighted in red (Cecinati, 2013)
For this study, the MIT project team in 2012-2013 delineated the Manafwa River Basin into 11 sub-basins. During 2013-2014, sub-basin W-150, as depicted in Figure 1-2, was then further delineated into 6 sub-basins for the hydrologic and hydraulic analyses (discussed in Chapter 3).
Figure 1-2: Manafwa River Sub-basins for 2012-2013 (left) and 2013-2014 (right), Kaatz (2014)
The climate in this region is characterized by a bimodal rainfall pattern, with more pronounced rains from March-April-May, and shorter rains occurring from November-December. The dry season
extends from December through March, and annual rainfall ranges between 1100 mm to 1500 mm (NBI, 2012).
Flooding in the Manafwa River Basin occurs during the wet season because the watershed receives greater amounts of precipitation. When flooding occurs, the river lacks the capacity to convey the extra water, causing the water level to rise and flood over the river banks. Flooding may take place at any point along the river course, but the Red Cross identified the need to monitor floods in downstream districts, and is committed to implement a flood early warning system for Butaleja
(Observer, 2013). In 2010, extensive flooding from heavy rains in Eastern Uganda affected
approximately 6,000 people in Butaleja District (IFRC, 2010). In 2011, a flood in Butaleja claimed 27 lives and affected over 63,000 people (EM-DAT; Cecinati, 2013).
Flood formation in the downstream districts is reported by residents of the region to be primarily caused by precipitation on the slopes of Mt. Elgon. Mt. Elgon is a massive extinct shield volcanic mountain that peaks at 4000 m above mean sea level, standing out amidst the adjacent flatlands that are approximately 1000 m in elevation (Fig. 1-3). This topography induces precipitation along the mountain slopes because of the orographic lifting effect (Cecinati, 2013). Mt. Elgon's steep slopes and its abrupt descent from 4000 m to 1000 m can cause flash floods and landslides to occur in the highlands of Bududa; surface runoff that subsequently flows down the Manafwa River causes overbank flooding in the downstream communities. In particular, flooding can occur 50 km downstream of Bududa in the district of Butaleja, even when there is no precipitation in Butaleja.
Mt. Elgon El. = 4,000m Manofwa River Butoleja El.=a1,000M
Flood waters can cause property damage, displacement from homes, loss of crops and livestock, and in extreme cases can cause fatalities (IRFC 2010). Water overflowing the banks of the Manafwa River and onto roads and bridges causes inaccessibility problems (IFRC, 2007). Additionally, water infiltrating and overflowing latrines can create sanitary health issues (IRFC 2010). While the goal of this project is not flood prevention, having an adequate response time to prepare for a flood can help reduce detrimental impacts to residents. By establishing a flood early warning system, residents can receive advance notice to evacuate if necessary, and the Red Cross can use the lead time to better plan and prepare relief efforts, including organizing search and rescue operations, and preparing food and basic distributions for the affected residents.
1.3 Development of a Flood Early Warning System for the Manafwa River Basin
Flood early warning systems are developed to provide people and organizations with more time to prepare for flooding in order to reduce the risk of property damage and fatality. A flood warning system typically involves a repeated cycle of monitoring, forecasting, warning, and preparation for the community of concern (Sene, 2013). In this process, hydrologic conditions such as rainfall and river levels are monitored to assess the risk of flooding. The hydrologic conditions and observed river levels are then compared to the flood warning threshold, or "trigger" value(s) established with hydraulic modeling. If a flood is forecast, warnings can then be disseminated via telephones and sirens, or via announcements on news broadcasting networks to provide advance notice to local authorities and communities at risk (Sene, 2013). Effectiveness of the warning and response would then be evaluated after the flood to assess whether there should be modifications to the protocol for future events. These
Table 1-1: Key Features of a Flood Early Warning System (adapted from Sene, 2013, Table 1.5)
Item Description/ Options
Both rain and river level/ flow are monitored to determine whether the local conditions pose a flooding
Monitoring (detection, data risk. Telemetered or manual observations are made using
acquisition or data collection) various types of instrumentation such as rain gauges,
weather radar, river level and flow gauges, and/or satellites.
Based on the monitored observations, the timing, location, and magnitude of the floods are forecast.
Specifically, rainfall is forecast through atmospheric
Forecasting models, and floods are forecast through rainfall-runoff
(hydrologic) models and flow routing (hydraulic or hydrodynamic) models.
Once an imminent flood is forecast, the FEWS issues warnings as appropriate, and the Red Cross then
Warning disseminates warnings to communities and local
authorities.
Following the flood event, the Red Cross and associated authorities conduct post-event reviews, performance
Preparation monitoring and reporting, flood risk assessment, flood
response plans, etc. to improve the flood monitoring, forecasting, and warning system.
Although scientific research on flood management in Africa has increased since the 1990s, the number of flood forecasting studies and early warning projects in Africa is limited, and many may not be available to the public (Thiemig et al., 2011). Establishing a flood early warning system in the Manafwa River Basin of Uganda might contribute to the formulation of guidelines for flood forecasting and warning in other areas that experience similar river flooding conditions.
The following chapters discuss the options for flood monitoring and why river gauges were chosen, the use of a hydraulic model to forecast floods in the Manafwa River Basin, and the approach for selecting the appropriate river gauge location(s) with which to provide advance warning of floods. Protocols for issuing flood warnings, preparation, and debriefing are not part of this study, but will be developed by the Red Cross Society, local government, and associated entities that work closely with the districts in the watershed.
2 Flood Monitoring & Flood Warning Lead Time
Typically, meteorological and physical conditions such as the amount of precipitation and the river water level, respectively, are monitored to determine whether a flood alert should be initiated. This Chapter discusses the options for flood monitoring, why river gauges were chosen for this study, and what the minimum flood warning lead time was for designing the flood early warning system for Butaleja.
2.1 Meteorological/ Precipitation Measurement
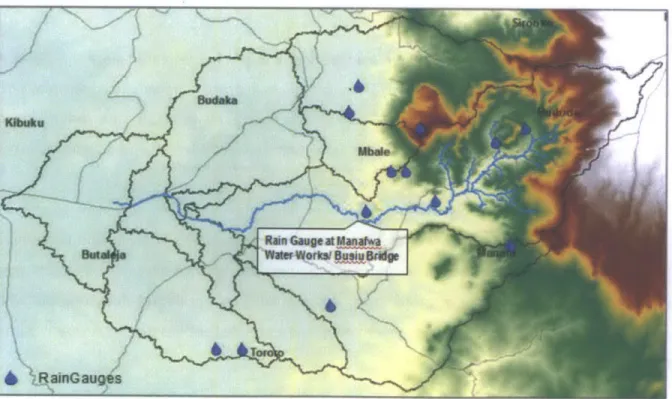
Meteorological and precipitation measurements can be used as flood indicators. A recent case study in the Bicol River Basin of the Philippines demonstrated that a flood early warning system was successfully implemented using 20 manual rain gauges to monitor rainfall (Abon, C. et al., 2012). Although there are 13 rain gauges in the Manafwa watershed (AECOM, 2012), the only rain gauge that is currently operational is a tipping bucket rain gauge installed in 2011 that is located at the Manafwa Water Works of the National Water and Sewerage Corporation in Mbale, adjacent to Busiu Bridge, as shown in Figure 2-1. The rainfall data collected at the rain gauge at the Manafwa Water Works, however, was not reliable (Finney, 2014) and therefore additional rain gauges (along with telemetry or volunteers) would be needed to properly monitor and record the precipitation in the watershed.
Ran Gaup4at Mannwa
2.2 River Level Observations
Although a network of rain gauges or meteorological reports can help forecast floods, measurements of river levels may suffice for flood early warning systems (Fisher et al. 2012). According to Sene (2013), "a typical progression in developing a flood warning system has been to start with a river monitoring-based system, using river gauge observations relayed by observers or telemetry. This has then progressed to make use of rainfall observations and computer-based flood forecasting models". Because the Manafwa River Basin does not currently have a flood early warning system, establishing the optimal location for a river gauge and setting the flood warning threshold level for the gauge is the first step in creating a flood monitoring-forecasting sensor network, and is the focus of this study. A meteorological and precipitation monitoring network can be developed in the future if desired, once the river monitoring system is in place.
The only currently operating river gauge in the Manafwa River Basin is located at Busiu Bridge. Although the Busiu Bridge river gauge is situated upstream of Butaleja, it is not known whether the gauge provides an adequate lead time for people and agencies to provide emergency response. This study therefore aims to determine whether the Busiu Bridge gauge might be employed to provide early flood warning, and also where an additional upstream river gauge would need to be installed in order to better monitor the Manafwa River Basin and provide sufficient lead time to the community of Butaleja.
2.3 Possible River Gauge Locations
In addition to the river gauge at Busiu Bridge, eight (8) possible river gauge locations were identified in January 2014, as depicted in Figure 2-2, and a description of each site is provided in the subsequent sections.
Mbole
EXISTING RIVER GAUGE AT
BUSIU BRIDGE SHK BRIDGE
',BRDGE P16R BUGJLO RED C R
MA %
Figure 2-2: Location of Existing River Gauge and Map of Potential River Gauge Locations along the Manafwa River
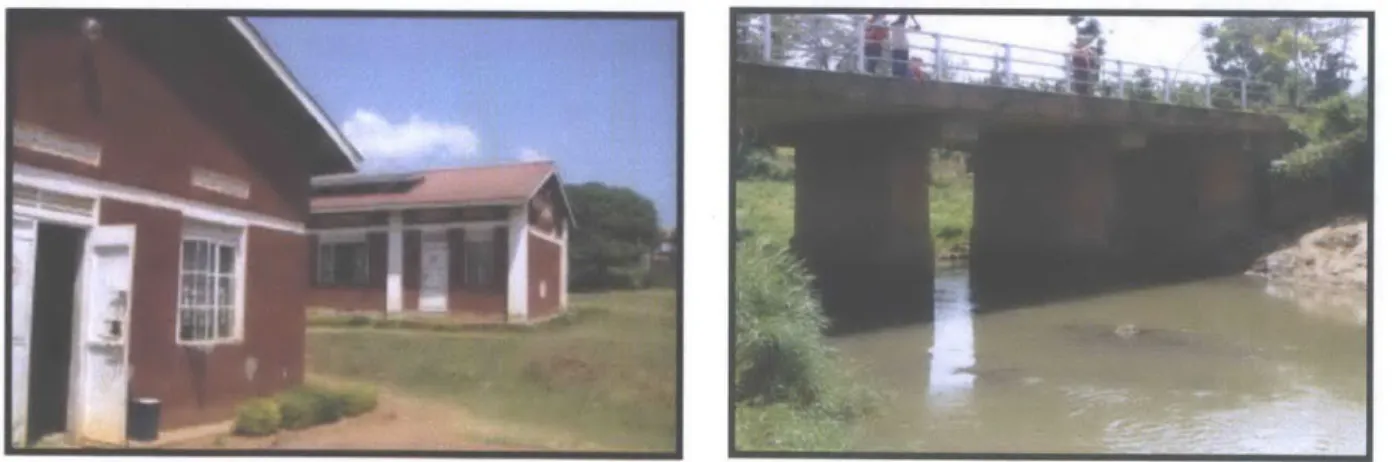
a. Busiu Bridge
At Busiu Bridge, there is an automated gauge as well as a manual gauge. These gauges are located within the secured compound of the National Water & Sewerage Corporation Water Works in Manafwa. The automated gauge is designed to record analog readings every 15 seconds, and the files would be subsequently sent to the Ministry of Water and Environment in Entebbe for digitization; unfortunately this automated gauge is not in operation and therefore manual readings are taken twice each day and averaged. Rating curves for this site were developed to relate river stage to flow rate.
b. Shikoye Bridge
Shikoye Bridge spans across the Manafwa River and a river gauge can be installed at this location to monitor the water level. This site is accessible by both vehicular and foot traffic. The police from the Shikoye Police Post frequently monitor the bridge area. River gauge data can be relayed to the Shikoye Police Post, or to the nearby community of Mulatski Center, where there is a gated primary school, a church, and a secondary school (Figure 2-4).
Figure 2-4: Shikoye Bridge (left) and Mulatski Primary School (right)
c. Bridge Near Bubulo Red Cross
Another possible site for a river gauge to monitor the Manafwa River is at the bridge near the Bubulo Red Cross remote office (Figure 2-5). The Manafwa Police Station in Mayenze and the Bubulo Branch of the Red Cross can provide security and operation and maintenance to the river gauge.
Figure 2-5: Uganda Red Cross Society Bubulo Branch (left) and the Bridge Near Bubulo Red Cross Office (right)
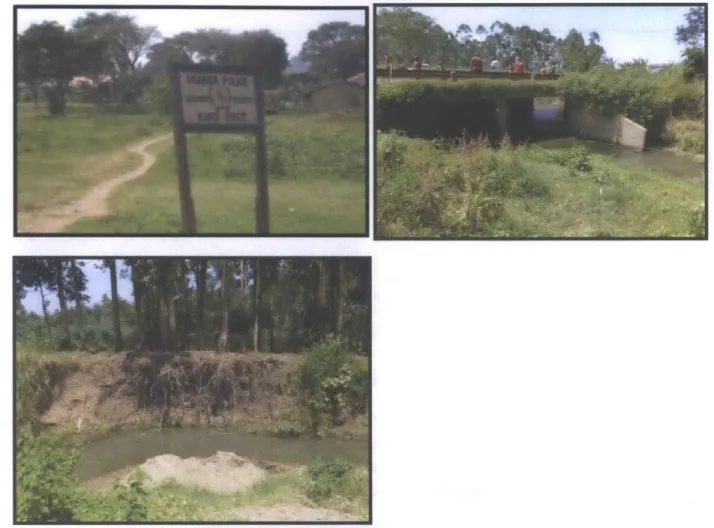
d. Kufu Bridge
The Kufu Bridge is adjacent to the Kufu Police Post. Because Kufu River is a tributary of the Manafwa River, a river gauge at this location may not be a good indicator of flooding in the Manafwa River. Additionally, significant sand-mining activities along the river have eroded the banks.
Figure 2-6: Uganda Kufu Police Post (top left), Kufu Bridge (top right), and sand mining and eroded banks adjacent to Kufu Bridge (bottom)
e. Pasa Bridge & Pasa-Manafwa Junction
Similar to Kufu Bridge, Pasa Bridge spans across a river that is a tributary of the Manafwa River. The Pasa-Manafwa River junction is 120 m from Pasa Bridge. There are no existing structures at the junction, but the Namutembi Police Post is only 170 m away from the Pasa-Manafwa Junction (Figure 2-7).
Figure 2-7: Pasa Bridge (left) and the Pasa-Manafwa Junction (right)
f. Buwagogo Bridge
Buwagogo Bridge (Figure 2-8) is a footbridge that spans across the Manafwa River, and is accessible via a footpath. The Buwagogo Police Post is approximately a quarter of a mile (-400 m) from the bridge.
g. Mukaya Bridge
The Mukaya Bridge is also located in the Town of Buwagogo, and is situated approximately 500 m from the Buwagogo Police Station. A river gauge can be secured onto the abutments of the bridge to monitor water levels of the Manafwa River (Figure 2-9).
Figure 2-9: Mukaya Bridge
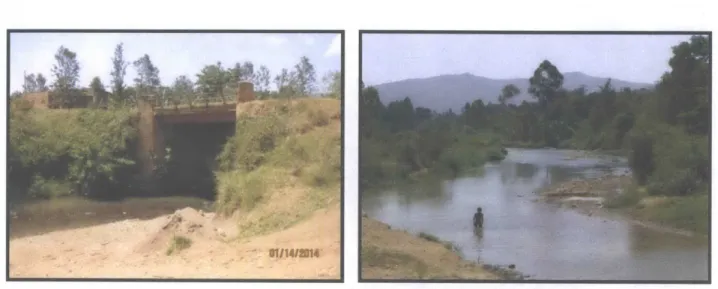
h. Buweswa Bridge
The Buweswa Bridge in Kato spans across the Manafwa River, but the river at this location does not
include flow from smaller tributaries downstream (Figure 2-10). It is approximately % of a mile away
from the nearest police post at Kato.
i. Kato Bridge
Kato Bridge (Figure 2-11) is situated on the Manafwa River, and is in close proximity to a church in Kato, the Red Cross Manjiya Office, and the Kato Police Station.
Figure 2-11: Kato Bridge
2.4 Flood Warning Lead Time
Based on a survey conducted by Thiemig et al. (2011), institutions across Africa indicated that a lead time of 1 to 2 days is desired for flood forecasting and warning; however, to provide this level of advanced forecast requires an intricate network of meteorological and hydrologic monitoring stations. Additionally, there is a tradeoff between increasing the flood warning lead time and decreasing the reliability of the system (Dotson, 1990). If having more lead time is prioritized, then a flood warning signal from a river gauge would be sent when the water is at a lower level than that which is known to cause flooding; however, issuing a warning earlier may create false alarms because there is a probability that the water level might not reach or exceed the river banks. At this early stage of development for the Manafwa River FEWS, a 2-hour flood warning lead time for high confidence flooding was used as the benchmark for this study, as requested by the American Red Cross Society. By installing more river gauges, the flood warning lead time may be increased without compromising accuracy.
3 Hydraulic Modeling
3.1 Hydraulic Model & HEC-RAS Domain
The hydraulic model HEC-RAS (Hydrologic Engineering Center - River Analysis System has been used extensively for flood forecasting initiatives in the United States, as well as in various developing countries, including Sri Lanka, Malaysia, Romania, and India (Mohammed et al., 2011; Nandalal, 2009; Popescu el al., 2010; Prafulkumar et al., 2011). HEC-RAS Version 4.1.0 was used in this study to simulate the flow of the Manafwa River from Busiu Bridge to Butaleja, denoted as the HEC-RAS domain in Figure
3-1.
Budaka
Flooding Area of I
DOHO RICE SCHEME
45 k o River Ln F' I HEC-RAS Domain Wbi EXISTING
RIVER GAUGE AT MOYROE
ID SHKO RIDGE
Dc-B1GEt6 SUOULO RED Cot
SRiver Flow
I
Flood Monitoring Region for Early Warning
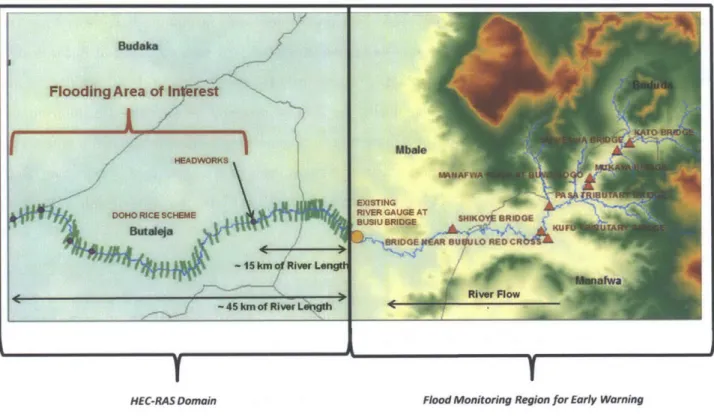
Figure 3-1: HEC-RAS Domain
Based on discussions with the American Red Cross Society, the flooding area of interest was a region within the district of Butaleja, beginning at the Doho Rice Scheme Headworks, and continuing westward until just upstream of the Namatala-Manafwa Junction (0.949N, 33.9406E). The HEC-RAS domain, however, included both the flooding area of interest as well as the section between Busiu Bridge and the Headworks. HEC-RAS was used to simulate flow from Busiu Bridge downstream to determine (1) the travel time for a flood wave at Busiu Bridge to reach the flooding area of interest and
whether this time increment provides sufficient advance warning for the Red Cross, (2) the water level at Busiu Bridge that corresponds to subsequent overbank flow in the flooding area of interest, and (3) whether increased time increments at the other potential river gauge sites (identified in Section 2.3) would provide significantly enhanced advance warning.
3.2 HEC-RAS Model Setup & Inputs
3.2.1 Flow Data
The HEC-RAS model used flow data at Busiu Bridge from two different storm events that were chosen and modeled using the hydrologic model HEC-HMS by Kaatz (2014): an actual storm event in November 2006, and a theoretical storm event that precipitated only in Bududa (sub-basin 6). The November 2006 storm hydrograph was calibrated using measured flow data collected at Busiu Bridge, which accounts for 93% of the basin flow. Kaatz's (2014) analysis indicated that a significant flood wave did not propagate from Kato to Busiu Bridge during the 2006 storm event because the precipitation was rather dispersed throughout the sub-basin. Kaatz therefore generated a hypothetical event where rain was experienced only in the Bududa region; this storm event generated a significant flood wave. Both storm events were evaluated in HEC-RAS to understand how travel times and water levels in Butaleja differ in these two scenarios.
3.2.2 Steady-State Model
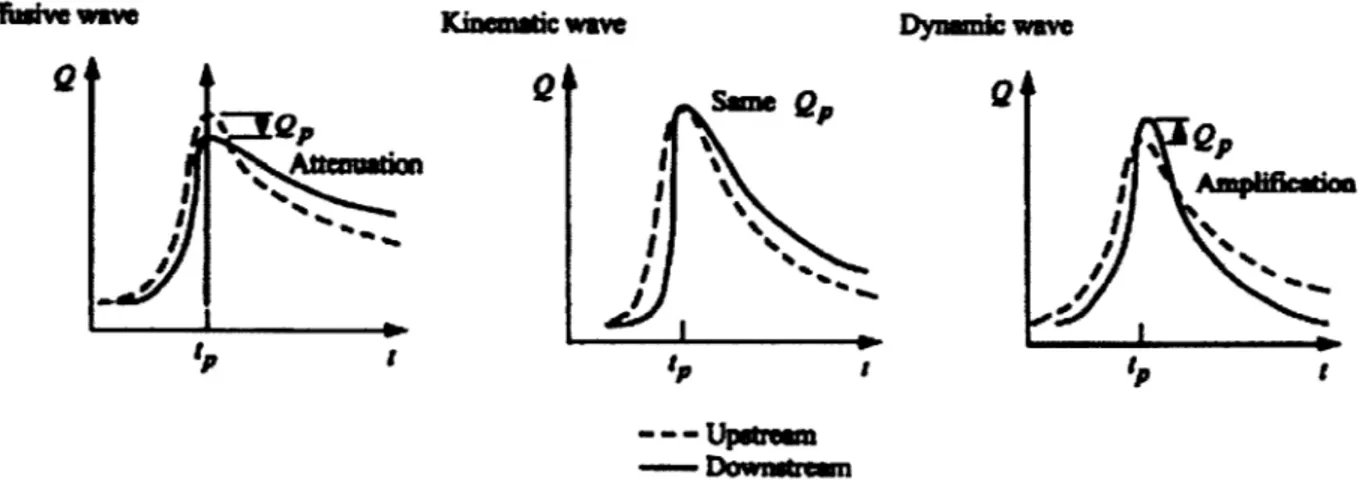
The one-dimensional steady-state model was used in HEC-RAS to calculate flow and water surface profiles. Steady-state flow was applied because the Manafwa River discharge in the HEC-RAS Domain was assumed to be gradually-varied. Gradually-varied flow is appropriate if changes along the channel (i.e. cross-section shape, depth, and velocity) are relatively small over short distances and the changes are not too sudden (Julien, 2002).
Although real-world situations are better represented by unsteady flow, Haestad et al. (2003) indicated that "changes in depth and velocity at a given point normally occur very slowly, even during a flood event," and therefore satisfactory results can be obtained by using a steady flow model. Furthermore, if water accumulated in the Manafwa River was primarily caused by rainfall in the upstream districts (i.e. Bududa), such that there was little or no rainfall in Butaleja, then the discharge would remain relatively constant as the flood wave moves downstream. In this manner, the flood wave
can be assumed to be a kinematic wave (flow does not vary with time) because there are no other sources of water to create a dynamic wave (i.e. amplification, see Figure 3-2).
ffw wn Kinemac wave Dynmin wav
UP
some~
Q
~
e
N N
fp 1p p
--- u-rwn
Figure 3-2: Diffusive, Kinematic, and Dynamic Flood Waves (Julien, 2002)
Whereas the steady-state model uses the continuity and energy equations to solve for the flows of kinematic waves, the unsteady-state model in HEC-RAS utilizes the St. Venant Equation and only calculates the flows for diffusive-waves (Haestad et al., 2003; HEC-RAS 2010). Although a flood wave may attenuate as it moves downstream, storage areas and sinks were not considered in this project. By assuming steady-state and kinematic waves for the HEC-RAS model, the results would provide a more conservative estimate for the bank-full stage and overbank flow.
HEC-RAS performs the steady-state, one-dimensional modeling by solving the continuity and
energy equations, and the energy losses are evaluated by friction using Manning's equation. For
detailed information on the governing equations, please refer to the HEC-RAS Hydraulic Reference
Manual (2010) and Haestad's Floodplain Modeling Using HEC-RAS (2003).
3.2.3 Data Preparation
Simulations in HEC-RAS are highly dependent on the accuracy of the geometry data, and the most pertinent geometry data are the river profiles and the terrain features. To process the geometry
data for HEC-RAS, ArcGIS and HEC-GeoRAS were used. The following sections examine how the
3.2.3.1 ArcGIS and HEC-GeoRAS Processing for HEC-RAS
The location of the Manafwa River was digitized into Open Street Map using GoogleEarth as the reference file and then converted into a shapefile to export into ArcGIS. The digital elevation map (DEM) used for this study had a resolution of 30 m, which does not capture the subtle elevation undulations in Butaleja because the terrain in the HEC-RAS domain is relatively flat. Ideally, a 2-5 m resolution DEM should be used in order to show the depth of the river, which is approximately 3 m deep; however, such a high-resolution DEM was not readily accessible and would be too costly to obtain.
To prepare the geometry file for hydraulic analyses in HEC-RAS, the river and DEM files were pre-processed using HEC-GeoRAS (v. 4.1.0) and ArcGIS (v.10.1). HEC-GeoRAS layers such as the stream centerline, bank lines, flowpath centerlines, and cross-section (XS) cutlines were created in ArcGIS (Figure 3-3). Bridges and obstructions were not included in the geometry file. Details on how to create these features can be found in the HEC-RAS User's Manual (2010).
XS Culine
F1 PathCenterfi
Fan LUine
Stream Centerdine
3.2.3.2 Field Work and River Cross-Sectional Profiles
For the HEC-RAS model, reliable river cross-sections are necessary to simulate flow down the Manafwa River. The river channel geometry (both river bathymetry and river bank slopes) was assessed
through site investigations conducted in January 2014. Five river cross sections were manually
surveyed in Butaleja, and locations of these cross-sections are shown in Figure 3-4. The five field-measured cross-section profiles are also provided in Appendix C.
A total of 73 cross-sections were digitized in ArcGIS, and each cross-section was geo-referenced into the DEM as a river station. Note that the digitized cross sections do not extend across the entire floodplain because the cross-section projections using the DEM would not be accurate. Instead, this study focused on assessing flow in the river and the point of overbank flooding; flood inundation areas were not developed in this study.
Rivwr Cross-ections Taken
DuringFieldVisit Digitized Cov for nptHAS-Hoadwoarks Busiu Bridge Doho Rice Scherne
IS5 kin W ive engttl
Figure 3-4: Cross-Sections Created in ArcGIS for Input to H EC-R AS
Because the DEM did not accurately reflect the terrain in the HEC-RAS domain, the elevations were adjusted using ArcGIS tools (Focal Statistics with cell radius of 2) such that the elevations were more comparable to elevations shown on Google Earth (see Figure 3-5).
1A i7.
1076 Aim I0
Figure 3-5a: Cross-Section using 30 m DEM
Figure 3-5b: Cross Section Elevations shown on GoogleEarth
|- oss o~. | .|
1076 a
1074-400 5.60780 840
Saatio (m)
Using ArcGIS's Raster Calculation Tool, the river was "burned" into the DEM by assigning the average river depth of 3.4 m and width of 20 m, as observed during site investigations. Screenshots of the DEM processing method are available in Appendix B. After the river, DEM, cross-sections, and associated geometric data were modified to reflect observed site conditions, the layers were exported into a file that can be read by HEC-RAS.
3.2.3.3 HEC-RAS Model Conditions
The geometry data from ArcGIS were imported into HEC-RAS and the cross-section five field-measured profiles were input into the model (Figures 3-6a and 3-6b).
data for the
5579.588 W 1 gfA 357. 47p 41637 7 09 2 7 34347B , /L 515.02D3 2%297 3137999 /115(4 1919.e 231711 M4 42799
/7Z
251226 47 /1015442'. l i 1 10323 25W83B3 1277V29 1 ,2 25443Bg .71w .S444? 7-a 241373 F18u.05 197273Di 222 SPFigure 3-6a: Geometry Data (Cross-Sections) in H EC-R AS - Plan View
HEC-RASv7.2 Plan: PlanO1-SteadyFlow_v7.2 4/19/2014
035 04 .045 LeGN d2 EG 18Nov2006 2200 WS 18NOv2006 2200 CrI 18Nov2006 2200 Ground Bank Ste E 1000 1200 1400 1600 600 800 Station (M) 1105. 1100. 200 40
Figure 3-6b: Example Cross-Section in HEC-RAS
11 fvur
The remaining 68 cross-section profiles were obtained through geo-referencing the terrain from the 30 m DEM file. HEC-RAS uses the geometry data to interpolate flow through each cross-section during the simulations.
Prior to running the hydraulic simulation, the flow data, channel resistance, and the boundary
conditions were entered into the HEC-RAS model. The flow data was based on the HEC-HMS
hydrograph outputs developed by Kaatz (2014) for the 2006 storm. A base flow of 8 m3
/s was also assigned to the model to reflect nominal river conditions. This base flow was derived by averaging the flow rates observed at Busiu Bridge during a period when no storms occurred, specifically between November 13, 2006 and November 17, 2006, and between December 9, 2006 and December 12, 2006.
The channel resistance, Manning's Roughness Coefficient n, was also assigned to the river
geometry file. The Manning's n depends on a number of factors, including surface roughness,
vegetation, and channel irregularities. Based on the observed conditions, the Manning's n for the channel was chosen to be 0.040 to reflect a clean, winding channel; the adjacent floodplain was assigned a Manning's n of 0.130 to reflect the river conditions during a flood, where debris and timber are typically flushed down the channel and water flows through the tree line. A general guideline for choosing the appropriate Manning's n is available in the HEC-RAS Hydraulic Reference Manual (2010).
Because there are no rating curves or known water surface elevations upstream of Busiu Bridge, the upstream boundary condition by default was selected to be the critical depth of the river. When critical depth is selected, HEC-RAS calculates the minimum specific energy for each flow rate. The Normal Depth was assigned as the downstream boundary condition for this model, which is approximately equal to the slope of the channel (S=0.00218).
Haestad et al. (2003) indicated that both subcritical and supercritical flow can be experienced during floods; therefore, a mixed flow regime was selected for the simulation. The mixed flow regime computes both a subcritical and supercritical water profile and then reports the higher water surface elevation. Details on the calculations used for the mixed flow regime can be found in Chapter 4 of the
3.3 HEC-RAS Model Simulation & Overbank Flooding Threshold
3.3.1 Travel Time
HEC-RAS was used to assess the travel time for the peak flow to move from Busiu Bridge to the Headworks. As flow increases, the flood wave travel time is expected to decrease, and this inverse relationship can be seen in the results as depicted in Figure 3-7.
E 140 Peak Flow 120 Travel Time 100 80 60 40 20 0 Dt Date 10 9 8 7 6 5 4 3 2 1 0 C M
Busiu Flow -- *-Time from Busiu
Figure 3-7: Travel Time from Busiu Bridge to Doho Rice Scheme Headworks in Butaleja based on the November 2006 Storm Event
The peak flow of 122 m3/s at Busiu Bridge for the 2006 storm event occurred on November 22, 2013.
Based on the HEC-RAS simulation, the travel time for the peak flow from Busiu Bridge to the Doho Rice Scheme Headworks (start of the Flooding Area of Interest) took approximately 3.4 hrs (Figure 3-11), and the river channel velocity was calculated to be 1.28 m/s using the distance between these two points.
This velocity is comparable to the velocity of -1.1 m/s predicted by the HEC-HMS Model developed by
Kaatz (2014), and the slight discrepancy here may be attributed to base flow, which was not accounted for in HEC-HMS.
The inverse relationship between flow rate and travel time is even more pronounced in the theoretical storm event (Figure 3-8).
250 - 10 Peak Flow 200 -4 Travel Time 7 150 6 e E 5 6; E 100 4I 3 50 2 1 0 -- - ,0 11/9/2006 11/14/2006 11/19/2006 11/24/2006 11/29/2006 12/4/2006 12/9/2006 12/14/2006 Date
Busiu Bridge Theoretical Storm - Trave Time
Figure 3-8: Travel Time from Busiu Bridge to Doho Rice Scheme Headworks in Butaleja based on the Theoretical Storm Event
The travel time from Busiu Bridge to the Headworks at the peak flow for this scenario is 2.86 hrs based on a simulation in HEC-RAS. As a comparison, the travel time calculated by Kaatz (2014) from Busiu
Bridge to the Headworks was 2.5 hrs for the theoretical storm event. The ~20-minute difference in the
travel time may be attributed to the river geometry data that was used in the HEC-RAS for the river routing simulation; the difference in travel times is not significant, and both results from HEC-HMS and HEC-RAS provided a good estimation of the flood warning lead time for a flood wave from Busiu Bridge
to reach the Headworks if the peak flow was 207 m3
/s. By factoring in the upstream distances and using the velocity of 1.28 m/s, the estimated travel time for the flood wave of the 2006 storm event to reach Butaleja from four upstream locations (Busiu, Shikoye, Buwagogo, and Kato) is summarized in Table 3-1.
Table 3-1: Estimated Travel Time for a Flood Wave to Reach Butaleja
From Busiu From Shikoye From Buwagogo From Kato
Travel Time, hrs Bridge Bridge Bridge Bridge
November 2006 Storm 3.4 5.4 8.6 9.7
Theoretical Storm* 2.5 4.75 7.25 8.0
* Travel times for the theoretical storm were based off the HEC-HMS model by Kaatz (2014), which were slightly
Based on the HEC-HMS and HEC-RAS simulations, flood monitoring at any of the locations upstream of Busiu Bridge satisfies the 2 hour minimum flood warning lead time requested by the Red Cross. Although the warning lead time can increase by almost a factor of 2 if a river gauge was installed at Kato instead of Shikoye, flood forecast reliability for upstream gauges is dependent on whether the precipitation occurs upstream of the river gauge location and whether the storm is evenly distributed across the basin (Kaatz, 2014). This means that if precipitation occurs at basin 4 and not sub-basin 6 (or if there is more rainfall-runoff entering sub-sub-basin 4 than in sub-sub-basin 6), the upstream
locations of Buwagogo and Kato may not serve as good flood indicators for the FEWS. Chapter 4
Section 4 offers additional discussion of the hydrologic analysis by Kaatz (2014) and how it applies to an upstream river gauge.
3.3.2 Overbank Flow
A steady-state flow simulation was also performed using the discharge hydrograph from Busiu
Bridge to determine when overbank flow begins in the HEC-RAS Domain. The flood warning trigger
point was selected as the water level at Busiu Bridge that corresponded to the overbank flow that occurs 3.4 hrs later in Butaleja (3.4 hrs is the flood wave travel time for the 2006 storm). Figures 3-9a and 3-9b provide a graphical illustration in HEC-RAS of the water level at Busiu Bridge at 3.5 hours before it caused bank-full water height at a cross-section in Butaleja (3.5 hrs was chosen instead of 3.4 hrs as indicated in Table 3-1 because the data output in the HEC-RAS model was in 15-minute increments).
13 L 13 400 Legend EG II/2206 10:30 A WS 1/2206 10:30 A Crt 11/22/06 10:30 A Ground Sank Sta 100 000 Statn (mt
Figure 3-9a: Cross-Section and Water Level at Busiu Bridge that corresponded to 3-9b (XS 47945.8)
.13 +i 04 +I:
400 600 800
overbank flow shown in Figure
EG 11/22f06 2:00 PM WS 11/22106 2:00 PM Cr1 I11/2206 2:00 PM Ground ank Ste 1000 Stnon (M)
Figure 3-9b: Typical Cross-Section in Butaleja
where water level reached river bank height (XS 28512.26)
1150. 1140-1130, 1120' S LU 1088 1085 1084 1083 0 200
-With the peak flow of the 2006 storm occurring on November 22, 2006, the overbank heights in Butaleja were examined between the dates of November 20, 2006 and November 27, 2006 because this was the period within which flooding was expected to occur. Any cross-section within the HEC-RAS domain that had water levels exceeding the river bank height during this time period was categorized as a flooded cross-section. Based on the HEC-RAS simulation, 74% of the cross-sections in the HEC-RAS domain experienced a water level that was at or exceeded the river bank height when the stage at Busiu Bridge 3.5 hours earlier was at 1.90 m above the river bed, as shown in Figure 3-10.
2.0 100% 1.8 90% A 1.6 80% E 1.4 70% E 1.2 60% S1.0 50% 65 0.8 40% 0.6 30% 0 0.4 20% A U. 0.2 10% 0.0 0%
iM Stage
amePercentof
Cross-Sections within HEC-RAS Domain that experience flooding Figure 3-10: Stage at Busiu Bridge & Flooding in Butaleja for the November 2006 StormUsing the rating curve for Busiu Bridge generated from this model (shown in Figure 3-11), a stage of 1.90 m (water surface elevation of 1112.21 m AMSL) corresponds to a flow of 89 cubic meters per second at Busiu Bridge. This stage of 1.90 m was seen 3.5 hrs before water levels in the cross-sections in Butaleja were at bank height; therefore a stage reading of 1.90 m at Busiu Bridge can be an indication that regional overbank discharge may occur 3.5-hrs later in Butaleja, and can therefore be used as the flood warning threshold.
1115 1110 1105 1100 1095 - Busiu Bridge (XS47945.8) -XS 47068.84 - XS 46875.27 - XS 46279.99 - XS 45064.23 XS 44741.25 - XS 44424.66 -XS 43556.35 - XS 42594.18 - XS 42325.32 XS 41810.08 - XS 41637.6 - XS 41135.61 XS 40868.18 XS 40400.33 XS 39850.73 XS 38890.84 1090 0 50 100 150 Flow, m3/s
Figure 3-11: Selected Rating Curves Generated from HEC-RAS for the 2006 Storm Event
A similar process was performed for the theoretical flow (i.e. precipitation confined to sub-basin 6) to determine when overbank flow begins in the HEC-RAS Domain; the results were: 74% of cross-sections in the HEC-RAS Domain overflowed when the water level at Busiu Bridge is at 1.91 m, and 81% of the cross-sections in the HEC-RAS Domain overflowed when the water level at Busiu Bridge was at 2.18 m. These water levels were observed 2.5 hrs (theoretical travel time) before the cross-sections in Butaleja were at bank height. The theoretical storm, however, had flows greater than the 2006 storm, and therefore the travel time decreased and more cross-sections had water levels that exceeded the bank heights, resulting in flooded cross-sections for consecutive days (Figure 3-12).
E
2.5 100% 90% 2.0 80% 70% E 1.5 60% 9 50% 011.0 40% 30% L 0.5 20% a 0 10% I 0.0 0%
Stage, metersabove river bed % XSin HEC-RAS Domain that Experience Flooding
Figure 3-12: Stage at Busiu Bridge & Flooding in Butaleja for the Theoretical Storm
Using the November 2006 storm, it can be suggested that approximately 70% of the cross-sections in Butaleja will experience bank-full stage or overbank discharge approximately 3.4 hours subsequent to the stage at Busiu Bridge reaching 1.90 m. As a result, it is recommended that monitoring efforts are performed at Busiu Bridge and a flood warning alarm is disseminated when the stage reaches 1.90 m above the river bed (flow of 89 m3
/s); however the flows would need to be monitored or the nature of the precipitation event subjectively evaluated in order to determine whether the travel time will be shortened, as seen with the simulation using the theoretical storm.
3.3.3 Limitations of the Hydraulic Model
The hydraulic model results indicating that the river gauge at Busiu Bridge can provide a warning lead time of at least 3.4 hours before the flood wave reaches Butaleja was based on the 2006 storm event that had a maximum flow rate of 122 m3/s at Busiu Bridge; a theoretical storm with a peak flow of 207 m3
/s at Busiu Bridge produced a 2.5 hour travel time. Because travel time decreases as flow increases, if a higher flow rate is experienced at Busiu Bridge, then the time it takes for the flood wave to reach Butaleja would decrease. The model also does not factor in precipitation in Butaleja or any flows from adjacent downstream districts that may discharge into the Manafwa River within the HEC-RAS Domain; base flow and consequently the percent of area flooded in the area of interest may increase if there are additional flows entering the Manafwa River.
in the hydraulic model, field verification is recommended to ensure that the selected stage at Busiu Bridge can reflect the bank-full stage at the region if interest in Butaleja. This can be done by continuing collection of stage data at Busiu Bridge, installing a river level gauge in Butaleja to observe corresponding flood water heights, as well as installing an additional river gauge upstream of Busiu Bridge. Installing a river level gauge in Butaleja where floods have historically occurred would provide a means of calibrating the model; readings from a river level gauge in Butaleja would field-verify whether the flood warning threshold at Busiu Bridge needs to be adjusted. On the other hand, installing a river gauge upstream of Busiu Bridge would provide additional lead time for flood warnings, and would also serve as an early indicator of when the flows at Busiu Bridge should be critically monitored.
Chapter 4 discusses the selection of an appropriate location along the Manafwa River for a river gauge, and Chapter 5 provides a guideline on how and when a flood warning should be issued to Butaleja.
4 Selection of an Upstream River Gauge Location
A gauge placed upstream of the gauge at Busiu Bridge can provide additional accuracy and lead time for the flood early warning system, and can be used to forecast floods provided the precipitation and river conditions are suitable for a slow-moving flood wave (Kaatz, 2014). Although guidelines exist for the design of sensor networks for flood early warning systems (NOAA, 2010), the development of methods to optimize river gauge locations and densities is a topic that has not been thoroughly researched. This Chapter incorporates the hydrologic and hydraulic findings with stakeholder input to identify an appropriate location to install an additional river gauge for flood monitoring.
4.1 Stakeholder Input
The critical factors in selecting the optimal river gauge site were articulated by the stakeholders of this project through a questionnaire. A copy of the questionnaire template is provided in Appendix A. The primary stakeholders identified for this project include the American Red Cross Society, the Uganda
Red Cross Society, and the Ministry of Water & Environment in Uganda. Representatives from these
organizations who participated in the questionnaire include Nassar Abud, Julie Arrighi, Frank Kigozi, Shaban Mawanda, Leo Mwebembezi, Maximo Twinomuhangi, and Tumwa Wanambwa. Additional input was received from Max Kigobe (a faculty member at Makerere University in Uganda who specializes in hydraulics and remote sensing) and Andrea Schalla (a GIZ technical advisor to the Kyoga Water Management Zone in Mbale).
4.2 Site Criteria
Stakeholder input was necessary to determine possible locations as well as to identify the critical factors in selecting the river gauge site. Based on conversations with the stakeholders and feedback obtained from the questionnaire, the site criteria in choosing the river gauge site include: Accessibility, Security, Operation & Maintenance, Capital Costs, Suitability of River Channel, and Community Awareness; these criteria are summarized in Table 4-1, and each survey participant rated the importance of each criterion.
Table 4-1: Site Criteria for River Gauge
Site Criteria Site Considerations
Accessibility- Does the site allow good vehicular access and walkable connections to the Manafwa River?
Security- Is there close proximity of an office/police post/ school/ church to monitor
and prevent vandalism of the monitoring station?
- Are operation and maintenance practices at this site feasible?
Operation & - Will the river gauge be easy to maintain at this site?
Maintenance - Are there cellular service/ utilities for data transfer?
- Are there Red Cross volunteers nearby to monitor whether or not the river
gauge is operating, or to aid in transfer of data to MoW&E? - How much construction work is needed for this site?
- What is the cost to connect the monitoring station to electric utilities or
Capital Costs install solar panels?
- Is there a need to build additional fencing for security measures? - Are easements necessary for the property?
- Does the site provide a straight section of the channel with a stable bank?
Suitability Is there minimum soil erosion and silt deposition?
- Is the site directly on the Manafwa River, and not located on a tributary (reliability of flood forecast)?
Community - Is the community well-informed and willing to cooperate to allow the
Awareness monitoring station to be sustainable?
For suitability considerations, Mwebembezi (2014) indicated that it is important to select a location where the river channel is straight for at least 20 meters upstream and 10 meters downstream of the river gauge location. A straight river channel is necessary to prevent turbulent conditions which can cause spikes in measurements. Structures such as bridges and abutments can also help minimize turbulence and provide a controlled river section for the gauge. As for the stability of the banks, it is important that there is no deposition in the river because buildup underneath the gauge would cause the apparent river level to rise, which would trigger a flood alarm when there is no threat. Likewise, if the channel is eroded, the water will disperse along the banks, which may cause flooding in downstream districts before a flood warning threshold is reached.
The stakeholders also emphasized the need to prevent theft and vandalism to the river gauge. While there have not been any instances of theft and vandalism associated with the installations at Busiu Bridge, the solar panels installed at the telemetry station for the Namatala River were vandalized.
The Busiu Bridge telemetry station may not have issues with vandalism because the installations are located in the National Water & Sewerage Corporation Water Works where there is security. The equipment on the roof of the Red Cross office in Bubulo has also remained intact. If the installations are near public places (e.g. district headquarters, utility offices, at a road bridge with police posts etc.), there may be added security. Having community involvement and public awareness would also provide some additional protection because informed residents and locals may help report or discourage wrongdoings; therefore, it is important to consider communities that are receptive to flow monitoring to ensure that the installations are sustainable.
4.3 Decision Making with the Analytic Hierarchy Process (A HP)
The location for a river gauge upstream of Busiu Bridge was chosen and justified using a multi-criteria approach, namely the Analytic Hierarchy Process (AHP). The AHP, developed by Saaty (1994), is a decision-making tool used to organize multiple criteria associated with options in order to quantitatively assess those options and formally make a selection or decision.
By arranging the decision criteria (site selection criteria discussed in Section 4.2) and the eight river gauge location options (Chapter 2 Section 3) in a hierarchic structure, the relative importance (weights) of each criterion was then ranked by pair-wise comparisons with respect to the importance of the river gauge location. Based on the pair-wise comparisons, suitability of the river channel was rated the most important criterion relative to the other selection criteria (Figure 4-1).
0.25 0.198 0.20 0.176 0.176 0.178 0.15 0.1430.130 .. 0.10 0.05 0.00
Accessibiity Security O&M Capital Suitabity Community
Costs Awareness
Eigenvectors were then developed for each criterion (see Appendix D for exact values), and the river gauge location options were ranked against each criterion (Figure 4-2).
1.2 1.0
0.8
0.6 0.4 0.2 -U 0.0 1\of9
0 '3a~ 4b w Accessibilitya
Capital Costs * Security a Suitability * Operation& Maintenance m Community AwarenessFigure 4-2: Weighted Ratings for Each River Gauge Site Using AHP; n=9, 22 April 2014
The final ratings for each site were then established by obtaining the matrix product of the weights for each selection criterion with the ratings for each river gauge site (Figure 4-3).
0.165 0.149 0.133 0.085 0.083 0.074 0.150 0/ . .4 I . S 4Y
Figure 4-3: Matrix Product for Each River Gauge Site Using AHP
.r
Ud 4d 'pe 0.160 0.20 0.18 0.16 0.14 0.12 0.10 0.06 0.06 0.04 0.02 0.0 4I a C9 cc 4 0~ e dBased on stakeholder input and analysis with the AHP, the Bridge near the Bubulo Red Cross office (BBRC) was identified to be the optimal location (in terms of the site selection criteria) to install a secondary river gauge to monitor river flow (Figure 4-2).
If for any reason the site at BBRC is deemed unsuitable for a river gauge, it is advised that Shikoye Bridge should not be the chosen even though it is rated as the second best alternative using AHP. Note that the selection criteria in Table 4-1 focused on the physical and socioeconomic factors of installing a river gauge, but did not account for sociopolitical aspects. Through the questionnaire, the stakeholders provided invaluable insight on the sociopolitical concerns. Specifically, Shikoye Bridge is situated in the district of Mbale, where the government of Uganda had previously initiated proposals to build a dam for flood mitigation purposes. Although the dam project has now been halted, strong opposition to river-related projects remains in the community, and installing a river gauge in Mbale is not ideal at this point; therefore Shikoye Bridge should not be considered unless sociopolitical tensions ease.
4.4 Integration of Hydrologic and Hydraulic Results with Stakeholder Input
The Bridge near Bubulo Red Cross (BBRC) office was the optimal river gauge location in terms of meeting the site selection criteria as identified by the stakeholders, as well as satisfying the hydrologic
and hydraulic parameters. Based on the hydrologic analysis performed by Kaatz (2014), an upstream
river gauge for flood warning can be installed at BBRC because (1) many precipitation events occur upstream of BBRC in the highlands near Bududa, which therefore allows the peak flows to accumulate in the Manafwa River prior to flowing through the river gauge at BBRC, and (2) there is high flow resistance
in the channel at this location because the site is located outside the foothills of Mt. Elgon in which the terrain has a "gradual slope," and the channel has a high Manning's n from the meandering nature of the river and the cultivated lands that are adjacent to the river. Kaatz (2014) explains that these two conditions are critical to enable the flood wave to move slowly downstream such that there is sufficient warning lead time to the downstream communities, and that the peak flows can pass through the river gauge at BBRC. Furthermore, BBRC is located between Shikoye Bridge and Buwagogo Bridge, and would therefore be able to provide a flood warning lead time of approximately 7 hrs before the flood wave reaches the Headworks. Installing a river gauge in BBRC will not only allow more flood warning lead time, but it will also work in conjunction with the river gauge at Busiu Bridge to provide additional accuracy for flood warnings.