Development of MIST-IR: Multi-Spectral Infrared
Thermography
by
Andrew Jonathan Richenderfer
Submitted to the Department of Nuclear Science and Engineering
in partial fulfillment of the requirements for the degree of
MASSACHUSETTS NSTITUTE
Master of Science in Nuclear Science and Engineering
TECH
at the
MAY 1 12016
MASSACHUSETTS INSTITUTE OF TECHNOLOGY
LIBRARIES
June 2015
ARCHM
@
Massachusetts Institute of Technology 2015. All rights reserved.
Signature
redacted
A u th o r ... ...
...
Department o N
lear Science and Engineering
I-
May 22, 2015
Signature redacted
My2,21
C ertified by
...
...
___00,7
--C i
by
JXcopo Buongiorno
Associate Professor of Nuclear Science and Engineering
Signature redacted
Thesis Supervisor
C ertified by
....
...
Thomas McKrell
Research Scientist for Nuclear Science and Engineering
Thesis Supervisor
Acepedby.Signature
redacted
Accepted by ...
...
Mujid Kazimi
TEPCO Professor of Nuclear Engineering
MITLibraries
77 Massachusetts Avenue
Cambridge, MA 02139 http://Iibraries.mit.edu/ask
DISCLAIMER NOTICE
Due to the condition of the original material, there are unavoidable
flaws in this reproduction. We have made every effort possible to
provide you with the best copy available.
Thank you.
The images contained in this document are of the
Development of MIST-IR: Multi-Spectral Infrared
Thermography
by
Andrew Jonathan Richenderfer
Submitted to the Department of Nuclear Science and Engineering on May 22, 2015, in partial fulfillment of the
requirements for the degree of
Master of Science in Nuclear Science and Engineering
Abstract
In this thesis, I present a new diagnostic technique for interrogating boiling heat transfer phenomena. The technique, called Multi-Spectral Infrared Thermography or MiST, builds on previous diagnostic techniques for measuring the 2-D wall tempera-ture distribution or the 2-D phase distribution of the fluid above the surface. These methods make use of infrared thermography, a well developed practice involving the use of a high-speed infrared camera to collect visual data. By analyzing the data with both qualitative and quantitative tools, insights into boiling heat transfer mech-anisms can be gained. In addition to the MiST technique, a refined infrared camera calibration model is presented for accurately determining the wall temperature.
MiST is a new technique that allows for the simultaneous measurement of both the temperature distribution and the phase distribution. This is in sharp contrast to previous techniques which have only allowed the measurement of one or the other. MiST uses a highly engineered, semi-transparent, thin-film heater to enable the si-iultaneous measurement of the two properties. The heater separates the two signals, one from the temperature and one from the phase, by taking advantage of two re-gions of the electromagnetic spectrum. By spectrally separating the two signals, no limitation in resolution or field of view is made.
The refined camera calibration model presented builds on previous work, which quantified the radiation captured by the camera and used a coupled radiation and conduction model to back out the complete axial temperature distribution within the heater. The new model refines the older version by taking into account spectrally varying optical properties within the heater. The spectral data is easily acquired with a Fourier transform infrared spectrometer, and fed into the radiation model for enhanced accuracy.
The development of MiST presents new opportunities in boiling heat transfer for insight into a complex phenomena. The use of MiST in boiling and condensation experiments will lead to the development of new heat transfer models, and can provide high-resolution data for computational fluid dynamics models. MiST presents the logical progression forward in boiling diagnostic tools as it provides enhanced data
acquisition opportunities when compared to it's legacy versions.
Thesis Supervisor: Jacopo Buongiorno
Title: Associate Professor of Nuclear Science and Engineering
Thesis Supervisor: Thomas McKrell
Acknowledgments
I would like to thank my advisor, Professor Jacopo Buongiorno for all of his time and patience as I developed as a researcher. His input and guidance throughout this project was a tremendous help and his support and understanding through difficult stretches was very much appreciated. I have truly learned more than I could have imagined in only a few short years.
To Dr. Tom McKrell, I owe a enormous debt of gratitude for several afternoons of brainstorming, many long days of troubleshooting and for the guidance and wisdom he provided throughout the course of my research. It was a pleasure working with him, and learning a surprising number of engineering skills from his expertise.
I would also like to extend a great deal of gratitude to Dr. Matteo Bucci. His input was vital in the progression of this work and it was a pleasure to work with him every step of the way. He provided wonderful advice when needed, but also made several days much more enjoyable with an exceptional sense of humor. I will always remember explaining the complexities of the english language and what a Slurpee is. To my office mates Carolyn Coyle, Melanie Tetreault-Friend and Guanyu Su, thank you for brightening every day and, at times, reminding me how to have fun. They have provided the perfect balance of knowledge and enjoyment over the past two years and I'm so glad to have worked with them. I owe them a great deal of gratitude for putting up with my constant quals neuroses and ignorance of good maple syrup. To the members of my research group, Bren Phillips, Eric Forrest and Reza Az-izian, you have been a tremendous help. I would honestly be as lost as the day I walked into the lab without you. Thank you for all your help and guidance through-out these years.
There are numerous teachers, professors, advisors and friends to list that helped me get to where I am. To my many friends at Harley, Case Western, MIT, University of Rochester and General Atomics, thank you for all your help a support. I'd especially like to send a great deal of gratitude to Greg, John, Jacquie, Steph and Lauren. Thank y.ou all for what was the greatest time of my life.
Lastly, I'd like to thank my family. Mom and Dad, you have given me the courage to always challenge myself and the heart to never stop trying. Thank you for all the long nights, the endless road trips, the countless soccer games and for always being there. Laura, you have always been there for me. I always looked to you for guidance and support. Even when I was your dorky little brother, I could always come to you. I couldn't have become a "mad scientist" without you. And Amy, thank you for sticking with me through the good times and bad. There were many long nights and plane flights, but you were always there for me. Thank you for being so supportive, I could not have done this without you.
Contents
1 Introduction
1.1 Motivation . . . .
1.2 Objective . . . .
2 Background and Previous Research
2.1 Boiling Theory . . . .
2.1.1 Nucleation . . . .
2.1.2 Heat Transfer . . . .
2.2 Blackbody Radiation Theory . . . .
2.3 Infrared Thermography . . . .
2.3.1 Previous Infrared Thermography Applications
3 Experimental Methods
3.1 Pool Boiling Facility...
3.2 Pool Boiling Heaters . . . .
3.3 Infrared Cameras . . . ..
3.4 Fourier Transform Infrared Spectrometer
4 Heater Design
4.1 Design Constraints . . . .
4.2 Heater Designs...
4.2.1 Checkerboard Pattern . . . .
4.2.2 Dielectric Filter on Silicon . . . .
7 15 15 16 17 17 17 20 21 24 24 29 29 31 33 34 37 37 40 40 42
4.2.3 Frequency Selective Surface on Silicon . . . . 44
4.2.4 Semi-Transparent Indium Tin Oxide on Sapphire . . . . 48
4.2.5 Drude Theory . . . .. 51
5 Infrared Camera Calibration 55 5.1 Calculating the Photon Flux . . . . 58
5.1.1 View Factor . . . . 60
5.2 Radiation Model for IR Camera Calibration . . . . 61
5.3 Heat Conduction Model for IR Camera Calibration . . . . 70
5.4 IR Camera Calibration Summary . . . . 76
6 MiST Experiment 77 6.1 MiST Experimental Apparatus . . . . 77
6.2 Spectral Beamsplitter . . . . 80
6.3 M iST Test . . . . 83
6.4 MiST Results . . . . 84
6.5 Refinement of the MiST Technique . . . . 87
List of Figures
2-1 Example of bubble growth cycle . . . . 19
2-2 Characteristic boiling curve, adapted from [9J . . . . 20
2-3 Spectral intensity of a blackbody emitter at 373 Kelvin and 300 Kelvin.
The vertical lines indicate the approximate working wavelengths for
mid-wave IR cameras . . . . 23
2-4 This picture shows the interference pattern emerging from a thin film
of water. Two strips of silicon were placed on either side of the water,
with the top piece placed at a very small angle. . . . . 26
2-5 This graph shows how the camera counts vary with the interference
pattern. The slope of the film thickness can be determined by
measur-ing the spacmeasur-ing between the peaks of the interference pattern. .... 27
3-1 A schematic of the pool boiling facility used, adapted from [141. The
actual camera setup differs from that shown in the figure, see Section
6-1 . . . . 30
3-2 Schematic drawing of the ITO heater used. The ITO was deposited by
Diamond Coatings Ltd. and the SWP filter was deposited by Andover Corp. The top figure is the top view, the bottom figure is the lateral
view . . . . 32
3-3 A picture of the apparatus setup including both IR cameras (FLIR
front-left, IRC back-right), the PBF (top) and the FLUKE blackbody (right) . . . . ... . . . . 34
4-1 Schematic of checkerboard heater design. The yellow squares are an
opaque film placed on the doped silicon . . . . 41
4-2 Demonstration of how multiple signals can be incident on a single
cam-era pixel. . . . .. . . . . 42
4-3 Schematic of the dielectric heater design . . . .. . . . . 43
4-4 Graph comparing the number of IR counts vs. temperature for
stan-dard ITO and a dielectric filter . . . . 45
4-5 Schematic of cross-hatched pattern heater. The patterns are quantified
by the pitch, L, thickness t and width a. The patterns are etched into
a metallic film which is deposited atop an IR transparent substrate. . 47
4-6 Graph showing the change in transmission of ITO and ITO with the
dielectric filter deposited on top. . . . . 49
4-7 Schematic of the heater design used for the MiST experiment. The
ITO was deposited by Diamond Coatings Ltd. and the SWP filter was
deposited by Andover Corp. . . . . 50
4-8 Graph of theoretical transmission and reflection curves for ITO films
with varying carrier density. As the film becomes more conductive, the plasma frequency shifts to lower wavelengths and the transmission
decreases. Here, n is the carrier density . . . . 53
5-1 Overall schematic of calibration problem and solution sequence. . . 57
5-2 Schematic of the dark current test. The opaque greybody blocks the
radiation from atmospheric emission. The greybody does not emit a significant signal compared to the dark current contribution because
of it's low temperature (T) and low emissivity (f). . . . . 59
5-3 Schematic detailing the propagation of photons through the sapphire substrate. The apparent transmissivity can be calculated by
determin-ing the value of the inifinte series. Adapted from [241 . . . . 63
5-4 Results of conduction code for a linear initial temperature distribution. 73
5-6 Graph of normalized heat flux comparing the axial and horizontal con-duction in the sapphire heater. The horizontal heat flux is of the same order of magnitude as the axial heat flux, thus a 3-D conduction code
should be used to account for the horizontal conduction. . . . . 75
6-1 Schematic of the overall experimental apparatus used for the MiST
experiment. The data from each camera is sent into the respective
analysis tools and the final result is produced. . . . . 79
6-2 Graph of spectral beamsplitter transmission curve. The beamsplitter
was provided by Andover Corp . . . . . . 82
6-3 This figure demonstates the capabilities of the MiST experiment. The temperature and phase distributions were measured simultaneously
and are plotted together here. .The top montage shows the 2-D wall
temperature distribution, the bottom montage shows the 2-D phase distribution of the fluid above the heated surface. The temperature
scale is provided on the right of the images. . . . . 86
List of Tables
4.1 Table of heater design criteria . . . . 39
Chapter 1
Introduction
1.1
Motivation
Nucleate boiling is a very effective form of heat transfer due to the energy required to vaporize the fluid. Boiling heat transfer has numerous applications including refriger-ation, micro-electronic cooling systenis and, in particular, power generation systems where boiling is used to generate steam to drive a turbine. Nuclear reactors have im-plemented boiling heat transfer in the majority of the current fleet of reactors either in the core, in the case of boiling water reactors, or in the steam generator, in the case of pressurized water reactors. Despite its wide use and adaptation, the models used to describe bubble nucleation are rudimentary. This is due to the complexity and intricacies involved in bubble nucleation and growth. Bubble formation occurs on very fast and small scales, on the order of milliseconds and microns to millimeters
[1}. This unique combination of small and fast scales makes visualization of boiling
challenging.
To aid in the investigation of nucleate boiling, many researchers have used high-speed visualization techniques to capture the ebullition cycle [2]. These techniques led to the initial rudimentary mechanistic models used to describe bubble nucleation and boiling heat transfer mechanisms. In order to further research in to bubble nucleation and boiling heat transfer, advanced diagnostic techniques will need to be developed to interrogate all aspects of boiling phenomena. The data gathered using such techniques
can be applied to advanced mechanistic boiling models, computational fluid dynamics calculations and to further our understanding of bubble nucleation and boiling heat transfer.
1.2
Objective
The objective of this research is to develop a new diagnostic technique to interrogate bubble nucleation and boiling heat transfer. Previous techniques have employed in-frared (IR) thermography, the imaging of a sample using an IR camera, to interrogate
a boiling surface [3, 4, 5, 6, 7, 81. The goal of the new technique is to simultaneously
measure both the 2-D wall temperature distribution as well as the 2-D phase distri-bution of the fluid above the heated surface. Simultaneously measuring temperature and phase will enable the coupling of the local heat flux with the local heat trans-fer mechanism, which is determined inter alia by the phase existing directly above the surface. This data will provide valuable insights into boiling heat transfer and the mechanisms by which boiling removes energy from the heated surface. Such a technique could also be applied to several phase change applications including, pool and flow boiling, film boiling, critical heat flux and quenching. The data gathered from such applications could then be utilized to create advanced mechanistic boiling models. Additionally, the technique described in this thesis could be applied outside of boiling heat transfer. Other scientific areas where MiST could be applied include biology and chemistry, where kinetics and visualization is a main focus of the research.
Chapter 2
Background and Previous Research
2.1
Boiling Theory
2.1.1
Nucleation
Bubble nucleation begins with the formation of vapor once the requisite liquid super-heat requirements are met. The most common form of bubble nucleation is hetero-geneous nucleation, where bubble formation occurs at preferential nucleation sites. Homogeneous boiling can also occur in the absence of these nucleation sites, how-ever the liquid superheat required is significantly greater. To describe the nucleation process it is common to begin with the mechanical equilibrium of the vapor nucleus surrounded by liquid. An interface will form based on the pressure difference between the two phases and the surface tension -ll],
2u-Pg - Pf = - (2.1)
r*
where p9 is the vapor pressure inside the nucleus, pf is the fluid pressure and r*
is the critical radius, the minimum radius required to establish the vapor bubble. The fluid pressure is correlated to the saturation temperature, Tat, of the liquid. To initiate bubble nucleation the liquid superheat requirement must be met, that is, the temperature of the vapor embryo must be sufficiently higher than the saturation
temperature of the surrounding liquid[1], this is drive by the term in the
Young-17
Laplace equation. The required bubble vapor temperature, Tg, for bubble nucleation is given as,
T Tsats= In 1 + 2 1 +
(2.2)
JhfII pfr* V9
Where T. is the vapor temperature within the bubble, R is the universal gas constant, J is the mechanical equivalent of heat which can be physically understood as work, hfg is the latent heat of vaporization, M is the molecular weight, pf is
the pressure of the fluid, vf and vg are the specific volume of the fluid and specific
volume of the gas, respectively. As mentioned before, nucleation can occur either homogeneously within the fluid, or heterogeneously in the presence of preferential nucleation sites. The reason why heterogenous nucleation is preferable to homogenous nucleation becomes apparent when examining the Gibbs free energy of formation,
AG(r*). The free energy is reduced by a factor of
#
in the presence of nucleationsites on a solid surface [1}.
(2 + 2 cosO + cosO sin2
9) (2.3)
4
Where 0 is the contact angle the fluid makes with the solid surface. Although Equations 2.2 and 2.3 can describe the theoretical superheat required to initiate bubble formation, what is observed in experiments is typically much less. For this work, the heater surface will provide preferential nucleation sites in the form of small cavities, which are typically on the order of a few microns. These cavities provide an initial vapor embryo, as show in Figure 2-1. The presence of this initial vapor embryo reduces the required superheat to initiate nucleation. As the temperature rises, the pressure within the cavity will begin to increase. As the pressure increases, the embryo will grow into a bubble as described by Equation 2.1.
liquid
1 4
2
vapor
Heatin
Heat in
Figurc! 9-1: Example of buibblc growth cycle
2.1.2
Heat Transfer
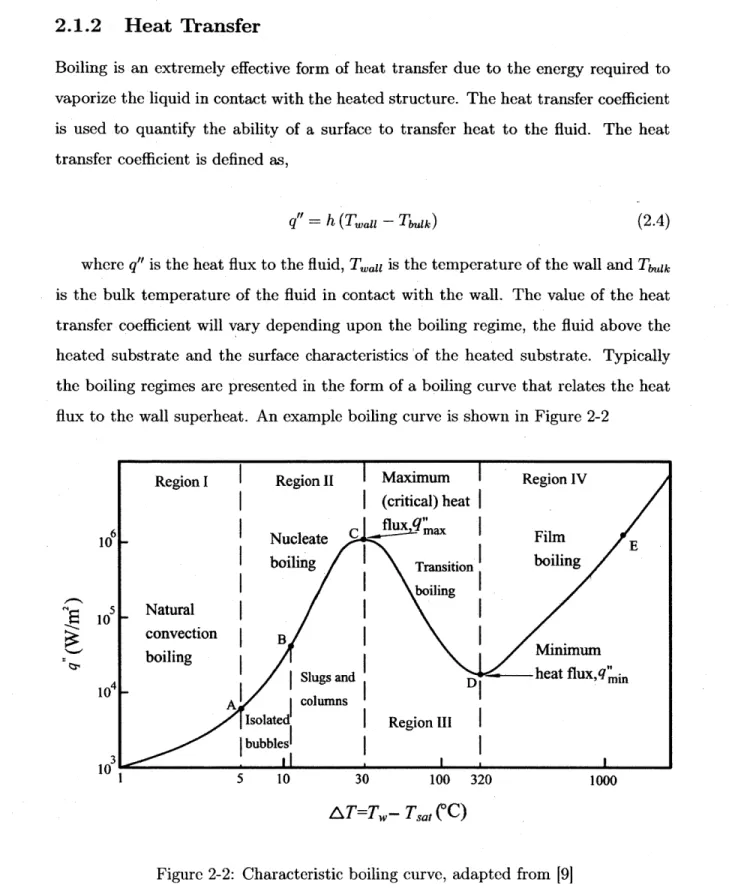
Boiling is an extremely effective form of heat transfer due to the energy required to vaporize the liquid in contact with the heated structure. The heat transfer coefficient is used to quantify the ability of a surface to transfer heat to the fluid. The heat transfer coefficient is defined as,
q" = h (Tal - Tbulk) (2.4)
where q" is the heat flux to the fluid, Twai is the temperature of the wall and Taagk is the bulk temperature of the fluid in contact with the wall. The value of the heat transfer coefficient will vary depending upon the boiling regime, the fluid above the heated substrate and the surface characteristics 'of the heated substrate. Typically the boiling regimes are presented in the form of a boiling curve that relates the heat flux to the wall superheat. An example boiling curve is shown in Figure 2-2
6 10 5 10 10
I
3 10 5 10 30 100 320 AT=Tw- Tsat(*C)
1000Figure 2-2: Characteristic boiling curve, adapted from [91
The first region is characteristic of natural convection. Here heat from the surface
Region I Region II Maximum Region IV
(critical) heat
flux
q"'
Nucleate C a Film E
boiling Transition boiling
boiling Natural
convection B Minimum
boiling Slugs and D - heat flux,q mi
A columns
Isolated Region III
bubblesI
is extracted into the fluid. As the fluid heats, the density decreases causing the fluid to circulate with the colder fluid further from the wall. The shallow slope in this region demonstrates that natural convection is a weak form of heat removal. Point A is the onset of nucleate boiling (ONB). Here bubbles begin to form and the slope of the boiling curve increases dramatically. This is due to an increase in the heat transfer coefficient as mentioned before. Region II is the nucleate boiling regime, where boiling allows the fluid to rapidly remove large amounts of heat from the heated surface. The dramatic increase in the heat transfer coefficient is largely due to the enhanced mixing that occurs when bubble lifts off of the surface. When the bubble detaches, cooler liquid rushes in and rapidly quenches the heated surface. As such, large heat fluxes can be attained with minimal increase in superheat.
If the heat flux is increased to point C the critical heat flux is reached. At this point, the maximum amount of heat is being removed by nucleate boiling. If the heat flux is slightly increased, vapor will begin to blanket the surface and decrease the heat transfer coefficient as the heat transfer regime transitions in film boiling. This will result in a dramatic increase in temperature typically of 1000 degrees or more.
2.2
Blackbody Radiation Theory
Radiation is one of three forms of heat transfer along with conduction and convec-tion. In the previous section convection was discussed when considering boiling heat transfer. This section outlines how heat is transferred via radiative photons emitted from a heated surface and how the radiative signature can be used to determine the temperature of the source.
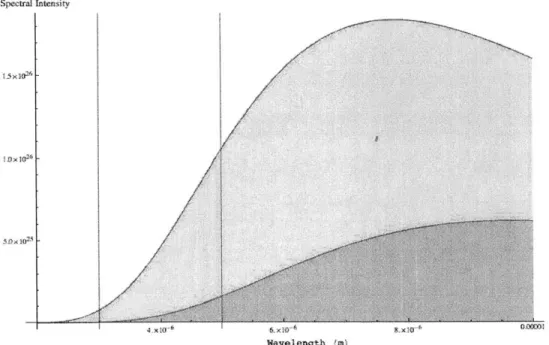
All materials will emit electromagnetic radiation, in the form of photons, based on temperature, T, and spectral emissivity, E. Additionally, certain materials will also reflect, absorb or transmit radiation depending upon the optical properties of the material. Planck's law relates the temperature of a blackbody to the intensity of the radiation. The spectral intensity varies with both temperature and frequency as shown in Figure 2-3 and by Equation 2.5.
I(v, T) = 2whiA 1 (2.5)
C 2 khi
c e BT _
Here, I is the spectral intensity, h is Planck's constant, v is the frequency, c is the
speed of light and kB is Boltzmann's constant.
However, not all materials behave exactly as a blackbody. Typically, we consider most materials as a grey body where the radiation emitted is approximated as a portion of the equivalent blackbody emission. The ratio of the grey body emission to the blackbody emission is captured by the material emissivity coefficient, e. The total emission of a grey body is described by the Stefan-Boltzmann law.
I(T) = EFv1-,2c-T' (2.6)
Where e is the material emissivity, F,,-,2 is the fraction of blackbody radiation
emitted between frequencies v, and v2 and a is the Stefan-Boltzmann constant.
Equa-tion 2.6 is the spectrally integrated form of EquaEqua-tion 2.5.
The intensity of the radiation varies with both temperature and frequency as shown in Figure 2-3. Additionally, the working wavelength region used by a mid-IR camera at boiling temperatures provides a unique radiation signature for a given temperature. This is due to the sharp slope in the Planck distribution in the operative
wavelengths. Small changes in temperature result in significant changes in total
radiation. The one-to-one correspondence of IR signal to temperature, and large signal to noise ration enables an IR temperature measurement with high accuracy.
Wavelength can be calculated from the frequency using A = ', where c is the speed
of light.
Given a black or grey body, a temperature measurement can be made using an IR camera and calculating the intensity of radiation coming from the body. However, in certain situations, as in this research, a multi-layer body is used instead of a single
opaque interface. In this situation there are numerous effects that appear when
considering the propagation and generation of light through each of the layers. The fraction of light that will be absorbed, reflected or transmitted through each layer
Spectral Lrtcnszity
T-373 K * -31H) K
"/
Wavelength in)
Figure 2-3: Spectral intlnsity of a blackbody enitter at 373 Kelvin and 300 Kelvin.
Th vertical lines indicit till approxinate working wavelengtis for mid-wave IR Ceracl(8s
of the body call be (d1terimined using Equatlion 2.7. Kirehoff's law (8n be used
in-COljuilncltionat with Equation 2.7 noting that the cm1issivity is c((ial to the iibsorptivity.
T + p () + . (v) = (2.7)
Whiere r is the transmissivity, p is the r'fectivity a11d (1 is tle absorptivity. Tlh
law expresses the eoiiservatioii of energy. All light tha.t elters the body mst either be
transmitte. reflected or absorbed. An additio1al note is the absorptivity is equal to the emissivity, c. at each wavelength. These properti's, in particular the transmissiv-ity a(d [eflectivtransmissiv-ity. can lb measured using a Fourier transform infrarel spectrometer FTIiR). If two of these Jroperties are known, the third can then be calculate(d using
Equation 2.7. A model can be built to tak' into account each of the layers ill the
body and the Irspectiv( ehanges in till' 113 signal from the propagation of light. This
2.3
Infrared Thermography
Infrared thermography is a growing field where IR cameras are implemented as di-agnostic tools. The image collected by the IR camera is used to quantify important details such as surface temperature. IR cameras enable both a high temporal reso-lution, typically up to 4000 frames per second (fps), and a high spatial resolution at nearly 15 pm per pixel. This unique combination allows small scale measurements to be made at extremely high speeds. This applies particularly well for heat transfer applications where phenomena occur at micron to millimeter sizes and millisecond time scales.
The principle use of IR thermography is the visualization of phenomena with unique IR signatures. Typically the camera is used to determine the temperature of a substance, but it can also be used for simple identification based on the emissive differences between two samples. The key is the extraction of useful data from the IR signature recorded by the camera. Both qualitative and quantitative data can be obtained with proper implementation, as demonstrated later in this thesis. JR thermography can be applied across a wide variety of experiments depending upon the temperatures and distances required. Short-wave, mid-wave and long-wave cameras exist to take advantage of the various IR "windows" available. Generally, short-wave
refers to the 1pm to 3pn range, mid-wave refers to the 3ptm to 5pim range and
long-wave refers to the 8pm to 12pm. range.
Infrared thermography has been well adopted by the heat transfer research com-munity. The technique has been lauded for its ability to capture very fine phenom-ena, enabling researchers to gain deeper insight to boiling heat transfer. The highly resolved data is particularly beneficial when compared to diagnostic tools such as wire-mesh sensors [10, 111.
2.3.1
Previous Infrared Thermography Applications
Previous work has laid the foundation for the application of IR thermography to
2-D wall temperature distribution [5, 7, 121 or 2-D phase distribution of the fluid above the heated surface [3]. The value of the techniques is the ability to determine key boiling parameters by using the images obtained during the experiment. Some examples of such parameters are temperature, bubble nucleation frequency, nucleation site density, bubble departure diameter, local heat flux, micro-layer thickness and triple contact line location. These parameters feed into boiling heat transfer models to calculate properties such as the heat transfer coefficient or predict the boiling curve. Additionally, these techniques can yield a great deal of information on the mechanisms
of boiling. Mechanistic models of CHF and quenching are still rudimentary and
these models can be further developed with advanced IR thermography diagnostic tools and high-resolution data. Additionally, high-fidelity experiments can provide data required for CFD simulation validation. The details of an IR thermography experiment are described in Chapter 3.
The large majority of IR thermography applications in boiling heat transfer have been in temperature distribution measurements. These experiments typically consist of a thin IR-opaque film on top of a nearly IR transparent substrate. An IR camera is used to collect the radiation emitted from the opaque thin film. The intensity of the radiation emitted by the film can be correlated to the temperature of the film, as will be demonstrated in Section 5.2. Alternatively, an empirical curve can be used with measurements from a thermocouple to determine a counts vs. temperature curve. The end result is an image of the 2-D temperature distribution of the surface. This technique has provided information on nucleation frequency, hot spot occurrence and the 2-D heat flux distribution on the boiling surface.
IR thermography has also been used for phase distribution measurements. Instead of measuring the radiation from the thin film on the boiling surface, the radiation emitted by the fluid above the surface is measured to determine phase [3]. The radi-ation measured from the opaque film was unique to the temperature of the film, here the radiation measured from the fluid above the surface is unique to the temperature of the fluid. The key to measuring the phase distribution is the understanding that the measurement of cooler fluid does not indicate cold fluid in-contact with the
fa ce. altlhouigh it can, but iistead is the indication of a vapor bubble on the surface
where the colder fluid is behinid the vapor bubble. Thus discrepancy in temperature
between the hot fluid in coiitact with the heated surface an1d( the cooler fluid behind the lbubbld enaibles the phase
einclasllremun
t.A phase shift in the light occurs as it passes through the liquid film. The source of the light is the liquid behind the thin film. In this situation the fluid illuminates the
finn and causes the interference pattern to arise. The light enters the fiin and upon
impinging on the filii-heater interface, part of the light will reflect. The rest of the
light will trausinit through the heater. The reflected light will return to the fihn-vapor
interface where part of it will again be reflected. The additional path length, after
reficeting off the filn-ITO interfacv. introduces a phase shift in the light signal and
thus leads to an interference pattern based the thickness of filn. Figure 2-4 depicts
the int4r-ference pattern that arises when a thin fihn is present and phase detecting
techniqu is being used. Kim et al, describes how the interference pattern arises when
using the DEPIcT technique
[31
Figuire 2-: I This picture shows the interference pattern emerging from a thin filn of
water. Two strips of silicon were placed ou tither side of the Water, with the top piece
42 0I A1 I , I I I I 4210 4200 4190 4180 4170 4160 0 1 2 3 45 6 799 Dstnce(mm)
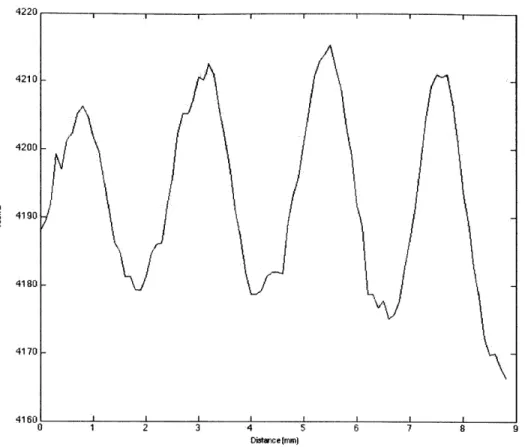
Figure 2-5: This graph shows how the camera counts vary with the interference
pattern. The slope of the film thickness can be determined by measuring the spacing between the peaks of the interference pattern.
One point of clarification is on the initial light signal from the liquid behind the film. The water acts as an incoherent source of light, much like an FTIR.. However, this does not pose a problem when considering the interference pattern. The initial source is incoherent, however the entire signal is coherent with itself. That is when the light enters the film it should be considered as a coherent beam with itself. Only when the light splits upon reflection at the film-ITO surface, does the phase shift take place. The two beams are still coherent, however once the reflection takes place the beams are phase shifted from each other. The same process occurs in an FTIR. Incoherent radiation is emitted by the IR source. This radiation is emitted across a number of wavelengths. However, the beam enters a series a mirrors which separates
27
the signal into two beams. These two beams are then coherent with each other. These IR thermography techniques have been implemented in previous research for interrogating boiling surfaces. However, there has been little work in synchroniz-ing these techniques. The main issue with attemptsynchroniz-ing to synchronize these techniques is the discrepancy in heaters required to implement each technique. Temperature dis-tribution measurements require an IR opaque surface to measure the temperature from the thin film. Phase distribution measurements require an IR transparent sur-face to measure the radiation from the fluid above the heater. The requirement of both an opaque and transparent heater prevents a simple synchronization of the two techniques. This thesis will address this issue.
Chapter 3
Experimental Methods
This chapter outlines the experimental equipment and facilities used to conduct the MiST experiment. Some the equipment, in particular the Fourier Transform Infrared Spectrometer (FTIR), is used outside of the actual experiment. Instead, the data gathered from the FTIR is used for heater design and in post-processing analysis.
3.1
Pool Boiling Facility
A pool boiling facility (PBF) was used to create the ideal experimental boiling
en-vironment, Figure ??. The stainless steel facility has an outer isothermal bath
con-trolled by an external isothermal path. The outer bath was maintained at saturation conditions. The inner bath holds the deionized water which sits above the ITO heater discussed in Section 3.2. The heater is placed in a cartridge which is affixed to the bottom of the facility. Electrodes are placed on the gold pads of the heater and con-nected to DC power supply. The operation procedures for the pool boiling facility have been outlined by Phillips [131.
NOE .O.- . - U -. -djr- .
Iligh Spd
'T'rigcer
swhermial bath
sheei and imagingL.
IiLgh Speed Optial th fludfrared Camera ITO ficater ii rr or S1cruIin1iiu i und Etherne
Figure 3-1: A sche1itatic of the pool boiling facility used, adapted froim
V
II.
actul aluera setllp dliffers froni that shown in the figure, see Set i(I 6-1
3.2
Pool Boiling Heaters
The substrate used to conduct the test is referred to as a "heater". These heaters are
similar to test samples used in other works at MIT [7, 131. These heaters typically consist of a IR transparent substrate, such as sapphire or calcium fluoride and an IR opaque, conductive thin film such as indium tin oxide (ITO). The substrate must be transparent to allow the IR camera to receive the radiation signature of the thin film. Sapphire and calcium fluoride are particularly good choices because of their high IR
transparency in the 3-5ptm wavelengths. The conductive thin film is used to generate
the requisite heat flux by passing a current through the attached gold pads. The DC power supply is used to control the global heat flux through the ITO film. The 200nm thickness of the ITO means the film can be assumed to be at the same temperature as the wall temperature. That is, the conductive thermal resistance along the z-axis of the film is negligible. This is particularly important for the thermography as the IR camera will be imaging the backside of the film. If the film is thin enough, less than a few microns, the temperature difference between the interface temperature and the backside temperature is negligible [13].
For this work, a specialized ITO coating and short wave pass filter were created and deposited onto a sapphire substrate. The details of the coatings are discussed later in Section 4.2.4. A 20mm x 20mm design was used with gold pads approximately 2mm in width. This left a 20mm x 16mm usable area for boiling diagnostic purposes. A schematic drawing of the heater is shown in Figure 3-2.
Top View
p
r 5 mm A 20 mm 10 mm U u 5 mm 2mm 16mm 2mm Lateral View A -a 'Au 200 nm L mmFtitre S ;-2:eSehini awing of rb( ITO beater us5(. The HTO) ws desild Ibv
Diamui1d Con tings ILul. 411(d thi SVP filer wa (is deposited by Andover Crp. The
3.3
Infrared Cameras
The IR cameras used in this work are mid-wave infrared cameras (MWIR). Operating in the mid-wave region is the optimal choice for boiling applications where tempera-tures are around 100C, as described in Section 2.2. The two cameras used are a FLIR SC6000 camera and an IR. Cameras 600 series. Both cameras operate predominately in the 3-5pm wavelengths, however the IRC 600 is sensitive out to 5.7pm. Addi-tionally, the IRC 600 has a built-in filter wheel which enables the user to select the operative wavelengths by selecting the appropriate wavelength filter. For this work both cameras were operated in the standard mid-wave 3-5pm wavelengths, however information on using the additional wavelengths is provided in Section 5.2.
IR camera function is as critical to a thermography experiment as the sample or substrate itself. Proper understanding of camera function is essential to analyzing data. The cameras used in this thesis both use an Indium-Antimony sensor. Sensing an incident photon involves interaction with an electron in the electron "well" within the pixel. The photon will excite the electron out of the valence band and into the conduction band. This will induce a voltage which is measured by the camera. The voltage caused by the electrons entering the valence band is then converted into the "counts" unit output by the camera. The counts are simply a 14-bit scale and hold no physically meaning without further analysis. Understanding this sequence including the role of the electron well is crucial to understanding how the photon flux can be calculated from the seemingly arbitrary counts unit output by the IR camera.
Two lenses, a 100mm lens and a 50mm lens, were used along with extension rings to enhance the resolution. The resolution attained with the IRC 600 was 50 microns per pixel and the resolution with the SC6000 was 100 microns per pixel. The resolutions varied because of the difference in lens size. Future work would benefit from using the same optics to attain the same resolutions. Ideally two 100mm lenses would be used with the requisite extension rings to obtain the maximum resolution possible. The cameras were mounted on an optic rail and the entire apparatus is atop an optic table for precision alignment. A picture of the apparatus is shown in Figure
B(011 I cam in ras wcre set to an tintegraltioli tie of O.) ins. Ik In Il is ca lpadlc of a1
a 1011>5r oHitgrad U 111 thine whenl se t to MOO10 franes j)per scoi 11(1 bult bo1th caWmsWere
1101( to the SF1100 11ntegration f-innc to ensuren In) vari lityNi In he S,- hr~i.njc1t.v of t i a
C 1(raiin tia. Both ia-nera's arc1 (tailIA(l of iotar iiig the '-viitii vdx x i, a r)34 stinal1
Tinc 'SCt6000M disct ei as tHei nia;stir [Oi tis e xperiument, a11(1 cont nlid t I t
nig->5 Ii 11(mo th IRC 6 I(40. A trige wasset, oilx lo tHie nialfnaiw, afterwairds,- 1)1(tIr
CfIih Ill1 )-S OperIJii(I 1 IieFtwidluitlV )Nit nuiia1it a ie 11 ne liuiity. More inforiathin M)1
svlicn-i ill t Hiei c ilicllIS is piovii jd t I iiSei t ol 6.,:
I,
Ft 4 1
I If Ft [lIlY FF[FIIFFI FF[ 1 fiLi F Fr 1FhI 11 FK Ft FFF~{F Fr ~,F,,1 Ft F '::. yflLiiF1ii1i(Af FIll 1* F t ii F 1111 F 1 1 . . iiFFF~. I
F1IF 1~iFi F F1F Fl F FF141 Fir 'IF. 1F~1I ;F Ft F tIFF
F 11~ ~l bFF1 1FF 1
nI Fit) F~ F F F
411 F oF i.'l~1l (i(j I 1 IIFFFFIFF1FI F 11FF
<1.4FfF[l[FFJI Fl 1.1 . 1F1IIF>FFF%~ Fit F
111 .4 F~t~t~l; 1FF
K
tIFF,, I FlIrt, 11 ~ '11114 IF 'F~ ~& ~ F F FF11 IFFull ~i C F~ ~ FIt Ft FF14 'IF F FF F F 411F'F' t1iq~1F Fti F, F~' 't F,F F F 1F1F 1FF IiFF.( F ~J~~~(pF] ~IFtFiF1 1ff '''Ft
it~ lilt ) k [iii tiii i (if V lii il)1)cll at. us >( t111) ian fill ii ug 1)1 Ft U 1112 eann mars ([1.1112 in liii.
K P I LW I a U no Ut ) tin F LI I op 1 and the I) hURL 1)1 a kin sin (right
I
3.4
Fourier Transform Infrared Spectromecter
A ENIllil 'I
~iuishm
ifi 'rrll Sp 1 l.)1 i lt i ( FJ1 ) iNTius 1 15'( to co ( llect,. the s-pct V liti'tiiiiis51. i cci(tlol iold atI ittiiidt .T I l a( is essenltial to thie t(i1~tl
An FTIR uses a broadband light source to measure the amount of light attenuated by the sample. The light emitted by the source is sent to a Michelson interferometer. The interferometer adjusts which frequencies of light are passed through the machine at a given instant. The light, consisting of multiple frequencies, passes through the sample to be interrogated and is captured by the detector. By continuously adjusting the set of frequencies used at a given instant an interferogram is created and sent through a Fourier transform algorithm to determine the spectral attenuation.
The FTIR was used to gather two sets of data on the heater and dielectric filter, spectral transmission and spectral reflection data. Transmission data is gathered by passing the light through the heater and detecting how much light was attenuated. Reflection data requires an additional accessory consisting of several mirrors. The mirrors are aligned such that the beam from the FTIR is incident on the heater at a specified angle. A portion of the light will be reflected off the heater onto another set of mirrors which direct it to the detector. The rest of the light will pass through the heater and be absorbed by a black surface on the opposite side of the heater. The minimum incidence angle possible is 5 degrees with a maximum of 80 degrees. The 5 degree setting was used to collect data as that is closest to the normal incidence that is assumed during the thermography experiment.
The FTIR used to collect the data was a Bruker Optics Vertex 70, capable of
interrogating the optical properties of materials between 400nm and 2 0 tm. The
FTIR is set to operate with wavenumber settings and data was collected between
1000 and 8000cm- 1 which is 1.25pm to 10pim at a resolution of 4cm-1.
Chapter 4
Heater Design
At the heart of the MiST techniques is a highly-engineered heater which enables the simultaneous measurement of the temperature and phase distributions. Previous works have used ITO heaters with sapphire [8, 13, 151, black paint heaters [4], thin
metal heaters [5, 16] or silicon heaters [3]. The heaters generally consist of an
elec-trically conductive thin-film placed on an IR transparent substrate, however this has varied depending upon the application. For MiST the unique nature of the measure-ment necessitated a new design for the thin film. This section outlines the criteria for the heater as well as the solutions to meet those criteria.
4.1
Design Constraints
In order to measure the temperature and phase simultaneously the heater must be able to both pass the IR signature of the fluid above the heater and emit it's own IR radiation to enable a temperature measurement. Additionally, these two radiation measurements need to be distinguishable. Unfortunately, the IR cameras are unable to distinguish the two signals as they simply detect the incident photons via the electron wells in the focal plane array. In addition to the separation of the two measurement signals the heater must also perform the normal tasks of heat generation, via joule heating, and hold general structure integrity during the experiment. The
The most difficult constraint on the heater is the requirement of measuring the temperature and phase signal simultaneously. The phase measurement requires an IR transparent heater while the a temperature measurement requires and IR opaque heater. These two properties are clearly mutually exclusive. To accomplish this, two potential solutions were explored for separating the phase and temperature sig-nals. The first solution involves physically separating the two signals by creating a patterned surface where certain areas on the heater are opaque and others are trans-parent. With this solution, the temperature could be measured by analyzing the opaque areas while the phase could be measured by analyzing the transparent areas. The second solution is to separate the signals spectrally, that is, part of the elec-tromagnetic spectrum will be used to measure phase while the other part will be used to measure temperature. As mentioned previously, the IR cameras operate between 3-5[m in the mid-wave IR. As an example, if the heater were transparent between
3-4pm and opaque between 4-5ptm then the phase could be measured between 3-4pm
and the temperature could be measured between 4-5pm.
Each solution has benefits and drawbacks and varying degrees of difficulty in the execution, each of which are discussed in the respective solutions presented in Section
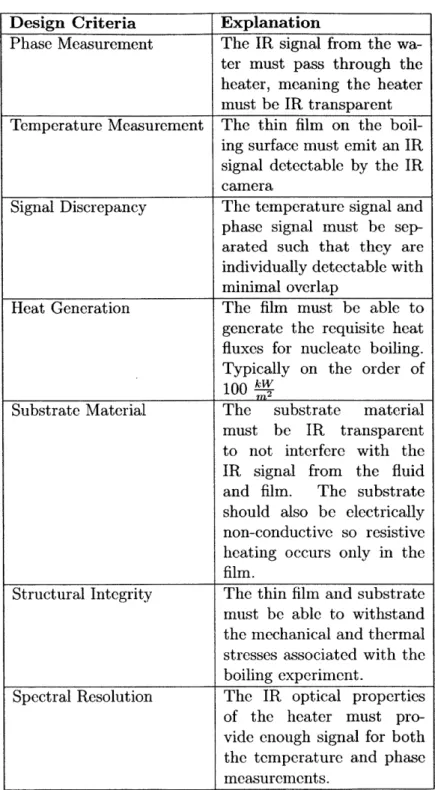
Table 4.1: Table of heater design criteria
Design Criteria Explanation
Phase Measurement The IR signal from the
wa-ter must pass through the heater, meaning the heater must be IR transparent
Temperature Measurement The thin film on the
boil-ing surface must emit an IR signal detectable by the IR camera
Signal Discrepancy The temperature signal and
phase signal must be sep-arated such that they are individually detectable with minimal overlap
Heat Generation The film must be able to
generate the requisite heat fluxes for nucleate boiling. Typically on the order of
100 2
Substrate Material The substrate material
must be IR transparent to not interfere with the
IR signal from the fluid
and film. The substrate
should also be electrically non-conductive so resistive heating occurs only in the
film.
Structural Integrity The thin film and substrate
must be able to withstand the mechanical and thermal stresses associated with the boiling experiment.
Spectral Resolution The IR optical properties
of the heater must pro-vide enough signal for both the temperature and phase measurements.
4.2
Heater Designs
Four alternative heater designs were explored in this thesis and are introduced here.
4.2.1
Checkerboard Pattern
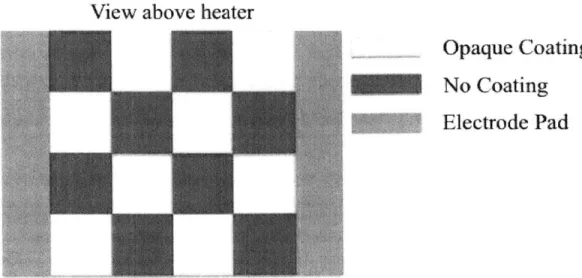
This heater design uses a checkerboard patterned thin film on top of a silicon wafer. The thin film consists of an IR opaque material such as ITO or gold. The design uses physical separation of the phase signal and the temperature signal to enable the simultaneous measurement. In the regions where the IR opaque material is present, the signal from the fluid above the surface would be blocked. A separate IR signal would be emitted correlating to the local temperature of the thin film. The tempera-ture, along with the local heat flux, could be deduced by using a blackbody radiation multi-layer model.
The phase signal would come from the regions without the thin film. Here, the IR signal from the fluid above the boiling surface would pass through the IR transparent substrate, in this case silicon, and the camera could capture the IR signal of the phase
above the surface using the DEPIcT technique described by Kim et al
[3].
The heaterdesign is show in Figure 4-1
The doped silicon substrate is necessary in order to generate heat for boiling. Typically the thin film is used to generate the heat, however because of the patterned design the film is incapable of passing large enough currents to generate the requisite heat flux for boiling. Additionally, it is very likely that the heat flux would not be uni-form across the boiling surface. Thus the substrate must be used for heat generation. A doped silicon substate provides the ideal combination of electrical conductance, IR transparency and structural integrity. The wafers are also inexpensive and easily diced to accommodate several heater dimensions. Doped silicon has also been used before for IR thermography by Kim et al [3].
A significant drawback to this design is the non-uniformity of the boiling surface. The patterned surface creates pockets where the thin metal film is not present. The size of the squares could vary depending upon the optical setup, but it would be
View above heater
Opaque Coating
No Coating
Electrode Pad
Figure 4-1: Shrmatic of checkerboard heater desig. Tlhe yeow stiares are an
opaque filn placed iton the doped silicon
reasola)le to assui they would be on the order of 10 microns or imore. up to 100
microns. This would be the resoLution of the test and the squares w\ould neeid to
match the spatial resolution of the IR
canra.
A vapor bubble is typically on theorder of 1 m1n 1111s mniitioned in section 2.1. The non-uniforim s urface creates an
ion-ideal )oiling environment due to the differeices il key boiling parameters betweiin
the two materials. These parameters include contact a Iigl('. surface roughness aiid
porosity. Additionally, if the sqnares are small enough they could also create artificial
nucleation sites.
Where this dlesign falls short is the method used for signal separation. The
tem-perature and phase signals are physically separated by tle thin
fit-
pattern, howeverthe IR camera will be uiable to distinguish between the two signals if the pattern does not align perfectly with the IR camera pixels, see Figure 1-2. Mitigating the signal overlap preseilts a very difficult challenge. The IR camera will require near-perfect alignment in order to prevent multiple signals froni interfacing with the same
p)ixel on the camera focal plaie array. Each pixel oil the camiiera , or several pixels
arranged in a square, would have to be precisely aligned with a single square on the
thin filni pattern. The toleranc(s on this aligiunent would be oil the order of tenths of
ImicronIs. Outfn through this precision could ai (tiiality measuremnent take pla~ce. This
inpracticality mimakes the checkerboard pattern solution inviable.
View above heater
Opaque Coating
No Coatingz
Electrode Pad
Projected
amera Pixel
Figure 4-2: Do1monstration of how itmultiple signals can be incident on a single camera pixel.
4.2.2
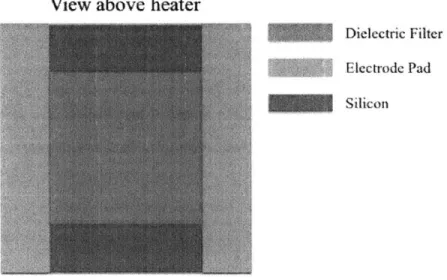
Dielectric Filter on Silicon
Spectral separation of the temperature and phase signals presents a much more
promising option as opposed to physical separation of the two signals, as it would
niot impose aliy spatial resolution limits.. To enlalble a spectral separatioli of the signals, a filter must exist in the opticad path between the fluid and the camera.
Additionially, a grey body muist also
exist
to facilitate a temperature mneasureumentusing the 1IR radiation emitted from the grey body. A dielectrio( filter presents an opportunity to control the spectral output of the thin film on the hiater. [le filter
can be placed on top of a substrate and function as the boiling surface. The filter
wvii block the radiation from the fluid above t he surface in the spectil region where
the filter is opaque. The radiation emitted by the fin can be used to cah4ulate the
temperatmre. The spectral region Where the filter is tIransparent will enable a phase
AN dielectric filter coisists of severaI stacked thin small filis, app)Oxima4teIy 10
to )in in thickness of various d(i(lectric coatings such as silicon oxide and titanunmi
oxide. I11ese Iaterials provide varying indices of refraction. When combii with
optimal layer thickness typically On the o(I of the wavelengths of interest, provide
ideal blocking ad1 transmission ch1rlcteristics. These properties ca be precisely
controlled by varying the miaterials used, the number of film layers and the
thick-nesses
of those layers to obtain 1sharp spectral cutoffs. Sharp cutoffs are ideal for thesimultaneous ieasaremellt as they increase the amount of ILsable signal and prevent
cross signal overlap between t he two mea.surenents.
View above heater
Dielectric Filter Electrode Pad
SiliconI
View from side of heater
Figure 1-3: Schematic of the dielectric heater design.
lIowever, because dielectrics are iioii-conductive a silicon substrate must agwain be iseI in order to generate the heat requirled for boiling. Tihe dielectric ilter is placvd atop tlie silicon sobstrate and functions as the boiling surfae. Silver pa'ds on the side
opposite the filter are used to connect electrodes to pass the current.
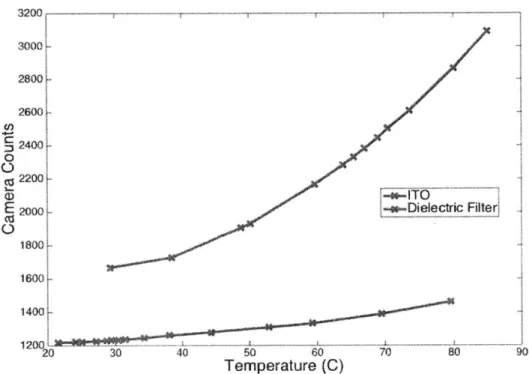
The dielectric filter performs well in separating the phase and temperature mea-surements, unfortunately, the dielectric filter is not a good emitter. Figure 4-4, shows the number of counts recorded by an IR camera when a dielectric filter is heated to near 100 celsius. The filter used was a 3-4.25 pm bandpass filter. This represents approximately half of the integrated blackbody signal available between 3-5 !tm. The results show the dielectric filter is a poor emitter when compared to ITO. The reduced radiation emission means the temperature measurement would be very inaccurate as the counts/C is very low.
A good signal can be defined as a signal that gives you at least 50 counts/C. That is the counts reported by the camera will change by 50 when the temperature of the film changes by one degree Celsius. This makes the silicon heater with dielectric filter an impractical heater design to use for simultaneous measurement. Examining Figure 4-4, it is clear the slope of the ITO curve reaches more than 60 counts/C before boiling temperatures are reached. Conversely, the dielectric filter has a slope of 10 counts/C near boiling temperatures.
4.2.3
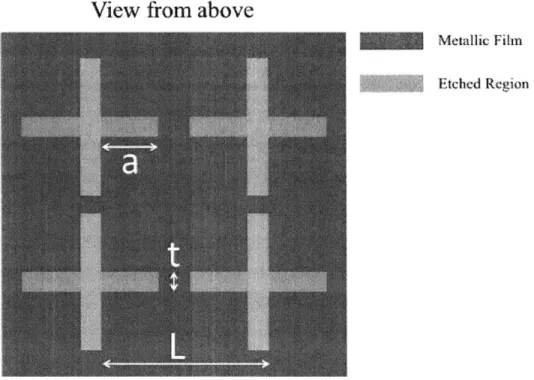
Frequency Selective Surface on Silicon
A frequency selective surface heater uses the theory of spectrally separating the tem-perature and phase signals to measure the two distributions simultaneously. This heater design uses the same theory as the dielectric filter heater but instead of a thin film dielectric filter, a frequency selective surface is deposited on top of the substrate. With this surface, the light is treated as a wave and the waves interact with patterned surface to produce a frequency dependent response. A frequency selective surface is typically a thin metal film with patterns etched into the film. These patterns are crosses as shown in Figure 4-5. The purpose of the thin film surface is to separate the two spectral regions of the mid-IR. The fihn will block one spectrum while passing
another, allowing for both a temperature and phase measurement to be made. The cross-shaped patterns are quantified by three variables, the pitch between crosses, the width of each cross and the width of each leg of the cross [171. The values
3200 --8000 2800/ 2600 2400 2200-2000 Dielectric Filter 1800 1600 1400K 120 *.-.- ... 0 30 40 50 60 70 80 Temperature (C)
Figure
1-4:
(raph comparing theITO an1d a (iclectric filter
1i1iber of IR collIlts vs. temiperat ure for st aldard
45 <D
E,
C C) E0
of each of these variables determine the spectral behavior of the surface. A summary of the physics and equations used to describe frequency selective surfaces is given by Melo et al [181. The shape of the cross determines how the incident electromagnetic waves will interact with the metal film. The incident waves can induce electron oscillation within the metal film depending upon the orientation of the wave with the surface structure. If the electromagnetic field induces an oscillation of the electrons, a dipole will be created which will interfere with the exiting waves. This results in an attenuation of signal on the exiting side.
The size of the pattern features will be on the order of the wavelengths of interest. In this case, the patterns would be on the order of a few microns to accommodate the mid-wave IR spectrum. The cutoff between the opaque and transparent spectral regions can be tuned by determining the appropriate shape and size of the pattern. This would allow for upmost precision as the signal overlap between the two mea-surements can be mitigated. Several computational codes exist to calculate and test patterns and shapes to determine the spectral parameters.
Since the thin film coating is made of a metal, typically gold, the film could potentially be used to generate the heat flux required for boiling. However, in order to ensure the integrity of the film a doped silicon substrate would need to be used to generate the heat. Passing a large current through the patterned film could degrade the precise pattern structure and result in the degradation of the spectral behavior and signal measurements. The patterning of the film creates small pathways the current must pass through. These pathways increase the resistance and lead to non-uniform heating. Additionally, if the metal film is susceptible to oxidation, these bottlenecks will likely be oxidation sites and create points of stress. For these reasons, a silicon wafer will need to be used in order to handle the heat generation.
Metal films are difficult to directly deposit onto silicon wafer and typically an adhesion layer is necessary to ensure the film quality. Titanium Oxide can be used to ensure the adhesion of gold and will additionally provide an electrical insulating layer to prevent the current from running through the metal film.