Publisher’s version / Version de l'éditeur:
Vous avez des questions? Nous pouvons vous aider. Pour communiquer directement avec un auteur, consultez la première page de la revue dans laquelle son article a été publié afin de trouver ses coordonnées. Si vous n’arrivez pas à les repérer, communiquez avec nous à PublicationsArchive-ArchivesPublications@nrc-cnrc.gc.ca.
Questions? Contact the NRC Publications Archive team at
PublicationsArchive-ArchivesPublications@nrc-cnrc.gc.ca. If you wish to email the authors directly, please see the first page of the publication for their contact information.
https://publications-cnrc.canada.ca/fra/droits
L’accès à ce site Web et l’utilisation de son contenu sont assujettis aux conditions présentées dans le site LISEZ CES CONDITIONS ATTENTIVEMENT AVANT D’UTILISER CE SITE WEB.
CSME 2004 Forum, pp. 220-228, 2004
READ THESE TERMS AND CONDITIONS CAREFULLY BEFORE USING THIS WEBSITE.
https://nrc-publications.canada.ca/eng/copyright
NRC Publications Archive Record / Notice des Archives des publications du CNRC :
https://nrc-publications.canada.ca/eng/view/object/?id=a7f9efc7-8b88-4a53-b081-b4c70a88f546 https://publications-cnrc.canada.ca/fra/voir/objet/?id=a7f9efc7-8b88-4a53-b081-b4c70a88f546
NRC Publications Archive
Archives des publications du CNRC
This publication could be one of several versions: author’s original, accepted manuscript or the publisher’s version. / La version de cette publication peut être l’une des suivantes : la version prépublication de l’auteur, la version acceptée du manuscrit ou la version de l’éditeur.
Access and use of this website and the material on it are subject to the Terms and Conditions set forth at
The impact of microstructure on the permeability of metal foams
The impact of microstructure on the permeability of
metal foams
P.
Khayargoli
1, V. Loya
1, L. P. Lefebvre
2and M. Medraj
11
Concordia University, Montreal, Quebec, Canada, mmedraj@me.concordia.ca
2
IMI-NRC, Boucherville, Quebec, Canada, louis-philippe.lefebvre@imi.cnrc-nrc.gc.ca
Metal foams (MF) are complex structures made from different kinds of materials manufactured using novel technologies. Proper knowledge of pressure drop and related parameters such as permeability (K) and drag coefficient (C) are important and should be defined properly. Thus, the present study was carried out to have an understanding of permeability for different velocity range to suit various industrial applications. The necessary equipment was designed and built for this purpose. Pressure drop across the metal foams was measured on IMI metal foam (IMIMF) and RECEMAT metal foam (RMF) samples. Parameters, K and
C were determined by fitting experimental data on widely accepted quadratic model of
Hazen-Dupuit-Darcy. Generally, the experimental results are in good agreement with the model with R2>98%. However, repeatability among the same pore diameter samples varies. Parameters were also calculated at different velocity ranges since K and C depend on velocity range. Thus, one has to select these parameters according to the required operating velocity range. Pressure drop across the specimens depends strongly on the structure of the material. In general, the pressure drop of IMIMF is higher than that of RMF by 8-9 times. Minimum K of RMF (0.38×10⁻⁹ m2) is almost 5 times higher than maximum K of IMIMF (0.07×10⁻⁹m2) whereas maximum C of RMF (1.02 ×10³ m-1 s2) is one fourth of minimum C of IMIMF (4.01×10³ m-1 s2).
1. INTRODUCTION
Metal foams (MF) are porous metal manufactured using state-of-the-art production technologies. Open pore metal foams generally have a cellular structure made up of 3-D interconnected network of solid plates that form the edges and faces of the cells. In metal foam, typically 60-98% of the structure is made of pores. It may have many interesting combinations of physical and mechanical properties, such as high stiffness to weight ratio and high gas permeability combined with high thermal conductivity. MF is applied in many areas of engineering such as mechanical, chemical and medical applications. Although some of the metal foams are being manufactured since several decades, new foams with enhanced properties are continuously being introduced in the market and their use in new applications is expected to grow in the near future.
Q
Figure 1: Darcy flow through Porous medium [1]
dx
p-dp
p
The understanding of the behavior of liquid or gas flow through porous medium is of great importance in several engineering fields. Fluid flow through MF generally results in pressure drop that depends on the MF microstructure, the
fluid velocity and properties. Correct estimation of pressure drop across the MF is useful to predict pressure drop during actual operation. Furthermore, knowledge of permeability is essential for successful design and operation of high performance industrial systems. The aim of the present work is to study the relation between permeability and structural parameters of different foams (IMIMF and RMF). The behavior of these different metal foams will be compared in this paper.
2. BACKGROUND
Permeability concept was first put forward by Henry Darcy in 1856 based on lab tests on the
volumetric flow rate and pressure difference across a sand bed. Figure 1 shows a schematic diagram of Darcy’s flow. Darcy proposed an empirical equation for estimating the volumetric flow rate (Q), given by:
dx dp kA
Q= . (1)
Where k is the hydraulic conductivity related of the porous medium, dx is the flow path length,
dp is the hydrostatic pressure difference across the specimen and A is the cross-sectional area. Equation 1 is presently known to be limited in several aspects. It is valid essentially for incompressible and isothermal slow flow of Newtonian fluid through a relatively long, uniform and isotropic porous medium of low hydraulic conductivity [2]. In most literature Darcy’s law is written in the form:
.V
K dx dp = µ
(2)
In equation 2, hydraulic conductivity k of original Darcy’s equation is replaced by (K⁄µ) where K is the specific permeability, which is supposedly independent of fluid properties and µ is the fluid dynamic viscosity. This equation, also known as the Hazen-Darcy equation, states that the pressure drop per unit length for a flow through a porous medium is proportional to the product of the fluid velocity and the dynamic viscosity [3]. Darcy did not make any reference to fluid viscosity since his experiments were only with water. From equation 1, it is surprising that Darcy did not consider viscosity effects although viscous and temperature effects were considered important parameters for fluid motion by several scientific works prior to Darcy, for example, Newton in 1687, Navier in 1822, and Poiseuille in 1844 [2]. Hazen [4] first proposed modifications to Darcy’s law in equation 2 to include temperature effects. Kozeny [5] provided physical explanation for the fluid viscosity dependency of Darcy’s law. He obtained an equation similar to equation 2 by assuming uniform pressure drop and integrating Poiseuille’s partial differential equations along a certain capillary length. Dupuit [6] made significant contribution in explaining physics of Darcy’s empirical relation mainly based on Prony’s [7] previous work since Darcy’s original equation 1 was based on experimental investigation on the phenomenon of water filtering with limited physical reasoning. Prony mentioned that the shear resistance should be a polynomial function of the fluid velocity at the solid surface, which he verified experimentally
and found that the quadratic polynomial was a good fit. Based on this result, Dupuit [6] proposed a polynomial equation for predicting steady flow through a homogeneous permeable medium based on the reason that the large flow resistance imposed by each small pore, being uniformly distributed, would induce a uniform fluid velocity. 2 .V V dx dp =α +β (3)
Even though equation 3 was verified experimentally, in several occasions, shear resistance cannot be responsible for the quadratic velocity term. The physical phenomenon responsible for the quadratic term is the drag force imposed to a fluid by any solid surface obstructing the flow path. Using the concept of resistive force to be proportional to the average velocity square, as proposed by Newton, equation 3, known as Hazen-Dupuit-Darcy equation can be rewritten as:
. .CV2 V K dx dp = µ +ρ (4) Where dx represents the thickness (or length) of the porous media, dp is the pressure drop across
dx, V is the flow velocity, ρ is the medium
density, µ is the medium viscosity, K is the permeability and C is the drag force coefficient of the porous media. In equation 4, the term ρCV2
accounts for the inertia effects. Lage [2] mentioned that coefficient C in equation 4 should not be used to account for inertia force but should be used to account for drag force. Several researchers have verified that Darcy’s law is valid only for low flow rates, where pressure drop is linearly proportional to the flow rate. Davis et al. [8] showed that experimental data sets published by Darcy for higher velocity
range m/s fits quadratic model better
than the linear one. When velocity increases, the influence of inertia and turbulence becomes more significant and pressure gradient display a parabolic trends. At high flow rates, the relation, known as the non-Darcy flow behavior, is not linear anymore and the pressure drop is found to be higher. As the flow velocity increases, the quadratic term becomes more prevalent, which must be accounted for in order to obtain an accurate description of the pressure-drop [9].
3 10 4× − > V
3. PERMEABILITY AND
STRUCTURAL RELATIONSHIP
Permeability of the metal foam is more accurate if determined experimentally [10] and difficult to
model due to the complex structure of these materials. Several researchers have conducted experimental studies to correlate permeability with structural parameters of metal foam. Boomsma et al. [9] demonstrated that the transition of flow regime from linear Darcian regime to quadratic is observed when the flow velocity exceeds 0.110 m/s in metal foams. Diedericks and Du Plessis [11] showed that coefficient C is important and becomes significant as the flow velocity increases. Thus, the drag force becomes more prevalent and must be considered for an accurate description of the pressure-drop in those materials. This drag force compensation, C, may depends on porosity [12]. Antohe [10] reported that K and C are not flow rate dependant but velocity range dependent. Several researchers adopted Erguns like model to explain and fit their experimental results [13-16]. Bhattacharya et al. [17] mentioned that their experimental results best fit into equation:
2 V K f V K dx dp= µ + ρ (5) Where, f is the inertial coefficient, also known as Ergun coefficient, K is the permeability and V is the flow velocity. K and f are strongly related to the structure of the medium. Du plessis et al., modeled metal foam as rectangular representative unit cell to predict pressure drop using water and glycerol as working fluid [18-19]. They stated that their model accurately predicts the pressure gradient in flow through metal foam. They reported that inertia coefficient
f reduces with increasing porosity. On the other hand, Bhattacharya et al. [17] modeled inertia coefficient, which depends on tortuosity of porous matrix. They expressed that Du plessis et
al. [20-21] model is valid only for porosities higher than 97%. Recently Tadrist et al. [13] presented relations between the pressure drop and inertial effects, the porosity (ε) of the medium and to the average particle diameter (dp)
using the following equation,
2 3 2 3 2 ) 1 ( ) 1 ( V d B V d A dx dp p p ρ ε ε µ ε ε − + − = (6)
Where, A and B are constants. The first term in equation 6 can be used to estimate permeability as, 2 ) 1 ( 3 2 ε ε − = A p d K (7)
Comparison of the inertial term in equation 4 and 6 leads to the following relationship:
p d B C (13 ) ε ε − = (8) Constants A and B in the above equations are not universal but depends on the porous media. The relationship between pore diameter and particle size for packed columns made of spheres is given by, d dp ε ε ) 1 ( 5 . 1 − =
(9) Where, is the particle diameter and d is the pore diameter.
p
d
The major problem in using the above equations to evaluate the permeability is defining structural properties of the medium. Although parameter A is clearly quantified for granular media, difficulties arise for metal foam in which it is assumed that the web-like cellular structure made of solid filaments connected in the three dimensions has a corresponding particle diameter [15]. Generally speaking, the permeability, K of metal foam increases as the cell size increases for fixed porosity [14]. Paek et al. [14] found that for different flow velocities, pressure drop was minimum at the same solid fraction (1- porosity). This indicates that pressure drop depends on solid fraction. Several researchers [9, 17, 18] reported experimental and theoretical models, which describe the relation between porosity and permeability. They reported that permeability increases as porosity increases.
4. EXPERIMENTAL EQUIPMENT
AND PROCEDURE
The experiment was conducted using the instrument shown in Figure 2. It consists of a middle flange assembly, a pressure transducer, a velocity meter, a pressure vessel and a settling chamber. The experimental setup is designed to obtain accurate measurements of the flow rates and pressure drops across the samples. The mid-flange assembly was placed in a ducted arrangement and was held securely by means of two end flanges as shown in Figure 3. IMIMF samples were insulated to prevent air-bypass and to fit well with the mid-flange. RMF samples were quite tight on the middle flange so insulation was not necessary. Pressure taps were drilled on the pipe as close as possible to the sample and one way valves were used to prevent air flow from the hole. The downstream pressure was atmospheric, as confirmed by the measurements. The upstream pressure was measured using an OMEGA pressure transducer
for gauge pressure range of 0-25 gauge with an accuracy of ±0.1% full scale. Flow velocity was measured using an OMEGA velocity meter for the flow velocity range of 0-1000 standard feet per minute with ±1% full scale accuracy. The signal acquisition from the velocity meter sensor and pressure transducer was handled by a data acquisition device manufactured by OMEGA. The device was inserted into a PC running Windows 98, which controls the data acquisition device. InstaCal software and LabView driver were used as the interface with LabView software.
With this configuration, the pressure and flow data were viewed and recorded to the PC hard drive in real time. During a typical experimental run, the set-up was first tested for leak detection. Airflow rate through the metal foam was set at the desired value using a valve. To minimize the error, 500 data were collected for each experiment conditions and mean values were used to plot the graphs. IMIMF and RMF were made from Nickel and Nickel-Chromium alloy respectively. RECEMAT metal foams disc diameter were 47 mm whereas IMI metal foams
were 29 mm. However the effective
cross-sectional area exposed to the flow in both types of metal foams were the same.
5. SAMPLES
5.1 RECEMAT Metal Foam
RMF, are commercially available MF since several decades and are produced by the metallization by electro-deposition of open cell polyurethane foams [22-23]. The material is very open and has a tight pore size distribution.
Nickel-Chromium (NC) and Nickel-Chromium extra strong (NCX) metal foams with 5mm, 10mm and 13mm thick RMF samples were tested. Samples are coded by material and grade number. Table 1 shows some of the RMF structural properties. Data in Table 1 are provided by the RECEMAT International. The range of pores refers to the approximate number of pores per linear inch. The average density was calculated using ASTM-792–98 standard.
Table 1: RMF samples and their structural properties [22] Gra d e # R ange o f po res Av g. p o re diameter (mm) Specific s u rfac e area (m 2 /m 3 ) Sample th ick n ess (mm) NCX 1116 11..16 1.4 1000 10,13 NCX 1723 17..23 0.9 1700 10 NC 2733 27..33 0.6 2500 5, 10 NCX 2733 27..33 0.6 2500 10 NC 3743 37..43 0.5 3700 5 NC 4753 47..53 0.4 5600 5 Metal Foam Sample Settling Chamber Velocity Meter Pressure Transducer Pressure Vessel Data Acquisition Air Filter
Figure 2: Experimental setup
Figure 3: Duct arrangement of flange with sample
6. RESULTS AND DISCUSSION
5.2 IMI Metal Foam
Open cell IMIMF samples were made using a powder metallurgy approach [24]. Figure 4 shows the microstructure of the IMIMF foams. IMIMF samples tested are listed in Table 2.
6.1 RMF Results
The pressure drop data for MF were normalized per unit length using the sample thickness. The permeability and drag coefficient were determined for each sample using entire velocity
range of 0 to 15 m/s using curve fitting
procedures.
Cell Window
Cells
Figure 4: Microstructure of the metal foam produced at IMI [24]
Equation 3, which is a widely accepted model [14, 15, 17, 18] was used for the curve fitting. A least square fit was performed to determine the values of α and β. Coefficient of determination,
R2 indicates the proportion of variation in
pressure drop relative to the flow velocity. In most cases, R2 is greater than 98%, except for two samples (with d = 0.6 mm, dx = 10 mm and
d = 0.5 mm, dx = 5 mm) where R2 is around
97%. This indicates that the 2nd order quadratic relationship is valid for these materials and almost 98% of the variation in the pressure drop is explained by the variations in velocity. By comparing equations 3 and 4, values of K and C were calculated as:
Table 2: IMIMF samples and their structural properties [courtesy: Metafoam]
Sample Sample thick
n ess (mm ) Av g. p o re diameter (d) (mm ) St d. de v. o f d (m m) To rt u o sity A3 11.85 A4 11.40 Ni70 A5 11.40 0.69 0.29 1.50 A2 8.38 A3 8.96 Ni60 A4 8.27 0.36 0.13 1.15 C , ρ β α µ = = K (10)
Dynamic viscosity and density of air were taken as 1.85 ×10⁻⁵ Pa-s and 1.225 kg/m3, respectively. Figure 5 (a) and (b) presents the variations of the measured pressure drop per unit length of the metal foams versus the fluid velocity. The repeatability of the measurements was achieved by performing the measurements on 3 replicas from each grade. The deviation in pressure drop observed for the specimens of the same nature is
0 100 200 300 400 500 600 700 800 900 0 2 4 6 8 10 12 14 Velocity (m/s) d p /d x ( p a/ mm) d=0.6 mm d=0.5 mm d=0.4 mm 0 50 100 150 200 250 300 350 0 5 10 15 Velocity (m/s) dp /d x (p a/ mm ) d=1.4mm d=0.9mm d=0.6mm (b) (a)
Figure 5: Effect of pore diameter (d) on pressure drop for RMF: (a) 5mm thickness (b) 10mm thickness
0 5 10 15 20 25 30 35 40 0.3 0.5 0.7 0.9 1.1 1.3 1.5 K ( m 2 ) ( 1 0 -9 ) Experimental Model, A = 100 d (mm) 0 0.5 1 1.5 2 2.5 0.3 0.5 0.7 0.9 1.1 1.3 1. d (mm) C (s 2 m -1 )( 1 0 3 ) 5 Experimental Model, B = 1
probably due to inhomogeneity in the microstructure and precision in the measurements. Pressure drop results show that the flow behavior through RMF deviates from Darcy law. The pressure drop across the foam is a quadratic function of the flow velocity. It can be seen from this figure that pressure drop is a function of pore diameter for RMF foams. As the pore size of metal foam decreases, the surface area to volume ratio increases creating additional flow resistance. This leads to increase in pressure drop. The K and C values were calculated using equations 7 and 8 based on the pressure drop data measured on 3 replicas of each grade of RMF samples. Values of A and B used in equations 7 and 8 were 100 and 1.0 respectively. These values lie within the interval obtained by Tadrist [13], from 100 to 865 for constant A and 0.65 to 2.65 for constant B. The thickness of the sample does not affect permeability and for the same pore diameter (d=0.6mm) MF; 5 mm and 10mm thick samples showed similar K values
(1.21 and 1.23). This indicates that increasing thickness of the MF has marginal effect on the permeability when the material is homogeneous through its thickness. On the other hand, K and C values of the RMF samples are correlated with the pore diameters of the foams. As indicated in Figure 6, K increases and C decreases with the increase of pore diameter. For example, samples with the largest pore (d=1.4mm) have the highest
K and lowest C values whereas the samples with the smallest pores (d=0.4mm) have the lowest K and highest C values. Figures 7 (a) and (b) present the relation between the average porosity of the samples on K and C, respectively. Both K and C show no clear correlation with porosity for RMF. For large pore diameter samples (d=1.4mm, dx=13), the modeling of the results
with an equation of the form V2
dx dp =β
gives good fitting. This indicates that the permeability of 0 5 10 15 20 25 30 0.82 0.84 0.86 0.88 0.9 0.92 Porosity K ( m 2 ) ( 1 0 -9 ) 0 0.5 1 1.5 2 2.5 0.82 0.84 0.86 0.88 0.9 0.92 Porosity C ( s 2 m -1 )( 10 3 ) (b) (a)
Figure 7: (a) K vs. porosity (b) C vs. porosity for RMF (b) (a)
Figure 6: (a) Permeability and (b) Drag coefficient with different pore diameter for RMF
0 20 40 60 80 100 0.3 0.6 d (mm) 0.9 1.2 1.5 % of dp/ dx aV bV2
these samples are very high and the pressure drop in large pore MF is mainly due to drag force effect. It can be seen from Figure 8 that the contribution of drag term to the pressure drop is 87% in the case of 1.4mm pore diameter. Figure 9 (a) and (b) illustrates K and C at different velocity ranges for 5mm thick RMF. At whole velocity range, K is lower whereas C is higher for d=0.4mm. In smaller pore foams, pressure
0.2 1.2 2.2 3.2 4.2 5.2 6.2 7 10 13 Velocity (m/s) K ( m 2 )( 10 -9 ) d = 0.6 mm d = 0.5 mm d = 0.4 mm 0.9 1.1 1.3 1.5 1.7 1.9 2.1 2.3 2.5 7 10 13 Velocity (m/s) C ( s 2 m -1 )( 10 3 ) d = 0.6 mm d = 0.5 mm d = 0.4 mm
drop contributions are from both K and C in the ratio of 40:60 as can be seen in Figure 8. Since test velocity range is high (up to 15 m/s), drag force effect represents more than 55% in these foams in all pore size as shown in Figure 8. The relative contribution of the drag force is more important when the pore size increases.
6.2 IMIMF Results
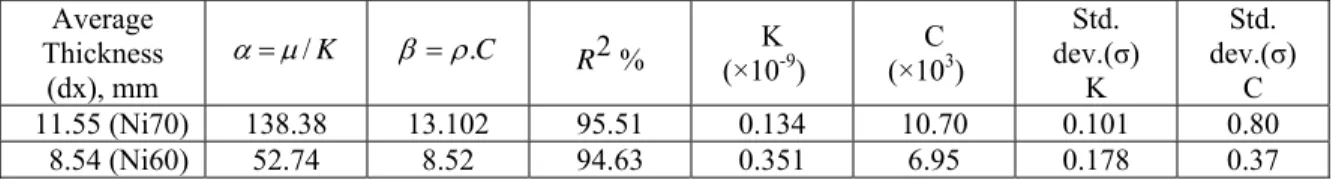
Figure 10 presents the measured pressure drop per unit length of the IMIMF versus the fluid velocity. The inconsistency in pressure drop among the replicas of same grade can be observed. Table 3 lists the permeability and drag coefficients for IMIMF. The standard deviation in K is higher than that of C for both Ni70 and Ni60 samples. The variations observed come from in-homogeneities in the specimens.
Figure 8: Contribution from permeability term and drag force term to pressure drop
Ni70 samples showed higher pressure drop compared to Ni60 samples. This indicates that pressure drop in larger pore IMIMF specimens is higher compared to smaller pore MF. This finding is different from the trend observed for RMF and the results reported by other researchers [13]. 0 1000 2000 3000 4000 5000 0 5 10 15 Velocity (m/s) dp /dx ( P a/ m m ) Ni70 Ni60 (a)
This shows that correlating the flow behavior in MF with micro-structural parameters is not trivial when comparing materials with different structures. The results show that pressure drop increases in those specimens when tortuosity increases. However, these observations are based on preliminary tests and additional experiments need to be done to confirm this hypothesis and to better understand the effect of the microstructure on the flow of fluids through porous medium, such as metal foams.
(b) V . α 2 V β
Figure 10: Pressure drop vs. velocity for IMIMF
Figure 9: (a) Permeability and (b) Drag coefficient at different velocity range for
Table 3: Quadratic curve coefficients (α and β ), K (m2) and C (m-1 s2) for different IMIMF Average Thickness (dx), mm K / µ α= β =ρ.C R2% K (×10-9) C (×103) Std. dev.(σ) K Std. dev.(σ) C 11.55 (Ni70) 138.38 13.102 95.51 0.134 10.70 0.101 0.80 8.54 (Ni60) 52.74 8.52 94.63 0.351 6.95 0.178 0.37
7. CONCLUSIONS
(i) Pressure drop characteristics of IMIMF and RMF were found to fit a polynomial model of Hazen-Depuit-Darcy.
(ii) For the experimental conditions evaluated, the pressure drop observed in the metal foams is due to combined effect of K (permeability) and C (drag coefficient). (iii) In RMF the effect of the drag force on
pressure drop was predominant for the experimental conditions evaluated in this study.
(iv) For RMF specimens, permeability K increased whereas drag coefficient C decreased with increasing pore diameter. (v) Pressure drop characteristics of IMIMF and
RMF are found to be different. RMF specimens are more open and more permeable than IMIMF specimens.
(vi) The effect of pore size on the IMIMF permeability seems to be opposite to that observed on RMF specimens and on porous medium characterized by other researchers.
(vii) The differences in K and C values between the two types of metal foams result from the differences in the microstructure of the foams.
(viii) The behavior of fluid flow in porous
medium can be very complex. However K and C could be predicted by Ergun-like-model in RMF using appropriate A and B as suggested by Tadrist [13]. The same model might be used to predict the flow behavior through IMIMF but more work has to be done to correlate constants A and
B to the microstructure of the IMI metal foam.
8. ACKNOWLEDGEMENT
The authors gratefully acknowledge the financial support received from NSERC and NATEQ. The authors would also like to thank IMI-NRC, Boucherville, Quebec, Canada, RECEMAT
International, Netherlands and Metafoam Technologies, Boucherville, Quebec, Canada for providing the samples. The authors also acknowledge Mr. Dominic Pilon for providing data on the IMIMF specimens.
9. BIBLIOGRAPHY
[1] Division of Engineering “Porous Material”,
http://www.cmse.ed.ac.uk/MSE3/Topics/MSE -permeability.pdf, University of Edinburgh (Accessed on November 2003).
[2] Lage, J. L., “The fundamental theory of flow through permeable media from Darcy to turbulence”, Transport phenomena in porous media, editor: Ingham B. D. and Pop I., 1-30, 1998.
[3] Kruger, E., “Die
Grundwasserbewegung”, Internationale Mitteilungen fur Bodenkunde, 8(105), 1918. (cited in [2])
[4] Hazen, A., “Some physical properties of sand and gravels with special reference to their use in filtration”, Massachusetts State Board of Health, Twenty-fourth annual report, 541, 1893. (cited in [2])
[5] Kozeny, J., Wasserkraft and Wasserwirtschaft, 22(67), 1927. (cited in [2]) [6] Dupuit, A. J. D. J., “Etudes Theoriques et Pratiques sur le movement des aux dans les canaux decouverts et a travers les terrains permeables”, Victor Dalmont, Paris, 1863. (cited in [2])
[7] Prony, R. de, “Recherches Physico-mathematiques sur la Theorie de Eaux Courants”, Paris, 1804. (cited in [2])
[8] Davis, P. A. et al., Application of a
Advances in Water Resources, 15: 175-180, 1992.
[9] Boomsma, K., Poulikakos, D. “The effects of Compression and Pore Size Variations on the Liquid Flow Characteristics in Metal Foams” J. of Fluid Engineering, 124: 263-272, 2002.
[10] Antohe, B. V., Lage, J. L., Price, D. C., Weber, R. M. “Experimental Determination of Permeability and Inertia Coefficients of Mechanically Compressed Aluminum Porous Matrices”, J. of Fluids Engineering, 119: 405-412, 1997.
[11] Diedericks, G. P. J., Du Plessis, J. P., ‘‘Modeling of flow through homogeneous foams,’’ Mathematical Engineering in Industry, 6: 133–154, 1997.
[12] Beckermann, C., Viskanta, R., ‘‘Forced convection boundary layer flow and heat transfer along a flat plate embedded in a porous medium,’’ Int. J. of Heat and Mass Transfer, 30: 1547–1551, 1986.
[13] Tadrist, L., Miscevic, M. “About the Use of Fibrous Materials in Compact Heat Exchangers”, Experimental Thermal and Fluid Science, 2003.
[14] Paek, J. W., Kang, B. H., Kim, S. Y., Hyun, J. M. “Effective Thermal Conductivity and Permeability of Aluminum Foam Materials” Int. J. of Thermo physics, 21(2), 2000.
[15] Innocentini, D.M., Salvini, V.,
”Prediction of Ceramic Foams Permeability Using Ergun’s Equation” Material Research,
2(4): 283-289, 1999.
[16] Innocentini, D.M., Victor, C.,
“Permeability of Porous Ceramic Considering the Klinkenberg and Inertial Effects” J. of American Society, 84(5): 941-44, 2001.
[17] Bhattacharya, A., Mahajan, R. L., “Thermo physical Properties of High Porosity Metal Foams”, Int. J. of Heat and Mass Transfer, 45, 2002.
[18] Boomsma, K., Poulikakos, D.,
Ventikos, Y., “Simulations of flow through
open cell metal foams using an idealized periodic cell structure”, Int. J. of Heat and Fluid Flow, 24: 825–834, 2003.
[19] Dullien, F. A. L., Porous Media: Fluid Transport and Pore Structures, Academic, 180-190, 1979.
[20] Du Plessis, P., “Pressure Drop Prediction for Flow through High Porosity Metallic Foams” Chemical Engineering Science, 49(21): 3545-3553, 1994.
[21] Du Plessis, P., “Pressure drop modeling in cellular metallic foams” Chemical engineering Science, 57(14): 2781-2789, 2002. [22] RECEMAT, “RECEMAT Metal Foam: Extremely Porous Material; RECEMAT Metal Foam: Flame Arresters” RECEMAT International, 2002.
[23] Banhart, J., “Manufacture,
characterization and application of cellular metals and metal foams”, Progress in Materials Science, 46: 559-632, 2001.
[24] Lefebvre, L.P., Gauthier, M., Bureau, M.N., LeRoux M., Panneton, R., Pilon, D., “Properties of nickel foams having different pore size distributions and densities” METFOAM conference, June 2003.
![Figure 1: Darcy flow through Porous medium [1]](https://thumb-eu.123doks.com/thumbv2/123doknet/14191285.478099/2.918.481.762.819.1011/figure-darcy-flow-porous-medium.webp)

![Table 2: IMIMF samples and their structural properties [courtesy: Metafoam]](https://thumb-eu.123doks.com/thumbv2/123doknet/14191285.478099/6.918.121.793.188.1028/table-imimf-samples-structural-properties-courtesy-metafoam.webp)


![Risiko- & [und] Schutzfaktoren der psychischen Gesundheit humanitärer Einsatzhelfer : eine systematische Literaturübersicht](data:image/gif;base64,R0lGODlhAQABAIAAAP///wAAACH5BAEAAAAALAAAAAABAAEAAAICRAEAOw==)