Development of a Village-Scale,
Solar-Powered Reverse Osmosis System
The MIT Faculty has made this article openly available.
Please share
how this access benefits you. Your story matters.
Citation
Bian, David W., Julia A. Sokol, Janet H. Yun, Craig A. Mascarenhas,
Chinasa Emeghara, Sterling M. Watson, Christopher Buresh,
Annie Vander Werff, Natasha C. Wright, and Amos G. Winter.
“Development of a Village-Scale, Solar-Powered Reverse Osmosis
System.” Volume 2A: 42nd Design Automation Conference (August
21, 2016).
As Published
http://dx.doi.org/10.1115/DETC2016-59646
Publisher
ASME International
Version
Final published version
Citable link
http://hdl.handle.net/1721.1/120773
Terms of Use
Article is made available in accordance with the publisher's
policy and may be subject to US copyright law. Please refer to the
publisher's site for terms of use.
DEVELOPMENT OF A VILLAGE-SCALE,
SOLAR-POWERED REVERSE OSMOSIS SYSTEM
David W. Bian∗ Julia A. Sokol Janet H. Yun Craig A. Mascarenhas Chinasa Emeghara Sterling M. Watson
Department of Mechanical Engineering Massachusetts Institute of Technology
Cambridge, MA 02139 Email: [email protected]
Christopher Buresh Annie Vander Werff Community Health Initiative Haiti
Coralville, IA 52241 Email: [email protected]
Natasha C. Wright Amos G. Winter
Global Engineering and Research Lab Department of Mechanical Engineering Massachusetts Institute of Technology
Cambridge, MA 02139 Email: [email protected]
ABSTRACT
This paper details the development of a photovoltaic reverse osmosis water desalination system for a groundwater well in Bercy, Haiti. The well was constructed to provide potable drink-ing and agricultural water for the 300-person community. How-ever, its water has a salinity level of 5,290 ppm, rendering it harmful for both human consumption and soil fertility. This re-verse osmosis system is designed to be low-cost and operational off-grid while providing 900 gallons per day of desalinated wa-ter for the community. The system is composed of a photovoltaic power system, a submersible solar pump, and three reverse os-mosis membranes. The system is designed to have a material cost significantly below that of any commercially-available system of similar scale. Furthermore, it has an average water production cost of$1.21/m3and an average specific energy of 1.2 kWh/m3. Its performance was tested in the laboratory by connecting the desalination module to a DC power supply, demonstrating good agreement with its modeled performance. The installation of the full system with the PV module will take place on-site in the sum-mer of 2016. Following implementation, the system will be mon-itored and compared against predicted performance. The first
∗Corresponding Author: David Bian, 512-695-4200, [email protected]
attempt is meant to serve as a verification and validation of the system as a whole. However, successful operation within the given cost target could pave the way for wider use of off-grid reverse osmosis systems at many remote locations with limited freshwater access around the world.
1 INTRODUCTION
In 1990, the World Health Organization (WHO) and the United Nations (UN) set a goal to cut the global lack of access to drinking water by 50%. By 2010 the goal was achieved by improving the water source for over 2.6 billion people [1]. How-ever, the original definition of safe drinking water only applied to protection from fecal contamination [2]. The standards have since been updated to include protection against viruses, chemi-cals, and aesthetic characteristics such as color, taste, and odor. The issue of salinity has not yet been addressed despite the ad-verse health effects of high salt intake, such as increased risk of stroke and cardiovascular disease [3]. Water with a salinity level above 1,000 ppm is deemed unsafe for drinking [2] and is also unsuitable for irrigation, as it exacerbates the problem of poor crop yields [4].
Proceedings of the ASME 2016 International Design Engineering Technical Conferences and Computers and Information in Engineering Conference IDETC/CIE 2016 August 21-24, 2016, Charlotte, North Carolina
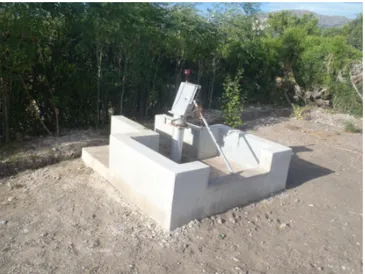
The non-profit organization Community Health Initiative (CHI) Haiti provides medical aid to isolated rural communities in Haiti, while also addressing the biological, social, and environ-mental causes of disease. In 2012, CHI sponsored the construc-tion of a groundwater well in the rural village of Bercy, Haiti to improve water access for the community’s 50 households (ap-proximately 300 residents), who before then had to walk two hours each way to the nearest water source. The Bercy well (Fig-ure 1) is 260 feet deep and is able to produce approximately 5 gallons of groundwater per minute (GPM). However, the output water from the well has a salinity level of 5,290 parts per million (ppm), much higher than the 1,000 ppm deemed safe for drink-ing by the WHO. Consequently, CHI proposed a photovoltaic (PV) powered off-grid water desalination system to convert the brackish well water into potable water for the Bercy community.
FIGURE 1. The Bercy well as installed by CHI Haiti.
1.1 Prior Art and Technology
On a global scale, 68% of desalinated water is produced by membrane processes, 30% by thermal processes, and the re-maining 2% by other technologies [5]. Thermal processes en-able salt separation by evaporation of water and thus carry a high thermal energy requirement. They are only competitive with other technologies at a large scale, especially if a source of free heat is already present, such as waste heat produced by power plants [5]. Membrane processes, with the most common being reverse osmosis (RO), separate high salinity and low salin-ity solutions through the use of semi-permeable membranes. The minimum specific energy required for RO is determined by the osmotic pressure, which is a function of salinity. The specific energy is generally in the range of 0.8 kWh/m3to 4.5 kWh/m3
for water salinities in the range of 1,000 ppm to 35,000 ppm, re-spectively [6]. Besides RO, electrodialysis (ED) has emerged as a promising membrane desalination technique. ED is the pro-cess of pulling ions out of solution through the application of an electric potential across a series of alternating anion and cation exchange membranes within an ED stack. Its specific energy requirements are comparable to those of RO, but is more energy-efficient at feed water salinities below 5,000 ppm [7].
Most of the world’s desalination capacity is driven by fossil fuels. There have been multiple renewable-energy driven desali-nation plants installed around the world, but these systems gener-ally cannot compete with conventional technologies in terms of cost. However, renewable energy-powered desalination is a ne-cessity for remote areas without grid access, and is likely to be-come a growing part of the desalination space as capital costs of renewable energy decrease [5]. Of the desalination technologies, RO and ED are the best suited for photovoltaic power. However, ED has not yet reached commercialization due to currently pro-hibitive capital costs. By contrast, RO has been used for several decades and is currently the most economical method for desali-nating brackish water. Due to its prevalence in the desalination space, RO technology was chosen to drive this solution design.
Many RO systems powered by renewable energy have been installed in off-grid locations: 32% of all renewable-energy de-salination systems are PV-powered reverse osmosis (PV-RO) [5]. Studies conducted by Bilton et al. verified that modular design can result in more cost-effective systems compared to off-the-shelf commercial systems [8] and validated the feasibility of such off-grid RO systems in small developing communities based on location and water demand [9]. Typical water production costs demonstrated by the brackish water PV-RO systems are $6.5-9.1/m3, with a specific energy range of 1.2-8 kWh/m3[5, 10].
Multiple vendors sell complete off-the-shelf RO systems, which typically include a feed pump, pre-filters, membranes, valves, meters, and a controller. However, most commercially-available RO systems lack off-grid capabilities, as they are de-signed to provide clean water for a home or a commercial fa-cility. Among the systems designed for brackish and tap water, many are specified for low-salinity water in the range of 500-2,000 ppm. These systems include pumps that are not neces-sarily corrosion-resistant or functional at high pressure and are generally insufficient for desalinating high-salinity water.
Several vendors do provide systems without these limita-tions that could be used with well water at 5,000 ppm salinity. These include systems by Applied Membranes, Inc. (WNH and HL Series) [11], Budget Water (CRO-HS Series) [12], and Flex-eon (R2 Series) [13]. The prices of these systems at the required capacity (900 gpm) range around $4,000–$6,000. Since these capacities are based on 24-hour operation with an AC power source, their connection to a solar power system would require a battery and inverter in addition to PV panels, raising the cost by several thousand dollars.
Only three companies that develop reverse osmosis systems combined with photovoltaic technology were identified: Forever Pure [14], Applied Membranes, Inc. [11], and DecRen Water Consult (DWC) [15]. Forever Pure’s Solar Oasis 1000 pack-age costs $17,000 and includes solar panels, chargers, inverter, batteries, and an RO module able to desalinate 1,000 GPD of brackish or sea water. The prices from the other two vendors are unknown but are expected to be in the same range ($15,000-$20,000).
Because no prepackaged system provides a viable solution within the budget provided by CHI Haiti, the chosen approach was to design a custom, modular RO system with a photovoltaic power source. Since a variety of RO and solar system compo-nents are readily available on the market, the price of current commercial systems can be improved by designing an optimal system architecture composed of low-cost components. Through partnerships with suppliers and economies of scale, as well as through ever-reducing technological costs associated with solar power, development costs could be reduced further in the future.
1.2 Functional Requirements
Functional requirements for the desalination system in Bercy were determined in collaboration with CHI Haiti. The tar-get users are the 300 community members who rely on the Bercy well as a water source. The system must be able to:
1. Provide 900 gallons of total potable water per day for drink-ing and irrigation
2. Function off-grid, preferably through photovoltaics to take advantage of Haiti’s natural solar resource
3. Cost approximately $5,000 to source the components, within CHI’s budget for the project
2 REVERSE OSMOSIS SYSTEM DESIGN
The success of the RO system design hinges on three main parameters: (1) desired flow rate of desalinated water (perme-ate), (2) desired recovery ratio, and (3) feed water composition. Based on the sunlight availability, it was determined that the sys-tem should be direct-drive, as opposed to a syssys-tem with batteries that would require greater capital cost due to the batteries and additional solar panels. Assuming 8 hours of daily direct-drive operation (based on typical hours of sunlight per day), the Bercy well system needs to produce a minimum of 900 gallons per day (GPD) of permeate or a minimum of 2 GPM. Given that the well can produce up to 2,400 gallons every 8 hours, the system recov-ery ratio (the ratio of permeate to feed water) must be at least 37.5%. The feed water composition of the permeate must be be-low 1,000 ppm salinity to be potable.
2.1 Prevention of Scaling
A factor that frequently limits recovery ratios in brackish water is scaling. Scaling occurs when the solubility limit of sparingly-soluble salts is exceeded, causing the salt to precipitate out of solution. As the recovery of the system is increased, the concentrate exiting the membrane becomes significantly more concentrated than the entering feed water. If the solubility limit of a salt is exceeded, it will leave a solid residue on the mem-brane, clogging the system and requiring membrane cleaning or replacement. The specific chemical composition of the feed wa-ter dictates the highest possible recovery rate at which the system can operate without causing scaling.
An analysis of a water sample from the Bercy well, detailed in Table 1, revealed that calcium sulfate (also known as gypsum) presented the largest scaling risk. Using Visual MINTEQ [16], scaling due to gypsum was calculated to occur at a recovery ratio of 25% for the site’s water composition and system requirements. Since the well flow rate necessitates a recovery rate of at least 37.5%, the design needed to feature a way to prevent scaling at recovery ratios above 25%.
TABLE 1. Major contributors to the dissolved solids in the Bercy well water. Analyte mg/L Calcium 510 Magnesium 260 Sodium 910 Chloride 990 Sulfate 2000 Bicarbonate 390 Total (TDS) 5290
Several methods to prevent scaling at high recovery ratios were considered. These included (1) raising temperature to in-crease both gypsum solubility and system recovery; (2) injection of antiscalant; (3) and feed bypass of membranes for mixing with permeate. The analysis and conclusions associated with each of these methods are outlined below.
1. Temperature Effects
Previous studies have shown that calcium sulfate solubility in water can rise with increasing water temperature [17]. Us-ing Visual MINTEQ, an analysis of the concentrate’s chem-ical composition at varying recovery ratios and varying tem-peratures showed that a minimum temperature of 43 degrees Celsius is required to attain 37.5% recovery without scal-ing. This would involve heating the feed water flow upon
entering the reverse osmosis membranes for a total of 2400 gallons of water over the course of 8 hours, calling for a power input orders of magnitude greater than the amount of power required to pump water through the membranes, thus making this an infeasible solution for the final design. 2. Antiscalant
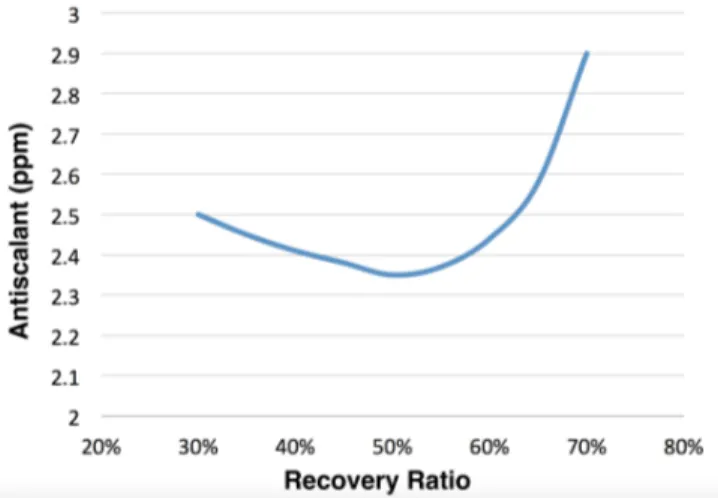
Antiscalant is a chemical that increases the apparent solubil-ity of certain salts by inhibiting crystal growth, or clumping, of the precipitated particles. Software provided by the man-ufacturer Avista Technologies, Avista Advisor 3 [18], was used to determine that the antiscalant Vitec 3000 could pre-vent scaling up to a theoretical maximum recovery rate of 73%. The required dosing amounts of are shown in Fig-ure 2. The specific antiscalant (Vitec 3000) was chosen for the system because it is already being regularly delivered to Haiti for use in a plant belonging to the Coca-Cola Com-pany. This should guarantee a reliable supply of antiscalant in the near future.
FIGURE 2. Quantities of antiscalant required for different system re-covery ratios.
3. Feed Bypass
In order to increase recovery rate, part of the feed stream will be mixed directly with the permeate, bypassing the mem-brane modules. Because RO memmem-branes have 99+% salt re-jection, the resulting permeate has considerably lower TDS than the 1,000 ppm permeate limit. Therefore, some pre-filtered feed water can be mixed with the permeate until the combined mixture reaches a concentration of 1,000 ppm. It was calculated that this method can supplement the recovery rate by up to 10%.
Due to the simplicity of a mixed permeate system with
an-tiscalant, as well as its effectiveness in increasing recovery rate while preventing scaling, both methods were selected for the fi-nal design.
2.2 Membrane Configuration
The design of the full-scale reverse osmosis module was performed using the Reverse Osmosis System Analysis (ROSA) software from DOW Chemical [19]. The flow requirements for the system were permeate output of 900 gallons over 8 hours of daily operation, with a recovery rate of at least 37.5% con-strained by the well capacity. Since most RO membranes are not designed to operate at a recovery ratio higher than 20-25%, mul-tiple membranes in series were required for the system. The de-sign was also constrained by limits on maximum permeate flow rate and minimum brine flow rate as recommended by membrane manufacturers to ensure proper membrane lifetime.
Four membrane configuration options were identified for their ability to meet the necessary permeate flow and recovery requirements. These configurations are shown in Figure 3 and their specifications in Table 2.
TABLE 2. Details of the four configurations in Figure 3.
Conf Membranes Re-circ Pressure Max % Recov
a 25-25-25-25 No 156 psi 48
b 40-40 No 123 psi 42
c 40-40-40 Yes 122 psi 60
d 40-40-40 No 98 psi 42
Configuration (d), a single-pass system with three DOW Filmtec LE-4040 membranes, was chosen for the final design on the basis of cost, power requirements, and system complexity. This configuration was chosen over configuration (b) because the high recovery rate for each membrane in configuration (b) would risk early degradation of the membranes. In addition, ration (d) has reduced complexity when compared with configu-ration (a), which has an additional membrane, and configuconfigu-ration (c), which requires recirculation.
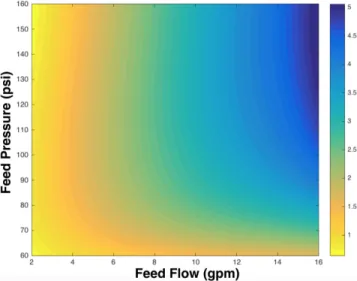
2.3 System Contour Plot
A system contour plot (Figure 4) was constructed in MAT-LAB for the chosen configuration. The contour plot demon-strates the relationship between system parameters such as the feed pressure, feed flow, and permeate flow. The system contour plot is developed independent of the pump characteristics and is only representative of the RO system itself. Notably, the perme-ate flow tends to be higher with increasing feed flow and feed pressure, as expected.
FIGURE 3. The four possible configurations to meet system needs, with the chosen configuration circled in red.
3 PHOTOVOLTAIC SYSTEM DESIGN 3.1 Solar Resource
The power output of a solar photovoltaic (PV) module de-pends primarily on the time-dependent solar irradiance for the location. Using the National Solar Resource Database (NSRDB), the half-hourly solar irradiance data for Bercy in 2011 and 2012 was acquired [20].
3.2 Selection of Solar Technology
Monocrystalline silicon was selected as the best solar PV technology for this application due to the long lifetime of monocrystalline silicon and its higher efficiency in warm weather compared to polycrystalline silicon. The specific panels chosen for the power system were Suniva OPT330-72-4-100, 1.95m2 panels which can be purchased at an average rate of $1.09/W.
FIGURE 4. System contour plot for the chosen configuration.
3.3 Solar Energy Yield Model
The one-diode model mathematically describes the current-voltage (IV) curve of the PV device for a given level of solar irradiance, given by:
I= Iph− I0(e(V +IRs)/kT− 1) − (V + IRs)/Rsh, (1)
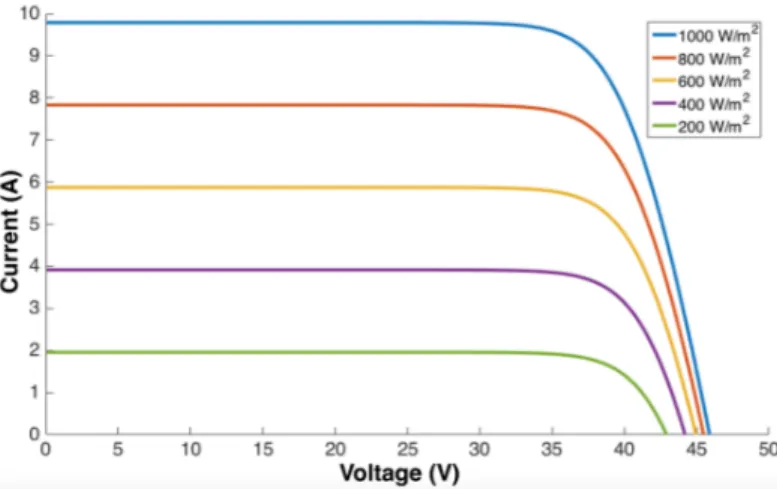
where I is the current output of the cell, Iphis the photogenerated current which is linearly dependent on the solar irradiance, I0is the dark current, V is the output voltage of the cell, Rsis the series resistance, k is Boltzmann’s constant, T is the cell temperature, and Rshis the shunt resistance. By fitting the one-diode model equation to the measured IV curve of the Suniva solar panel, the values for the different parameters were determined (Table 3).
TABLE 3. Fit values for 1 cm2 Suniva monocrystalline solar cell. Values fitted to the IV curve given in Suniva OPT340-72-4-100 72-cell panel datasheet using the one-diode model.
Parameter Fit Value I0 6.93 × 10⁻¹³A/cm2 Rs 1.28 Ω·cm2 Rsh 3.17 × 10⁷
The photogenerated current, Iph, varies linearly with the in-cident solar irradiance, resulting in a vertical shift of the IV curve. The shape of the IV curve in Figure 5 indicates that the output current near the maximum power point varies highly with
FIGURE 5. IV curve of the Suniva OPT330-72-4-100 solar panel, modeled using the one-diode equation and plotted for varying solar ir-radiance.
irradiance while the output voltage varies minimally. A fixed op-erating voltage was chosen that maximizes power output at most solar irradiance levels, approximately 37V as shown in Figure 5. By inputting the hourly irradiance data for Bercy into the IV curve model, the output power of the PV system throughout the course of the year can be predicted at half-hourly resolution.
4 INTEGRATED SYSTEM
The PV system was integrated to work in conjunction with the chosen membrane configuration. The PV panels should power the pump to pressurize the feed water such that the sys-tem operates at the intersection of the pump and syssys-tem curves. The daily water yield was estimated using the PV system model and the RO system contour plot. Experiments were conducted to measure the permeate output of the system operated at the power levels expected throughout the day.
4.1 Water Yield Model
4.1.1 Pump Curve The pump chosen for the desali-nation system was the Grundfos SQFlex 6SQF-2 submersible pump, which can operate on DC power and provide the required pressure and flow rate for the system. The product datasheet pro-vided the pump curves at various power inputs (used in Figure 6).
4.1.2 Relationship Between Power and Flow Rate 2-D system curves were extracted from the 3-D system contour plot (Figure 4) to isolate the relationship between pressure and feed flow rate at fixed recovery ratios. Similarly, the pump curves show the relationship between pressure and feed flow rate at fixed power inputs. The intersection of the two curves, as shown in Figure 6, corresponds to the operating points of the system at a
FIGURE 6. System curves at 30%, 40% and 50% recovery rates over-laid with pump curves at varying power.
given recovery ratio and input power. This established the rela-tionship between power and flow rate for the RO system.
Using 2011 solar irradiance data and the modeled relation-ship between power input and feed flow rate, the number of Suniva 72-cell solar panels required to meet the 900 GPD wa-ter requirement was calculated for each day of the year. The majority of days showed the requirement lying between one and two panels, leading to the selection of two Suniva 72-cell solar panels for the design.
Given the two Suniva 72-cell solar panels, the expected daily permeate flow based on 2011 weather data is illustrated in Fig-ure 7. The dark area represents the desired 900 GPD permeate yield. The dips in the plot correspond to cloudy and rainy days; the two largest dips took place during hurricanes. Since approxi-mately 50% of the water produced for the system is intended for agricultural use, the demand for desalinated water is expected to decrease on rainy days. For cloudy days without rain, extra water storage could be used to provide a buffer.
5 Experiment
5.1 Experimental Setup
Preliminary experiments and analysis substantiated that 37.5% recovery could be achieved while avoiding scaling. The final experiment aimed to validate both the conclusions from the preliminary experiments, as well as the theoretical system model of the previous sections. The pump was submerged in a 360-gallon tank and connected to a programmable DC power supply (5100W Keysight N8760A). The chosen 3-membrane configura-tion was connected to the pump with high-pressure piping and compression fittings. Flow meters, pressure gauges, and salinity meters were used to monitor experimental results. The schematic of the test system can be seen in Figure 8.
FIGURE 7. Daily permeate yield for 2011, calculated using the water yield model. The dark area represents the minimum permeate require-ment, 900 GPD.
FIGURE 8. The schematic for the final full-scale test experiment.
5.2 Experimental Results
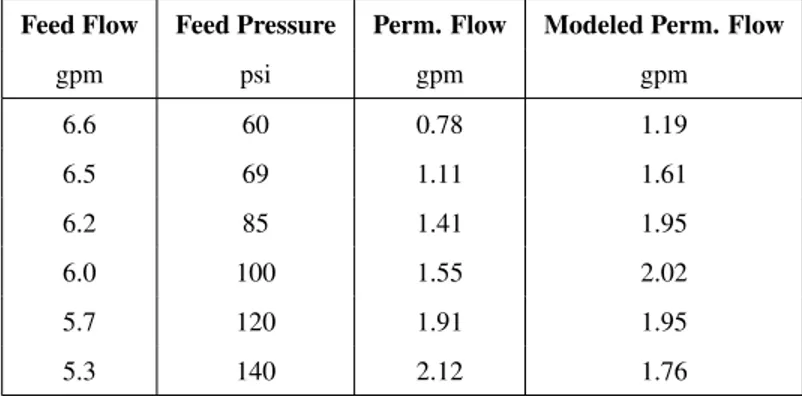
The operating points of the system during the experiment were compared to the theoretical system contour plot to deter-mine whether the power input yielded the expected permeate, brine, and feed flows. The experimental data deviated from the modeled system contour plot, as shown in Figure 9. These devia-tions can be attributed to approximately 20% uncertainty of per-meate flow for membrane elements due to ROSA’s model, and an additional 10% due to experimental error. Additional sources of uncertainty stem from physical system head losses and mea-surement errors. The errors observed in the experiments are sig-nificant, but the results demonstrate a general conformity to the modeled system contour plot. Further experiments and design work of the system will be conducted to validate the model’s ac-curacy.
FIGURE 9. Comparison between the experimental data points and the system contour plot.
TABLE 4. Numerical comparison between experimental system per-formance and the ROSA system model.
Feed Flow Feed Pressure Perm. Flow Modeled Perm. Flow
gpm psi gpm gpm 6.6 60 0.78 1.19 6.5 69 1.11 1.61 6.2 85 1.41 1.95 6.0 100 1.55 2.02 5.7 120 1.91 1.95 5.3 140 2.12 1.76
5.3 Conceptual Final Design
The system is projected to produce 900 gallons, or approxi-mately 3.4 m3of potable water per day. With conservative life-time estimates of 12 years for the solar panels, 3 years for the RO membranes, and 2 weeks for the filters, the total capital cost of the system over 12 years is $18,020. This results in an av-erage water production cost of $1.21/m3, which is significantly lower than the typical $6.5-9.1/m3for off-grid PV-RO systems. The system also operates with an average specific energy of 1.2 kWh/m3which is on the lower end of the typical 1.2-8 kWh/m3 for off-grid PV-RO system.
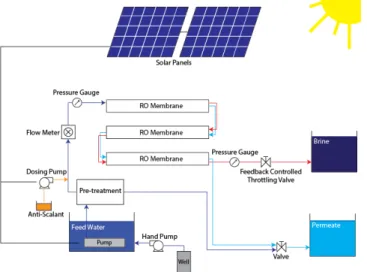
The successful implementation of the full-scale desalination system in Bercy, Haiti is contingent on the effective integration of the experimental system with the other crucial components. These include the solar panels (the power of which was repli-cated using the DC power supply), dosing pump to add the right amount of antiscalant, and feedback-controlled throttling valve. The full-scale system to be installed in Haiti in 2016 will
resem-ble Figure 10. Because the $5,000 budget is one of the critical constraints faced in this design project, the projected full system bill of materials is shown in Table 5.
FIGURE 10. The schematic for the future installation in Bercy, Haiti.
TABLE 5. Cost breakdown for proposed desalination system.
Component(s) Cost ($)
Solar Panels $720
Pump $1,800
Membranes, Housings $1,000
Dosing Pump ∼$100
Antiscalant (1 year supply) ∼$140 Filters, Housings ∼$60 Pipes, Fittings, Valves ∼$350 Pressure/Flow Meters $175 Water Storage Tanks $740
Total ∼$5,100
6 Broader Applications
With the solution presented in this paper, the designed de-salination system may have wider applications beyond the single site at Bercy well. Other locations that could benefit from low-cost PV-RO systems are described below:
1. According to the UN, sub-Saharan Africa is the second most water deprived continent, with over 783 million people liv-ing in water-scarce environments. Of these 783 million, 60% of the population has access to improved water sources (i.e., wells), but may not have the means to desalinate and purify its water sources. In addition to the water scarcity, 50% of the population resides off-grid. Even the majority of those on-grid have an unreliable grid infrastructure. PV-RO systems would be effective in these areas because of the high solar irradiance in the region [22].
2. The agriculture for global food supply in South America has been significantly impacted by the drought crisis. To miti-gate the effects of water scarcity and its impact on food sup-ply, farmers are looking for water restoration solutions [23]. Furthermore, 19% of the rural communities in South Amer-ica do not even have access to improved water sources [24]. 3. Fifty percent of desalination in the world occurs in the Mid-dle East. The region’s hot climate and limited rainfall con-tribute to an increasing demand for desalination systems, es-pecially among farmers. The effects of overpumping ground water and increasing salt composition in the soil cause sig-nificant agricultural constraints in the region, similar to the conditions in Haiti [25]. Small scale desalination systems such as the one detailed in this paper can provide much needed desalinated water for both drinking and agricultural uses.
4. Other potential applications include military camps in des-olate areas and disaster relief situations. In these scenarios, there is minimal access to the electric grid and thus an in-creased need to desalinate ground water.
The majority of benefactors of this PV-RO technology are located in off-grid or unreliable grid locations, and thus an addi-tional benefit of the implementation of the PV portion of the sys-tem would be to provide the community with electricity. Mem-bers of the community could use lights or other electronic de-vices with excess energy produced or when the desalination sys-tem is not in use.
7 Conclusion
The development of a village-scale, off-grid desalination system in Bercy, Haiti was initiated by Community Health Ini-tiative (CHI) Haiti in collaboration with the team at the Mas-sachusetts Institute of Technology (MIT). Preliminary analysis led to the choice of reverse osmosis as the method of desalina-tion and solar energy as a power source. To enable high recovery ratios without scaling, the system features permeate mixing with pre-filtered feed water and antiscalant dosing. A membrane con-figuration with three 40-inch long membranes of 4-inch diameter was chosen. The generated system contour plot for the preceding configuration was bounded by membrane operating limits.
Af-ter analyzing the local solar resource, a power system and pump were set to match the membrane configuration. The experiments that followed validated the theoretical system model and con-cluded that the system would operate as expected while meeting the functional requirements.
7.1 Future Work
The team plans to travel to Bercy with CHI Haiti to exam-ine the location and understand the behaviors and needs of the local community. Doing so will identify any necessary adjust-ments to the overall system design based on socioeconomic fac-tors. Then, following any further experiments and validation, the system components will be shipped to Bercy. In order to instill a sense of ownership of the desalination system into the commu-nity, the team will guide the community through its construction and installation.
ACKNOWLEDGMENTS
The team would like to thank Professor Amos Winter and Team Mentor Natasha Wright for their instruction and guidance in the MIT Mechanical Engineering course, 2.76 Global Engi-neering, in which this project began.
The team would also like to thank Chris Buresh and Annie Vander Werff at CHI Haiti for their continuing support and feed-back throughout the design and development process.
Finally, the team would like to thank the Tata Center for Technology and Design at MIT for their generous funding that supported this design project.
REFERENCES
[1] United Nations, The millennium development goals report 2013, Technical report, 2013.
[2] WHO / UNICEF Joint Monitoring Programme. Im-proved and unimIm-proved water sources and sanitation fa-cilities, Available at: http://www.wssinfo.org/definitions-methods/watsan-categories/. (Accessed: 2015).
[3] P. Strazzullo, L. DElia, N.-B. Kandala, and F. P. Cappuc-cio, Salt intake, stroke, and cardiovascular disease: meta-analysis of prospective studies, BMJ (Clinical Research Ed.), vol. 339, pp. b4567b4567, Nov. 2009.
[4] Salt affected soils— FAO — Food and Agricul-ture Organization of the United Nations. [On-line]. Available: http://www.fao.org/soils-portal/soil- management/management-of-some-problem-soils/salt-affected-soils/en/. [Accessed: 23-Nov-2015].
[5] Ghaffour, Bundschuh, Mahmoudi, Goosen, 2014, Re-newable energy-driven desalination technologies: A com-prehensive review on challenges and potential
applica-tions of integrated systems, Desalination 356:94-114, http://dx.doi.org/10.1016/j.desal.2014.10.024.
[6] Burgess, Lovegrove, ”Solar thermal powered desalination: membrane versus distillation technologies,” Centre for Sus-tainable Energy Systems, Department of Engineering Aus-tralian National University, 2005.
[7] Wright, N. C., and Amos G. Winter, V., 2014. Justification for community-scale photovoltaic powered electrodialysis desalination systems for inland rural villages in India. De-salination, 352 , pp. 8291.
[8] A.M. Bilton, S. Dubowsky, The modular design of pho-tovoltaic reverse osmosis systems: making technology ac-cessible to nonexperts, Desalination and Water Treatment (2012) 19443994.
[9] A.M. Bilton, R. Wiesman, A.F.M. Arif, S.M. Zubair, S. Dubowsky, On the feasibility of community-scale photovoltaic-powered reverse osmosis desalination sys-tems for remote locations, Renewable Energy 36 (2011) 32463256.
[10] Muhammad Tauha Ali, Hassan E.S. Fath, Peter R. Armstrong, ”A comprehensive techno-economical re-view of indirect solar desalination,” Renewable and Sustainable Energy Reviews, Volume 15, Issue 8, October 2011, Pages 4187-4199, ISSN 1364-0321, http://dx.doi.org/10.1016/j.rser.2011.05.012.
[11] Appliedmembranes.com, ”AMI Residential/Light Commercial RO Systems - AA Series — Ap-plied Membranes Inc.”, 2015. [Online]. Available: http://appliedmembranes.com/aa-series-ro-systems-220-to-1000-gpd.html. [Accessed: 13- Dec- 2015].
[12] Budget Water USA, ”Commercial Reverse Osmo-sis filtration provides pure, clean, great tasting wa-ter by removing TDS”, 2015. [Online]. Available: http://www.budgetwater.com/commercial-ro/. [Accessed: 13- Dec- 2015].
[13] Axeon, ”Flexeon AT-1000 Reverse Osmosis Commercial System,” 2015. [Online]. Available: http://www.axeonwater.com/Commercial-Reverse-Osmosis-Systems-AT-Series.html. [Accessed: 13- Dec-2015].
[14] Foreverpureplace.com, 2015. [Online]. Available: https://www.foreverpureplace.com/Solar-Oasis-1000-1000-GPD-Solar-Hybrid-Powered-p/solaroasis1000.htm. [Accessed: 13- Dec- 2015].
[15] Dwc-water.com, ”DWC-Water: Up to 3500 liters”, 2015. [Online]. Available: http://www.dwc- water.com/technologies/solar-reverse-osmosis/up-to-3500-litersd/index.html. [Accessed: 13- Dec- 2015].
[16] Visual MINTEQ 3.0, Jon Petter Gustafsson, KTH, Sweden. [17] G. Azimi, V. G. Papangelakis, and J. E. Dutrizac, Mod-elling of calcium sulphate solubility in concentrated multi-component sulphate solutions, Fluid Phase Equilibria, vol.
260, no. 2, pp. 300315, Nov. 2007.
[18] Avista Advisor 3. Avista Technologies, San Marcos, Cali-fornia, United States.
[19] Reverse Osmosis System Analysis 9.1, DOW Chemical Co., Midland, Michigan, United States.
[20] NSRDB Data Viewer. Available: https://mapsbeta.nrel.gov/nsrdb-viewer/#/?aL=8VWYIh% 255Bv%255D%3Dt&bL=groad&cE=0&lR=0&mC= 40.21244%2C-91.625976&zL=4.
[21] United Nations, The Millennium Development Goals Re-port 2013, 1 July 2013, ISBN 978-92-1-101284-2, avail-able at: http://www.refworld.org/docid/51f8fff34.html [Ac-cessed 13 December 2015]
[22] Un.org, ”Africa — International Decade for Action ’Water for Life’ 2005-2015”, 2015. [Online]. Avail-able: http://www.un.org/waterforlifedecade/africa.shtml. [Accessed: 13- Dec- 2015].
[23] Activist Post, ”Worldwide Water Short-age by 2040?”, 2014. [Online]. Available: http://www.activistpost.com/2014/07/worldwide-water-shortage-by-2040.html. [Accessed: 13- Dec- 2015]. [24] Food and Agriculture Organization of the
United Nations, Table 3, Access to im-proved water sources, 2014. Available: http://www.fao.org/nr/water/aquastat/countries regions/ americas/table03.pdf [Accessed: 13- Dec- 2015].
[25] P. B. Hazell, P. Oram, N. Chaherli, and others, Managing droughts in the low-rainfall areas of the Middle East and North Africa. International Food Policy Research Institute, 2001.
APPENDIX Terminology
salinity level / total dissolved solids
total weight of charged ions in milligrams dissolved per a liter of water, also referred to as parts per million, or ppm. potable water
water that has a salinity level of 1000ppm or less feed water
water that is input into a desalination system permeate
water that is the lower salinity level output concentrate / brine
water that is the higher salinity level output recovery rate
ratio of permeate volume produced to feed water volume in-put