HAL Id: insu-01574743
https://hal-insu.archives-ouvertes.fr/insu-01574743
Submitted on 16 Aug 2017HAL is a multi-disciplinary open access archive for the deposit and dissemination of sci-entific research documents, whether they are pub-lished or not. The documents may come from teaching and research institutions in France or abroad, or from public or private research centers.
L’archive ouverte pluridisciplinaire HAL, est destinée au dépôt et à la diffusion de documents scientifiques de niveau recherche, publiés ou non, émanant des établissements d’enseignement et de recherche français ou étrangers, des laboratoires publics ou privés.
Application of a microbial source tracking based on
bacterial and chemical markers in headwater and coastal
catchments
Emilie Jardé, Laurent Jeanneau, Loïc Harrault, Emmanuelle Quenot, Olivia
Solecki, Patrice Petitjean, Solen Lozach, Julien Chevé, Michèle Gourmelon
To cite this version:
Emilie Jardé, Laurent Jeanneau, Loïc Harrault, Emmanuelle Quenot, Olivia Solecki, et al.. Ap-plication of a microbial source tracking based on bacterial and chemical markers in headwater and coastal catchments. Science of the Total Environment, Elsevier, 2018, 610-611, pp.55-63. �10.1016/j.scitotenv.2017.07.235�. �insu-01574743�
1
Application of a microbial source tracking based on bacterial and chemical markers in headwater and coastal catchments.
Emilie Jardéa,*, Laurent Jeanneaua, Loïc Harraulta,1, Emmanuelle Quenotb, Olivia Soleckic, Patrice Petitjeana, Solen Lozachb, Julien Chevéd, and Michèle Gourmelonb
a
Geosciences Rennes CNRS UMR6118, Campus de Beaulieu, Bat. 15, 263 avenue du Général Leclerc, 35042 Rennes, France.
bIfremer, RBE-SG2M-LSEM, Laboratoire Santé Environnement Microbiologie, ZI de la Pointe
du Diable, CS 10070, 29280 Plouzané, France.
cIRSTEA, UR OPAALE, 17 avenue de Cucillé, CS 64427, 35044 Rennes, France.
dIfremer, Laboratoire Environnement Ressources de Bretagne Nord, 38 rue du Port Blanc,
BP 70134, 35801 Dinard, France.
*Corresponding author: Emilie Jardé
Email address: emilie.jarde@univ-rennes1.fr
Postal address:
Geosciences Rennes CNRS UMR6118 Campus de Beaulieu – Bâtiment 15 263 avenue du Général Leclerc CS 74205
35042 Rennes Cedex, France. Phone number: +33 (0)2 23 23 56 20
1
Present address: Department of Archaeology, School of Geosciences, University of Aberdeen, Aberdeen, UK
2
AbstractThis study identified sources of fecal contamination in three different French headwater and coastal catchments (the Justiçou, Pen an Traon, and La Fresnaye) using a combination of microbial source tracking tools. The tools included bacterial markers (three host-associated Bacteroidales) and chemical markers (six fecal stanols), which were monitored monthly over one or two years in addition to fecal indicator bacteria.168 of the 240 freshwater and marine water samples had Escherichia coli (E. coli) or enterococci concentrations higher than “excellent” European water quality threshold. In the three catchments, the results suggested that the fecal contamination appeared to be primarily from an animal origin and particularly from a bovine origin in 52% (Rum2Bac) and 46% (Bstanol) of the samples and to a lesser extent from a porcine origin in 19% (Pig2Bac) and 21% (Pstanol) of the samples. Our results suggested a human fecal contamination in 56% (HF183) and 32% (Hstanol) of the samples. Rainfall also impacted the source identification of microbial contamination. In general, these findings could inform effective implementation of microbial source tracking strategies, specifically that the location of sampling points must include variability at the landscape scale.
Keywords: fecal contamination, host-associated Bacteroidales markers, fecal stanols, rainfall, MST toolbox, mitigation actions.
1. Introduction
The microbial quality of coastal environments can be affected by fecal pollution from urban and agricultural sources. Fecal contamination affects waterways worldwide, leading to the closures or downgrading of shellfish-harvesting areas and bathing areas, and to outbreaks of food poisoning through the consumption of contaminated shellfish or waters (Pommepuy et al., 2005). To prevent these sanitary issues, fecal indicator bacteria; often E. coli or enterococci, are used as indicators to determine the level of fecal contamination in water and to classify the water quality as defined by the European regulations (EU 2006/7/EC directive;
3
regulation #854/2004). Different markers have been developed to compliment fecal indicators and allow microbial source tracking toolbox (MST toolbox) (Field and Samadpour, 2007). Specifically, these chemical and microbial markers distinguish fecal pollution sources, i.e. human, bovine, porcine, etc. (Boehm et al., 2003; Rusinol et al., 2016; Sidhu et al., 2013; Tran et al., 2015).
As highlighted by Tran et al. (2015), a suitable MST toolbox needs to be customized to the study area, including characteristics such as anthropogenic activities and land use patterns. In Brittany (northwestern France), the most widespread agricultural activity is intensive livestock, primarily cows and pigs. For this area, it is therefore necessary to distinguish between human, bovine, and porcine sources of fecal contamination. A suitable MST toolbox using microbial and chemical markers has been previously developed for the specific context in Brittany by Gourmelon et al. (2010). This toolbox combines three host-associated real-time PCR Bacteroidales markers designed to identify human (HF183), ruminant (bovine and ovine; Rum2Bac), and porcine (Pig2Bac) fecal contamination (Bernhard and Field, 2000; Mieszkin et al., 2009; Mieszkin et al., 2010; Seunrick et al., 2005) as well as fecal stanols, chemical markers whose distribution can be used to distinguish between human, porcine, and bovine sources of fecal contamination (Derrien et al., 2011; Derrien et al., 2015; Leeming et al., 1996). Real-time PCR markers have been found to offer high sensitivity and specificity, in this French region, ranging from 78% to 100% (Mauffret et al., 2012). A sensitivity of 78%, 98% and 100% was obtained for HF183, Rum2Bac and Pig2Bac, respectively. The lower sensitivity of HF183 was due to the few positive human feces samples whereas all the WWTP effluents tested were found positive. A specificity of 99%, 94%, and 99 % was obtained for HF183, Rum2Bac and Pig2Bac, respectively. Furthermore, these markers were found highly sensitive and specific in other countries. The review of 32 studies focusing on the HF183 marker by Ahmed and co-workers in 2016 (Ahmed et al., 2016) show an overall host sensitivity and specificity of 83.1% (n=1242 targeted fecal samples analysed) and 94.6% (n=2966 non targeted fecal samples tested). In addition,
4
Pig2Bac marker was also found highly specific in USA and Israel and Rum2Bac in USA (Raith et al., 2013; Heaney et al., 2015; Ohad et al., 2015).
In Europe, shellfish-harvesting areas and bathing areas are classified according to the fecal indicator bacteria level in shellfish (E. coli) and water (E. coli and enterococci; EU 2006/7/EC directive; regulation #854/2004). With regards to bathing areas, fecal indicator bacteria are used to monitor and classify bathing waters as insufficient, good, or excellent (threshold values in Table S1). Furthermore, a water bathing profile has to be established in all the European bathing areas, identifying the potential sources of fecal contamination (2006/7/EC directive).
There is therefore a need for tools to efficiently identify sources of fecal contamination in waters that do not comply with European water quality guidelines.
In this study, we used a MST toolbox based on bacterial and chemical markers at the catchment scale to study seasonal variations in term of intensity and sources of fecal contamination in three contrasting catchments in Brittany, France. We hypothesized that the use of a MST toolbox at a monthly frequency, in concert with precipitation data, should allow the determination of the main seasonal fecal contamination sources depending on the catchment land use and land cover. These results could help local stakeholders to improve land use management by decreasing microbial contamination threats.
2. Material and methods
2.1. Catchment characteristics and water sampling strategy 2.1.1. Justiçou, Pen an Traon and La Fresnaye catchments.
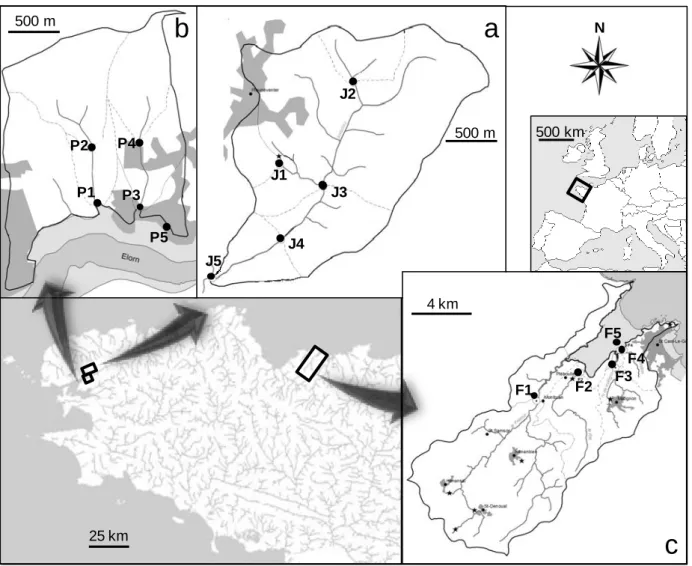
The Justiçou catchment (catchment J; 2,064 inhabitants; 9 km long; 5.6 km²) is located in the upstream part of the Elorn catchment (Figure 1, S1). The catchment of the Elorn estuary (Brittany, France) covers 385 km² and is located to the north-east of the Bay of Brest. A detailed description of this catchment can be found in Mieszkin et al. (2013). Fecal bacteria
5
sources in the catchment J include one wastewater treatment plant located at Plouneventer (WWTP; 1,298 inhabitants-equivalents, extended aeration activated sludge process, located just upstream of the J1 sampling point) pig, cattle, and poultry breeding (animal and human densities are shown in Figure S1), manure spreading, and livestock grazing area. Five sampling points (J1 to J5) were selected in order to include the impact of the WWTP on a small stream with pressure from intensive agriculture (Table S2, Figure 1).
The Pen an Traon catchment (catchment P; 629 inhabitants) is a coastal catchment, which covers 3.7 km² and includes a swimming area (Pen an Traon beach, P5) (Figures 1, S2). Catchment P is divided into two areas that drain two streams flowing into the Pen an Traon beach: (i) the Poul ar Vilin stream (1.2 km; 1.2 km²; P1 and P2) flows along a rural area mainly dominated by pastures and livestock, and (ii) the Pouldu stream (1.3 km; 1 km²; P3 and P4) flows along two small urban areas without a municipal WWTP and including pastures (Figure S2). In a recent swimming-water profile study (Patris and Perenne, 2011), these two streams were identified as potential contributors (4% of the E. coli fluxes in the Elorn estuary) to fecal contamination inputs. The high E. coli concentration and their proximity to the swimming beach increase risk of contamination. Five sampling points were monitored upstream and downstream from the Poul ar Vilin (P1 and P2) and Pouldu streams (P3 and P4) and at the Pen an Traon beach (P5, Table S2). These two headwater catchments were chosen to evaluate point and non-point fecal contamination sources.
The La Fresnaye catchment (catchment F; 121 km²; 6,923 inhabitants) is located in the northeastern part of Brittany (Figures 1, S3). Catchment F is divided into four sub-catchments: Fremur (river length=50 km, area=77.4 km², F1), le Rat (river length=10.5 km, area=19.2 km², F2), le Clos (river length=8.7 km, area=13.3 km², F3), and Kermiton (river length=2.3 km, area=6.3 km², F4). The catchment includes 12 towns with seven WWTPs: two activated sludge WWTPs, three lagoon-based WWTPs, two reed bed filter WWTPs, and one using rotating biological contactors dimensioned for 250 to 16,000 inhabitants-equivalents). Catchment F has intensive livestock production (Figure S3). Sampling points were monitored at the outlet of each sub-catchment (F1: Fremur; F2: Le Rat; F3: Le Clos;
6
F4: Kermiton) and in the seawater (F5), which was always sampled at high tide, downstream of the outlet of the Kermiton stream (F4).
2.1.2. Water sampling strategy
Monthly monitoring was performed over a one-year period in the catchments J and P (from August 23rd, 2010 to July 17th, 2011) and over a two-year period in the catchment F (from February 25th, 2013 to January 5th, 2015). Water samples were collected from the surface (top 10-cm) using sterilized bottles and were immediately placed in an ice chest, where they were kept until analysis. All samples were filtered in the laboratories within one day of sampling.
2.2. Water sample analysis
2.2.1. Enumeration of fecal indicator bacteria
Escherichia coli and enterococci were counted using microplate methods (EN ISO 9308-3
[Anonym. 1999a] and EN ISO 7899-1 [Anonym. 1999b]), respectively, with a detection limit of the 15 most probable number (MPN) per 100 mL of water sample.
2.2.2. Host-associated Bacteroidales marker analysis
Water samples (1 L) were either filtered under sterile conditions through 0.45 µm nitrocellulose membranes (Pall Gelman GN-6 Metricel; Pall Corporation) or centrifuged for highly turbid samples. DNA was extracted using the Fast DNA for soil kit (MP Biomedical) and DNA extracts were eluted in 100 µl DNA Elution Solution-Ultra Pure Water and stored at -80°C until PCR analysis. Host-associated Bacteroidales markers were quantified by real-time PCR as previously reported by Mauffret et al. (2012) and using the primers and probes described by Seurinck et al. (2005): HF183 and Mieszkin et al. (2009-2010): Pig2Bac and Rum2Bac. The procedure is described in detail in the supplementary information.
7
Fecal stanols were extracted from filtered (0.7 µm glass-fiber) water samples (1 L) by solid phase extraction and quantified by gas chromatography coupled to mass spectrometry using an internal calibration as described by Jeanneau et al. (2011). The procedure is described in detail in the supplementary information.
2.3. Climatic and chemophysical parameters
Rainfall data (1-day cumulative rainfall) were provided by the meteorological stations from Meteo France at Guipavas (48°25'59.99"N; -4°24'0"W - catchments J and P) and Pleurtuit (48°34'59.98"N; -2°4'0.01"W - catchment F).
Water temperature (°C) and dissolved oxygen (mg/L) were measured using a multi sensor probe 3430 (WTW) equipped with a FDO 925 electrode, and Tetracon 925 electrode on non-filtered water samples. Turbidity (NTU) was measured at the laboratory using an HACH 2100N turbidimeter.
A specific focus on the effect of rainfall intensity on FIB or fecal marker levels or their presence in the water samples was performed. Samples were grouped into three classes of rainfall intensity: no rain, rainfall intensity < 10 mm, and rainfall intensity ≥ 10 mm (1-day cumulative rainfall).
2.4. Statistical analyses
All statistics were performed using XLSTAT 2013, Addinsoft. Non-parametric Kruskal-Wallis tests were performed with Dunn's multiple comparison tests as a post-hoc test with a 99% confidence level (= 0.01). Spearman correlations (= 0.01) were performed to test for significant correlations between chemophysical or climatic parameters and fecal indicators or fecal markers.
The stanol fingerprints of the water samples were investigated using the PCA model developed by Derrien et al. (2012) to differentiate between human, porcine, and bovine sources of fecal contamination. With this model, fecal stanols can be used to identify human
8
(Hstanol), bovine (Bstanol) and/or porcine (Pstanol) fecal contamination. The procedure is described in detail in the supplementary information.
The results (source assignment with host-associated Bacteroidales markers and fecal stanols) were ranked in four classes from A to D:
A: both markers gave the same source assignment (either a single source or a combination of two or three sources).
B: one marker gave a source assignment (either a single source or a combination of two or three sources) and the other did not provide a source assignment.
C: both kinds of markers gave different source assignments (no common source identified by host-associated Bacteroidales and fecal stanols).
D: no markers were quantified or detected.
3. Results and Discussion
3.1. Overview of fecal contamination levels in the catchments.
Escherichia coli and enterococci were quantified in respectively 97% and 80% of the 240
water samples (Table S3). E. coli levels exceeded the European “excellent” water quality guideline values for inland and marine waters (≥ 2.7 log10 MPN/100 mL and ≥ 2.4 log10
MPN/100 mL, respectively) in 71% of the rivers and 47% of the marine waters. Enterococci levels exceeded the threshold for the “excellent” classification (according to the 2006/7/CE directive) for inland and marine waters (≥ 2.3 log10 MPN/100 mL and ≥ 2 log10 MPN/100 mL,
respectively) in 50% of the rivers and 28% of the marine waters.
In catchments J, P, and F, E. coli was quantified in 100%, 92%, and 98% of the waters, respectively. The E. coli levels ranged from 1.6 to 5.8 log10 MPN/100 mL in catchment J, from
1.2 to 4.8 log10 MPN /100 mL in catchment P, and from 1.2 log10 MPN/100 mL to 5.3 log10
MPN/100 mL in catchment F. (Figure 2 and Table S3). In catchments J, P, and F, enterococci were quantified in 88%, 70%, and 82% of the waters, respectively. The enterococci levels ranged from 1.6 to 6.4 log10 MPN/100 mL in catchment J, from 1.2 to 4.5
9
log10 MPN /100 mL in catchment P, and from 1.2 log10 MPN/100 mL to 4.8 log10 MPN/100 mL
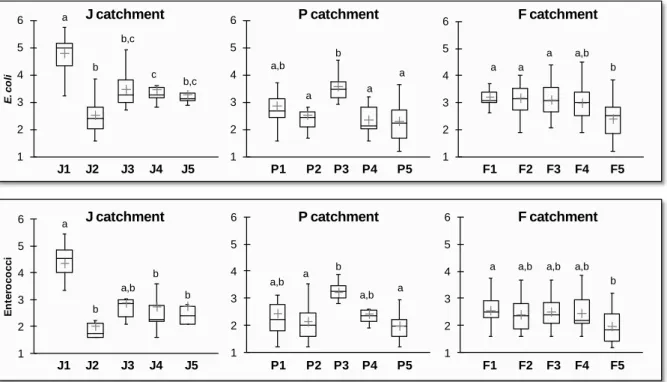
in catchment F (Figure 2 and Table S3). In catchment J, E. coli and enterococci levels were especially high at point J1 (from 3.2 to 5.8 log10 MPN/100 mL for E. coli concentrations and
from 2.5 to 5.4 log10 MPN/100 mL for enterococci concentrations) compared to J2 to J5
(Figure 2). J1 is located downstream of the WWTP effluent (Table S2). In catchment P, no significant difference between the sampling points was observed. In catchment F, the E. coli concentrations were significantly lower in marine waters (F5) than in river waters (F1 to F4, Figure 2). The E. coli levels exceeded the “excellent” threshold in 83%, 50%, and 73% of the river samples from the catchments J, P, and F, respectively. Marine waters exceeded the “excellent” E. coli threshold in 33% of the samples in catchment P and 54% in catchment F. The enterococci levels exceeded the “excellent” threshold in 57%, 42%, and 50% of the river samples from the J, P and F catchments, respectively. Marine waters exceeded the “excellent” E. coli threshold in 33% of the samples in catchment P and 25% in catchment F.
3.2. Reliability of the MST toolbox.
The reliability of the MST toolbox based on host-associated Bacteroidales markers and fecal stanols was evaluated on the 168 of 240 samples that exceeded the “excellent” threshold (see threshold values in Table S1).
Evaluation of the toolbox was based on the ability to consistently identify the origins of fecal contamination as determined by host-associated Bacteroidales and fecal stanols.
54% of samples fell into class A (both kinds of markers gave the same source assignment), 29% in class B (one kind of marker gave a source assignment), 10% in class C (both kinds of markers gave different sources), and 8 % in class D (no markers were quantified or detected). The MST toolbox was considered efficient in 83% of the samples (A+B classes). The differences in source assignments between the two kinds of markers observed for the class B and C samples could be due to differential persistence of fecal stanols and host-associated Bacteroidales markers in surface water (Jeanneau et al., 2012; Solecki et al., 2011). For example, for 11 of the 17 class C samples, fecal stanols assigned a porcine
10
origin, whereas host-associated Bacteroidales assigned a bovine and/or human origin. Pig slurry storage lead to a decrease in the Pig2Bac detection rates (Mieszkin et al., 2009) and Pig2Bac has a lower persistence time (T90 = 1.9 days) than the porcine stanol fingerprint (T90
between 29.1 and 32.0 days, Solecki et al., 2011). Consequently, it would be preferable not to use those results in terms of catchment management, and to perform further investigations on those sampling points.
All class D samples were collected in catchments F (seven marine waters from F5 and three inland waters from F4) and P (two marine waters from P5 and one inland water from P4) with
E. coli levels ranging from 2.4 (F5 on December 2nd, 2013) to 4.3 log10 MPN/100 mL (F4 on
September 8th, 2014), and enterococci levels ranging from 1.2 log10 MPN/100 mL (F5 on
October 6th, 2014) to 3.1 log10 MPN/100 mL (F4 on October 7th, 2013). Dilution,
sedimentation with particles and/or additional fecal sources (birds, wild animals, etc.) might explain the lack of fecal source assignment.
To assess the reliability of the MST toolbox in less contaminated waters, we also included the 72 samples with E. coli or enterococci levels below the “excellent” water quality guideline values. Classes A, B, C, and D represented 51%, 30%, 9%, and 10% of the samples, respectively. The reliability of the MST toolbox remains unchanged with a clear source assignment for 81% of the samples.
3.3. Dynamics of fecal contamination at the landscape scale.
Throughout the three catchments, the results suggested that the main fecal contamination was from an animal origin, and primarily bovine in 52% (Rum2Bac) and 46% (Bstanol) of the samples, and secondarily porcine, in 19% (Pig2Bac) and 21% (Pstanol) of the samples. The results suggested a human fecal contamination in 56% (HF183) and 32% (Hstanol) of the samples (Table S3). HF183 (56%) was more prevalent than Hstanol (32%) in the 168 water samples. In 25 of the samples with HF183 and no human stanol fingerprint, stanols indicated an animal fecal contamination source whereas host-associated Bacteroidales indicated a mixture of animal and human contamination. In 8 samples, only HF183 was quantified, and
11
stanols indicated fecal contamination from animal origin. In the last 14 samples, stanols were not detected. One explanation for these patterns is differential persistence of fecal stanols and host-associated Bacteroidales markers in surface water. However, a previous microcosm study (Jeanneau et al., 2012) suggested a longer persistence time for human stanol fingerprint (T50 between 3.8 and 5.4 days, Jeanneau et al., 2012) than for HF183
(T90=1.7 days). Fecal stanols are mainly used to track human fecal contamination from
WWTP. It has been demonstrated that the intensity of the cholesterol-to-coprostanol conversion in the intestine is highly variable among humans (Gerard, 2014), which could lead to a lack of sensitivity of fecal stanol to track individual septic systems. The difference in the identification of human fecal contamination with host-associated Bacteroidales and fecal stanols strengthens the need to use MST toolbox based on several markers to identify the fecal sources at the catchment scale.
Besides fecal contamination from animal origin, human contamination remained important at the catchment scale and remained a problem in terms of risk assessment because human health risk appears to be substantially higher in waters impacted by human sources compared to animal sources such as sea birds, poultry or pigs (Soller et al., 2010). One explanation for this is the host-specific nature of viruses such as noroviruses which are the most frequently identified pathogen in shellfish outbreaks (Campos and Lees, 2014; Le Guyader et al, 2013).
3.3.1. Spatial variability
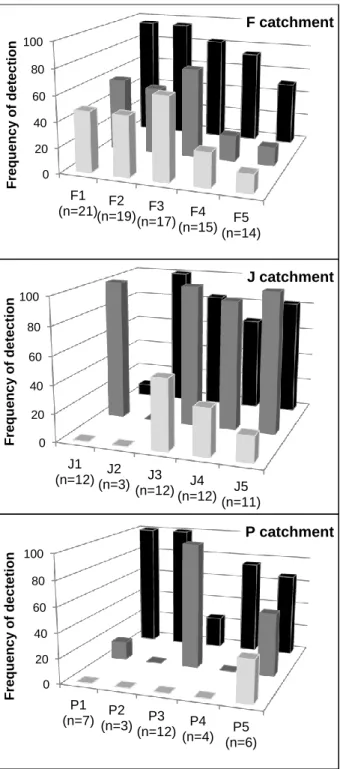
Figure 3 presents the frequency of detection of human, bovine, and porcine markers (host-associated Bacteroidales and/or fecal stanols) at the different sampling points in the three catchments.
In catchment J, host-associated markers were mainly from human (92% of the samples) and bovine (62% of the samples) fecal contamination. Only bovine markers were quantified at J2, the upstream sampling point for catchment J. The prevalence of human markers in this catchment is likely due to the WWTP located just upstream J1, which degrades water quality
12
through point J5 (the downstream station in this catchment). Porcine markers (24% of the samples) were quantified at J3 (50%), J4 (33%) and J5 (18%), corresponding to porcine density in this area (around 2091 ± 207 pig/km²; Table S2 and Figure S1).
Catchment P is a small headwater catchment mainly characterized by pastures and livestock (a bovine density range from 102 to 121 cattle/km², Table S2 and Figure S2). Fecal contamination was mainly from bovine sources (63% of the samples). The occurrence of exclusively bovine markers at the upstream sampling points (P2 and P4) is in line with the cattle density and land use. Human markers (50% of the samples) only occurred downstream (P1 and P3) following human density (40 and 328 inhabitants/km², respectively, Table S2 and Figure S2). At P5, the beach sampling point, the fecal contamination came from all three sources studied here (human, bovine, and porcine).
Bovine (81% of the samples), human (45% of the samples), and porcine markers (42% of the samples) were quantified in all of the sampling points from catchment F. This catchment is also characterized by the highest frequency of detection of pig markers (42% of the samples) compared to catchment J (24% of the samples) and P (6% of the samples), while the pig density is three times lower in catchment F than in catchment J. This lack of relationship between pig density and the occurrence of pig markers might be due to the management practice of spreading pig slurry which is subject to a regional spreading schedule and can be carried out both inside and outside the catchment.
At the landscape scale, the spatial variability highlights that headwater catchments are mainly impacted by one source of microbial contamination; however as one moves downstream, this specificity is lost due to a combination of sources. Both scales are important to improve management strategies, especially in nested catchments. While large catchments can be used to identify the main sources, the headwater catchment scale is the operational size to develop management strategies.
13
3.3.2. Impact of climatic and chemophysical parameters on fecal indicator bacteria and markers.
Water turbidity and rainfall can have an effect on fecal matter diffusion from soils to water through soil leaching and feces degradation (Villemur et al., 2015). Among the different monitored climatic and chemophysical parameters (water temperature, dissolved oxygen, turbidity and rainfall, Table S4), rainfall was most strongly correlated (value <0.0001 to p-value <0.001) with fecal indicator bacteria (p-p-value <0.0001, r=0.33 and 0.34 with E. coli and enterococci, respectively) and fecal human markers (p<0.0001, r=0.46, 0.36 and 0.26 with Rum2Bac, Pig2Bac and Pstanol, respectively). Turbidity was very weakly correlated with fecal indicator bacteria (p-value <0.01, r= 0.09 and 0.12 with E. coli and enterococci, respectively) and weakly with HF183 (p-value <0.01, r=0.104). Turbidity and rainfall were significantly correlated (p-value <0.0001, r=0.39), as expected Moatar et al. (2017).
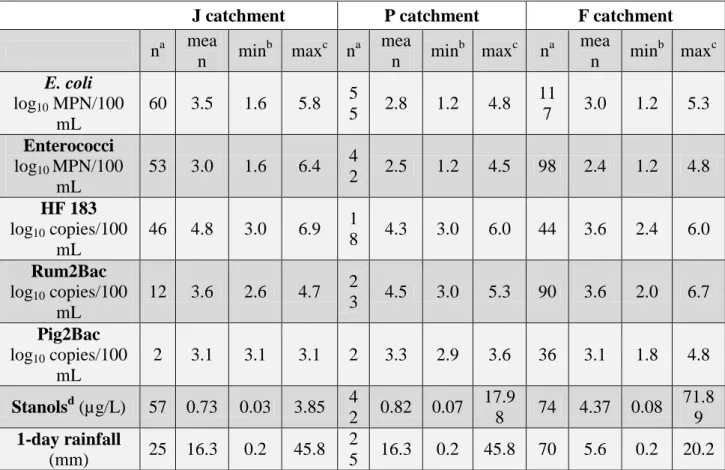
The mean and maximum cumulative 1-day rainfall values were more than two times higher in the J and P catchments than in catchment F (Table 1). In catchments J and P, the daily rainfall was higher than 10 mm (Table S3) on three sampling dates (August 2010, January 2011, February 2011), in catchment F the rainfall was higher than 10 mm on three sampling dates over the two year period (March 2013, November 2013 and 2014). Heavy rainfall (more than 20 mm per day in Brittany; Dubreuil et al., 1996) only occurred on three sampling dates in the three catchments, in August 2010 and February 2011 in catchments J and P and in March 2013 in catchment F. Among the 168 samples (50 at J, 32 at P and 86 at F) with E.
coli or enterococci concentrations exceeding the “excellent” water guideline value, samples
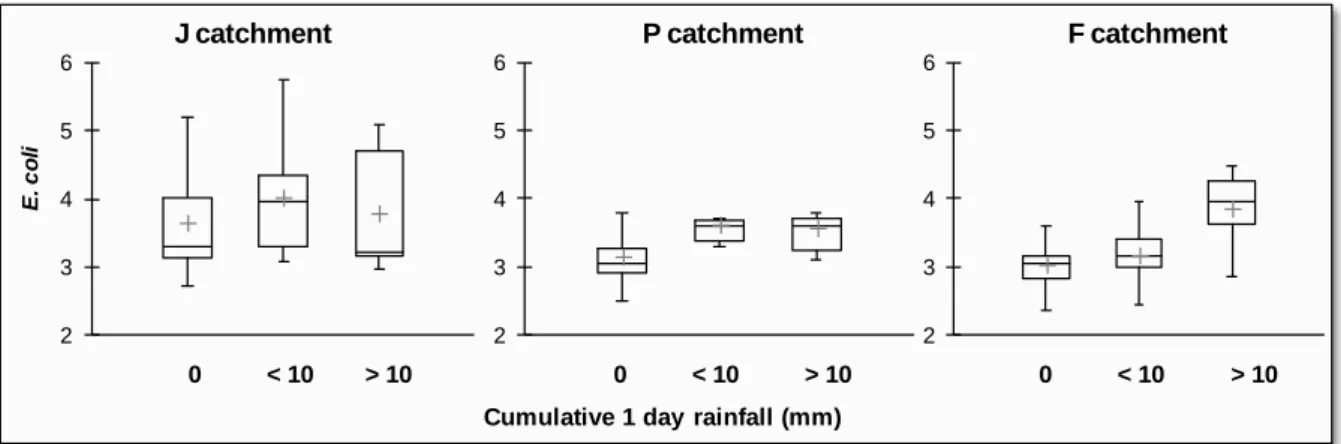
collected during wet periods (with rainfall ≥ 10 mm per day) represented 26% at J, 25% at P, and 17% at F. In the three catchments, there were more samples (56% at J, 53% at P, and 29% at F) with high E. coli concentrations that were collected during dry periods (no rain before sampling). Figure 4 represents the E. coli concentrations (log10 MPN/100 mL) by
cumulative amount of rainfall (mm) during one day prior to sampling at the three catchments for samples with proven fecal contamination.
14
Rainfall had contrasting effects on the E. coli concentrations in catchments J, P, and F. In catchment J, the highest, average and lowest E. coli concentrations were quite similar irrespective of the rainfall intensity (no significant difference according to the rainfall intensity has been recorded). In catchment P, the E. coli concentrations increased with low rain intensity (0 < rain < 10 mm) and remain stable when the rainfall intensity was over 10 mm. In catchment F, the highest, average and lowest E. coli concentrations continuously increased with increasing rain intensity (p-value = 0.004 between the dry and wet periods in catchment F), but were significantly lower overall than in catchment J (p-value = 0.001). These different rainfall effects in the three catchments could be due to different sampling times since rainfall-runoff increases the E. coli concentration for a very short time period (2-3 hours depending on the size of the catchment; Bougeard et al., 2011). Samples were not always taken in the three catchments over this short period of time. Several authors have studied the effect of rainfall on fecal indicator bacteria concentrations and showed that rainfall is deemed to be one of the most important hydrological factors affecting the transport of fecal indicator bacteria in the environment (Heaney et al., 2015; Tran et al., 2015). However, as already mentioned in Tran et al. (2015), the impacts of rainfall and the previous dry period on fecal indicator bacteria showed conflicting results that strongly depended on both the geographical area and studied catchment which are; difficult to quantify (Liang et al., 2015). Moreover, as demonstrated by Muirhead et al. (2005), the majority of the E. coli originating from fecal sources can withstand leaching during rainfall events and be released later (Muirhead and Monogan, 2012). This observation suggests that E. coli leaching should be considered as a diffusive pollution event instead of a point source.
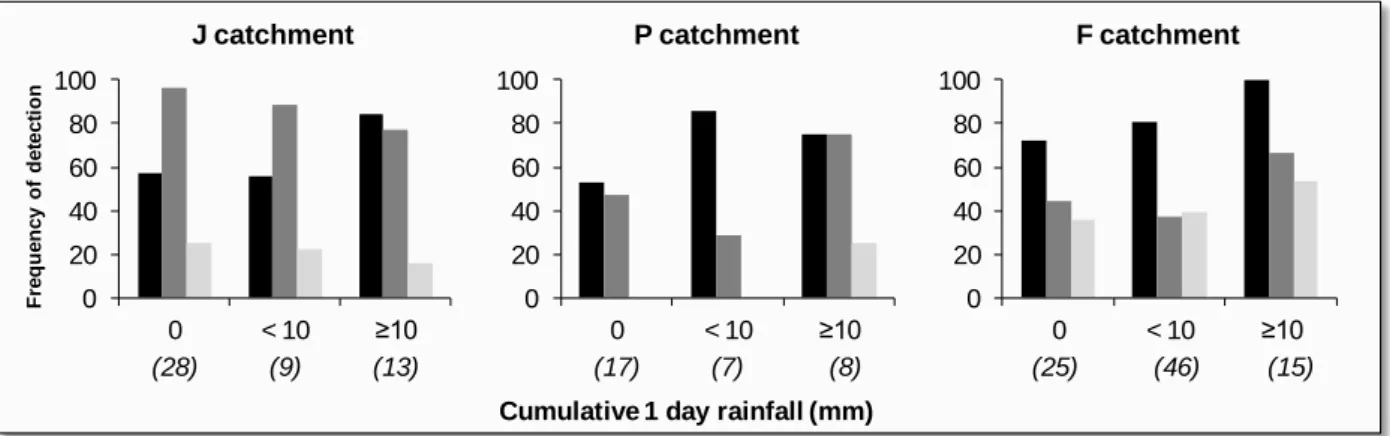
The detection frequency of bovine markers increased with rainfall in the three catchments (Figure 5). Muirhead and Monogan (2012) identified rainfall runoff as the primary pathway for fecal losses from agricultural catchments with dairy livestock activities. Moreover, a positive correlation between 1-day rainfall and ruminant-associated Bacteroidales markers (Rum2Bac) was observed here (p-value <0.0001, r=0.46, Table S4) and in another French
15
catchment (Mauffret et al., 2012). In catchments J and F, this increase was effective for rainfall ≥ 10 mm, while in catchment P, a < 10 mm rainfall was sufficient enough to produce this result. These different relationships can result from catchment topography, which controls surface runoff (Collins et al., 2005; Rusinol et al., 2016). In catchment P, the average slope (Figure S3) is 4.5%, which is two to three times higher than in catchments J and F. In Brittany, bovine cattle are primarily reared outdoors on grass with a direct input of fecal matter. Consequently, runoff from grazing fields is an important export mechanism for bovine fecal contamination (Muirhead and Monogan, 2012).
The relationship between rainfall and the detection frequency of human markers was also catchment dependent. In catchments P and F, the detection frequency of human markers increased for rainfall ≥ 10 mm. These increases could be due to exceedance of the waste water treatment capacity of collective plants and/or individual septic systems (Rusinol et al., 2016). Conversely, in catchment J, the detection frequency of human markers decreased from 96% to 77% with increasing rainfall intensity. This could be due to a dilution effect of the WWTP input located upstream J1.
Similarly to the detection of human markers, the relationship between rainfall and the detection frequency of pig markers was catchment dependent. In catchment J, it decreased from 25% to 15% when the rainfall intensity increased. In catchment P, pig markers were only detected at P5, which is the beach point influenced by inputs from outside the catchment P and for rainfall ≥ 10 mm. In catchment F, the detection frequency of pig markers remained stable (from 36% to 39%) for rainfall < 10 mm and increased to 53% for rainfall ≥ 10 mm. In catchment J, pig markers seem to be diluted by rainfall, which could indicate a chronic point source contamination that is similar, but with a lower impact, to a WWTP effluent impact. In catchments P and F, the detection frequency of pig markers increased with rainfall >10 mm, which probably results from runoff from agricultural areas enriched with pig slurry.
16
To summarize, in catchment J, a small urban headwater catchment (5.6 km²), rainfall did not modify E. coli concentrations, which are mainly controlled by the continuous discharge from a WWTP. In catchment P, a rural headwater catchment (3.7 km²) dominated by livestock, moderate rainfall (< 10 mm) induced an increase in the E. coli concentrations mainly through the mobilization of cow feces during heavy rainfall (≥ 10 mm) and individual human septic systems could be also mobilized. In catchment F, a larger catchment (116 km²), the E. coli concentration trends was controlled by the rain intensity. Moderate rainfall (< 10 mm) induced a moderate increase in the E. coli concentrations mainly due to runoff from cattle grazing areas located close to the streams. Heavy rainfall (≥ 10 mm) induced a significant increase in the E. coli concentrations due to runoff from cattle grazing areas, agricultural areas enriched with pig slurry, and an exceedance of the WWTP capacity of collective plants and/or individual septic systems.
5. Conclusion
In the three monitored catchments, fecal contamination was mainly from a bovine origin. As the cattle primarily graze in outdoor pastures, feces may be leached by rainfall leading to export to streams throughout the season, acting as a diffusive contaminant source.
As stated by Collins (2004) and Rusinol et al (2016), a way to prevent this diffusive fecal contamination from cattle could be to physically exclude or at least to limit exchanges between grazing pastures from rivers via the implementation of fences around grazed meadows, for example.
Fecal contamination from humans was also significant in the three catchments. This is particularly concerning since the health risks associated with exposure to waters impacted by human fecal sources are more harmful than waters contaminated by animal sources (Soller et al., 2010). The management of stormwater overflows and the effective sizing of WWTPs could be reliable mitigation actions to limit human fecal contamination at the catchment scale (McLellan et al., 2007).
17
In conclusion:
- The quantification of fecal indicator bacteria is prerequisite for all studies dealing with fecal contamination.
- The association of both bacterial and chemical markers is highly efficient to identify the main source of fecal contamination in water samples (83% of the samples in this study).
- At the catchment scale, the sampling strategy has to be carefully planned to include catchment characteristics such as hydrology, topography, and the known potential sources of contaminations (farms, WWTPs etc.). For example, the sources of fecal contamination in the headwaters of a catchment are mainly driven by single sources whereas at the outlet, sources of fecal contamination are less species-specific due to source mixing.
- Rainfall is the most significant environmental parameter driving the transfer of fecal contamination from soil to streams.
Acknowledgements
This work has been partially funded by the Fond Unique Interministeriel, Regional council of Brittany, County council of Morbihan, County council of Finistère and Brest Métropole Océane by (Marquopoleau project) and by the European Regional Development Fund Interreg IVa program (Riskmanche project). We thank C. Marin and C. Hubert from Ifremer and E. Guillerm from Labocea for their technical support. We are especially grateful for the assistance of local stakeholders for their permission to take samples and to share catchment characteristic data. Dr. Benjamin W. Abbott and Dr. S. Mullin post-edited the English style (www.trad8.eu/us/sara-mullin.html).
References
Anonymous, 1999a. NF EN ISO 9308-3: water quality. Detection and enumeration of
Escherichia coli and coliform bacteria in surface and waste water. Miniaturized method (most
probable number) by inoculation in liquid medium. International Organization for Standardization, Geneva, Switzerland.
18
Anonymous, 1999b. NF EN ISO 7899-1: water quality. Detection and enumeration of intestinal enterococci in surface and waste water. Miniaturized method (most probable number) by inoculation in liquid medium. International Organization for Standardization, Geneva, Switzerland.
Ahmed, W., Hughes B., Harwood V.J., 2016. Current status of marker genes of Bacteroides and related taxa for identifying sewage pollution in environmental waters. Water 2016, 8, 231-258. doi:10.3390/w8060231.
Bernhard, A.E., Field, K.G., 2000. A PCR assay to discriminate human and ruminant feces on the basis of host differences in Bacteroides-Prevotella genes encoding 16S rRNA. Applied Environmental Microbiology 66, 4571-4574. doi: 10.1128/AEM.66.10.4571-4574.2000
Boehm, A.B., Fuhrman, J.A., Mrse, R.D., Grant, S.B., 2003. Tiered approach for identification of a human fecal pollution source at a recreational beach: case study at Avalon Bay, Catalina Island, California. Environmental Science & Technology 37, 673–680. doi: 10.1021/es025934x
Bougeard, M., Le Saux, J-C., Pérenne, N., Baffaut, C., Robin, M., Pommepuy, M., 2011. Modeling of Escherichia coli fluxes on a catchment and the impact on coastal water and shellfish quality. Journal of the American Water Resources Association 47, 350-366. doi: 10.1111/j.1752-1688.2010.00520.x
Campos, J.-A., Lees, D.N., 2014. Environmental transmission of human noroviruses in shellfish waters. Applied Environmental Microbiology 80, 3552–3561. Doi: 10.1128/AEM.04188-13
Collins, R., 2004. Fecal contamination of pastoral wetlands. Journal of Environmental Quality, 33, 1912-1918. doi: 10.2134/jeq2004.1912
Collins, R., Elliott, S., Adams, R., 2005. Overland flow delivery of faecal bacteria to a headwater pastoral stream. Journal of Applied Microbiology 99, 126-132. doi: 10.1111/j.1365-2672.2005.02580.x
Derrien, M., Jardé, E., Gruau, G., Pierson-Wickmann, A.C., 2011. Extreme variability of steroid profiles in cow feces and pig slurries at the regional scale: implications for the use of steroids to specify fecal pollution sources in waters. Journal of Agricultural and Food Chemistry 59, 7294–7302. doi: 10.1021/jf201040v
Derrien, M., Jardé, E., Gruau, G., Pourcher, A.M., Gourmelon, M., Jadas-Hecart, A., Pierson-Wickmann, A.C., 2012. Origin of fecal contamination in waters from contrasted areas: stanols as microbial source tracking markers. Water Research 46, 4009-4016. doi: 10.1016/j.watres.2012.05.003
Derrien M., Arcega Cabrera, F., Libertad Velazquez Tavera, N., Kantun Manzano, C.A., Capella Vizcaino, S., 2015. Sources and distribution of organic matter along the Ring of Cenots, Yucatan, Mexico : Sterol markers and statistical approaches. Science of the Total Environment 511, 223-229. doi: 10.1016/j.scitotenv.2014.12.053
Dubreuil, V., Huon, F., Lejeune, C., 1996. Les précipitations intenses en Bretagne. Norois 170, 395-406.
19
EU Directive 2006/7/EC of the European Parliament and of the Council of 15 February 2006 concerning the management of bathing water quality and repealing Directive 76/160/EEC. Off. J. Eur. Union 2006, L64, 37–51.
Field, K.G., Samadpour, M., 2007. Fecal source tracking, the indicator paradigm, and managing water quality. Water Research 41, 3517–3538. doi: 10.1016/j.watres.2007.06.056 Heaney, C.D, Myers, K., Wing, S. Hall, D., Baron, D., Stewart, J.R., 2015. Source tracking swine fecal waste in surface water proximal to swine concentrated animal feeding operations. Science of the Total Environment 511, 676-683. doi: 10.1016/j.scitotenv.2014.12.062
Gerard, P., 2014. Metabolism of cholesterol and bile acids by the gut microbiota. Pathogens 3, 14–24. doi:10.3390/pathogens3010014
Gourmelon, M., Caprais, M.P., Mieszkin, S., Marti, R., Wery, N., Jardé, E., Derrien, M., Jadas-Hecart, A., Communal, P.Y., Jaffrezic, A., Pourcher, A.M., 2010. Development of microbial and chemical MST tools to identify the origin of the faecal pollution in bathing and shellfish harvesting waters in France. Water Research 44, 4812–4824. doi: 10.1016/j.watres.2010.07.061
Jeanneau, L., Jardé, E., Gruau, G., 2011. Influence of salinity and natural organic matter on the solid phase extraction of sterols and stanols: Application to the determination of the human sterol fingerprint in aqueous matrices. Journal of Chromatography A, 1218, 2513– 2520. doi : 10.1016/j.chroma.2011.02.066
Jeanneau, L., Solecki, O., Wéry, N., Jardé, E., Gourmelon, M., Communal, P-Y., Jadas-Hécart, A., Caprais, M-P., Gruau G., Pourcher A-M., 2012. Relative decay of fecal indicator bacteria and human-associated markers: a microcosm study simulating wastewater input into seawater and freshwater. Environmental Science and Technology 46, 2375–2382. doi : 10.1021/es203019y
Le Guyader, F.S., Atmar, R.L., Maalouf, H., Le Pendu, J., 2013. Shellfish contamination by norovirus: strain selection based on ligand expression? Clinical virology 41, 3–18.
Leeming, R., Ball, A., Ashbolt, N., Nichols, P., 1996. Using faecal sterols from humans and animals to distinguish faecal pollution in receiving waters. Water Research 30, 2893–2900. doi: 10.1016/S0043-1354(96)00011-5
Liang, L., Goh, S.G., Vergara, G.G., Fang, H.M., Rezaeinejad, S., Chang, S.Y., Bayen, S., Lee, W.A., Sobsey, M.D., Rose, J.B., Gin, K.Y., 2015. Alternative fecal Indicators and their empirical relationships with enteric viruses, Salmonella enterica, and Pseudomonas
aeruginosa in surface waters of a tropical urban catchment. Applied and Environmental
Microbiology 81, 850–860. doi: 10.1128/AEM.02670-14
Mauffret, A., Caprais, M.P., Gourmelon, M., 2012. Relevance of Bacteroidales and F-Specific RNA bacteriophages for efficient fecal contamination tracking at the level of a catchment in France. Applied and Environmental Microbiology 78, 5143–5152. doi: 10.1128/AEM.00315-12
McLellan, S.L., Hollis, E.J., Depas, M.M., Van Dyke, M., Harris, J., Scopel, C.O., 2007. Distribution and fate of Escherichia coli in Lake Michigan following contamination with urban stormwater and combined sewer overflows. Journal of Great Lakes Research 33, 566–580. doi: 10.3394/0380-1330(2007)33[566:DAFOEC]2.0.CO;2
20
Mieszkin, S., Furet, J.P., Corthier, G., Gourmelon, M., 2009. Estimation of pig fecal contamination in a river catchment by real-time PCR using two pig-specific Bacteroidales 16S rRNA genetic markers. Applied and Environmental Microbiology 75, 3045-3054. doi: 10.1128/AEM.02343-08
Mieszkin, S., Yala, J.F., Joubrel, R., Gourmelon, M., 2010. Phylogenetic analysis of Bacteroidales 16S rRNA gene sequences from human and animal effluents and assessment of ruminant faecal pollution by real-time PCR. Journal of Applied Microbiology 108, 974-984. doi: 10.1111/j.1365-2672.2009.04499.x.
Mieszkin, S., Caprais, M.P., Le Mennec, C., Le Goff, M., Edge, T., Gourmelon, M., 2013. Identification of the origin of fecal contamination in shellfish and environmental waters from a French estuary using Bacteroidales markers and F-specific RNA bacteriophages. Journal of Applied Microbiology, 115, 897-907. doi: 10.1111/jam.12260
Moatar, F., Abbott, B.W., Minaudo, C., Curie, F., and Pinay, G., 2017. Elemental properties, hydrology, and biology interact to shape concentration-discharge curves for carbon, nutrients, sediment, and major ions. Water Resources Research 53, 1270-1287. doi:10.1002/2016WR019635.
Muirhead, R.W., Collins, R.P., Bremer, P.J., 2005. Erosion and subsequent transport state of
Escherichia coli from cowpats. Applied and Environmental Microbiology 71, 2875-2879. doi:
10.1128/AEM.71.6.2875-2879.2005
Muirhead, R.W., Monogan, R.M., 2012. A two-reservoir model to predict Escherichia coli losses to water from pastures grazed by dairy cows. Environmental International 40, 8-14. doi : 10.1016/j.envint.2011.11.009
Ohad, S., Vaizel-Ohayon, D., Rom, M., Guttman, J., Berger, D., Kravitz, V., Pilo, S., Huberman, Z., Kashi, Y., Rorman, E., 2015. Microbial source tracking in adjacent karst springs. Applied Environmental Microbiology 81. 5037-5047. doi:10.1128/AEM.00855-15. Pommepuy, M., Hervio-Heath, D., Caprais, M.P., Gourmelon, M., Le Saux, J.C., Le Guyader, S., 2005. Fecal contamination in coastal areas: An engineering approach. In: Oceans and health pathogens in the marine environment, Edited by Belkin S., Colwell R.R., Springer, New York, USA, 331-359.
Patris, T., Perenne, N., 2011. Plage de Pen an Traon, Commune de Guipavas, Finistère, Profil des eaux de baignade, Brest métropole océane, décembre 2011. 102p.
Raith, M.R., Kelty, C.A., Griffith, J.F., Schriewer, A., Wuertz, S., Mieszkin, S., Gourmelon, M., Reischer, G., Farnleitner, A.H., Ervin, J., Holden, P., Jay, J.A., Boehm, A.B., Rose, J.B., Meijer, W.G., Sivaganesan, M., Shanks, O.C., 2013. Comparison of PCR-based assays for the characterization of ruminant and cattle fecal pollution. Water Research 47, 6921-6928. doi.org/10.1016/j.watres.2013.03.061
Regulation (EC) #854/2004 of the European parliament and of the council of 29 April 2004 laying down specific rules for the organization of official controls on products of animal origin intended for human consumption.
Rusinol, M., Moriarty, E., Lin, S., Bofill-Mas, S., Gilpin, B., 2016. Human-, ovine-, bovine-specific viral source tracking tools to discriminate between the major fecal sources in agricultural waters. Food and Environmental Virology, 8, 34-45. doi: 10.1007/s12560-015-9223-3
21
Seurinck, S., Verstraete, W., Siciliano, S.D., 2005. Microbial source tracking for identification of fecal pollution. Reviews in environmental science and bio/technology, 4, 19-37. doi: 10.1007/s11157-005-4997-7
Sidhu, J.P.S., Ahmed, W., Gernjak, W., Aryal, R., McCarthy, D., Palmer, A., Kolotelo, P., Toze, S., 2013. Sewage pollution in urban stormwater runoff as evident from the widespread presence of multiple microbial and chemical source tracking markers. Science of The Total Environment 463–464, 488–496. doi : 10.1016/j.scitotenv.2013.06.020
Solecki, O., Jeanneau, L., Jardé, E., Gourmelon, M., Marin, C., Pourcher, A-M., 2011. Persistence of microbial and chemical pig manure markers as compared to faecal indicator bacteria survival in freshwater and seawater microcosms. Water Research, 45, 4623–4633. doi : 10.1016/j.watres.2011.06.012
Soller, J.A., Schoen, M.E., Bartrand, T., Ravenscroft, J.E., Ashbolt, N.J., 2010. Estimated human health risks from exposure to recreational waters impacted by human and non-human sources of faecal contamination. Water Research 44, 4674–4691. doi: 10.1016/j.watres.2010.06.049
Tran, N.H., Gin, K.Y.H., Ngo, H.H., 2015. Fecal pollution source tracking toolbox for identification, evaluation and characterization of fecal contamination in receiving urban surface waters and groundwater. Science of The Total Environment 538, 38-57. doi: 10.1016/j.scitotenv.2015.07.155
Villemur, R., Imbeau, M. Vuong, M.N., Masson, L. Payment, P., 2015. An environmental survey of surface waters using mitochondrial DNA from human, bovine and porcine origin as fecal source tracking markers. Water Research 69, 143-153. doi: 10.1016/j.watres.2014.10.063
22
Figure 1. Location of the sampling catchments, sampling points and catchment
characteristics at each catchment; (a) Justiçou (catchment J), (b) Pen an Traon
(catchment P) and (c) La Fresnaye (catchment F).
N 25 km J1 J2 J3 J4 J5 500 m 500 km P1 P2 P3 P4 P5 500 m F1 F2 F3 F4 F5 4 km
c
a
b
23
Figure 2. Box plots of E. coli (top) and enterococci (bottom) at the three catchments.
Values below the LQ were not considered. The concentrations are expressed in log
10MPN/100 ml.
At each catchment independently, significant difference were tested using pairwise
non-parametric Kruskal-Wallis test. Different letters denote significant differences and
same letters denote no significant difference.
E n te ro c o c c i F1 F2 F3 F4 F5 P1 P2 P3 P4 P5 1 2 3 4 5 6 1 2 3 4 5 6 J1 J2 J3 J4 J5 1 2 3 4 5 6 a,b b b b a a,b a b a,b a
a a,b a,b a,b b
J catchment P catchment F catchment
J catchment P catchment F catchment
1 2 3 4 5 6 E . c o li 1 2 3 4 5 6 P1 P2 J1 J2 J3 J4 J5 P3 P4 P5 F1 F2 F3 F4 F5 a b c b,c b,c a,b a a a a a a,b b 1 2 3 4 5 6 b a
24
Figure 3. Frequency of detection (in %) of porcine (light grey), bovine (dark) and
human (dark grey) associated-markers in the three catchments. The number in
parentheses below the sampling point represents the number of sample size.
0 20 40 60 80 100 F1 (n=21) (n=19) F2 F3 (n=17) (n=15) F4 F5 (n=14) Fre qu e nc y of de te c tio n F catchment 0 20 40 60 80 100 J1 (n=12) (n=3) J2 J3 (n=12) (n=12) J4 J5 (n=11) Fre qu e nc y of de te c tio n J catchment 0 20 40 60 80 100 P1 (n=7) (n=3) P2 P3 (n=12) (n=4) P4 P5 (n=6) Fre qu e nc y of de c te tio n P catchment
25
Figure 4. Boxplot of the E. coli concentration (log
10MPN/100 ml) according to the
rainfall intensity (1-day rainfall, in mm) in the three catchments.
Cumulative 1 day rainfall (mm)
2 3 4 5 6 E. c o li > 10 2 3 4 5 6
J catchment P catchment F catchment
< 10 0 0 < 10 > 10 2 3 4 5 6 > 10 < 10 0
26
Figure 5. Rainfall effect on the sources of fecal contamination (in frequency of
detection -%) in the three catchments (human markers in dark grey, bovine markers
in black and porcine markers in light grey). Numbers in parentheses represent the
sample size.
F re q u e n c y o f d e te c ti o nCumulative 1 day rainfall (mm)
(25) (46) (15)
(28) (9) (13) (17) (7) (8)
J catchment P catchment F catchment
0 20 40 60 80 100 0 < 10 ≥10 0 20 40 60 80 100 0 < 10 ≥10 0 20 40 60 80 100 0 < 10 ≥10
27
Table 1. Rainfall and microbial data at the J, P and F catchments. Data below the limit of
quantification were not considered.
J catchment
P catchment
F catchment
n
amea
n
min
bmax
cn
amea
n
min
bmax
cn
amea
n
min
bmax
cE. coli
log
10MPN/100
mL
60
3.5
1.6
5.8
5
5
2.8
1.2
4.8
11
7
3.0
1.2
5.3
Enterococci
log
10MPN/100
mL
53
3.0
1.6
6.4
4
2
2.5
1.2
4.5
98
2.4
1.2
4.8
HF 183
log
10copies/100
mL
46
4.8
3.0
6.9
1
8
4.3
3.0
6.0
44
3.6
2.4
6.0
Rum2Bac
log
10copies/100
mL
12
3.6
2.6
4.7
2
3
4.5
3.0
5.3
90
3.6
2.0
6.7
Pig2Bac
log
10copies/100
mL
2
3.1
3.1
3.1
2
3.3
2.9
3.6
36
3.1
1.8
4.8
Stanols
d(µg/L)
57 0.73
0.03
3.85
4
2
0.82 0.07
17.9
8
74
4.37 0.08
71.8
9
1-day rainfall
(mm)
25 16.3
0.2
45.8
2
5
16.3
0.2
45.8
70
5.6
0.2
20.2
anumber of individual for each parameter, bminimum value, cmaximum value, dStanols correspond to the sum ofthe concentrations of the six stanols used in the principal component analysis model.
View publication stats View publication stats