Publisher’s version / Version de l'éditeur:
Langmuir, 29, 51, pp. 15907-15918, 2013-12-05
READ THESE TERMS AND CONDITIONS CAREFULLY BEFORE USING THIS WEBSITE.
https://nrc-publications.canada.ca/eng/copyright
Vous avez des questions? Nous pouvons vous aider. Pour communiquer directement avec un auteur, consultez la première page de la revue dans laquelle son article a été publié afin de trouver ses coordonnées. Si vous n’arrivez pas à les repérer, communiquez avec nous à [email protected].
Questions? Contact the NRC Publications Archive team at
[email protected]. If you wish to email the authors directly, please see the first page of the publication for their contact information.
NRC Publications Archive
Archives des publications du CNRC
This publication could be one of several versions: author’s original, accepted manuscript or the publisher’s version. / La version de cette publication peut être l’une des suivantes : la version prépublication de l’auteur, la version acceptée du manuscrit ou la version de l’éditeur.
For the publisher’s version, please access the DOI link below./ Pour consulter la version de l’éditeur, utilisez le lien DOI ci-dessous.
https://doi.org/10.1021/la403585v
Access and use of this website and the material on it are subject to the Terms and Conditions set forth at
Changes in order parameters associated with ceramide-mediated
membrane reorganization measured using pTIRFM
Carter Ramirez, Daniel M.; Jakubek, Zygmunt J.; Lu, Zhengfang; Ogilvie,
William W.; Johnston, Linda J.
https://publications-cnrc.canada.ca/fra/droits
L’accès à ce site Web et l’utilisation de son contenu sont assujettis aux conditions présentées dans le site LISEZ CES CONDITIONS ATTENTIVEMENT AVANT D’UTILISER CE SITE WEB.
NRC Publications Record / Notice d'Archives des publications de CNRC:
https://nrc-publications.canada.ca/eng/view/object/?id=dced12ac-6d2a-41b8-b690-d52b31cb330c https://publications-cnrc.canada.ca/fra/voir/objet/?id=dced12ac-6d2a-41b8-b690-d52b31cb330cChanges in Order Parameters Associated with Ceramide-Mediated
Membrane Reorganization Measured Using pTIRFM
Daniel M. Carter Ramirez,
†,‡Zygmunt J. Jakubek,
†Zhengfang Lu,
†William W. Ogilvie,
‡and Linda J. Johnston*
,†,‡†
Measurement Science and Standards, National Research Council of Canada, Ottawa, Ontario K1A 0R6, Canada ‡
Department of Chemistry, University of Ottawa, Ottawa, Ontario K1N 6N5, Canada
*
S Supporting InformationABSTRACT: The enzymatic generation of ceramide has significant effects on the biophysical properties of lipid bilayers and can lead to the extensive reorganization of cell membranes. We have synthesized and characterized a headgroup-labeled fluorescent lipid probe (NBD-ceramide, NBD-Cer) and demonstrated that it can be used for polarized total internal reflection fluorescence microscopy experiments to probe changes in membrane order that result from ceramide incorporation. NBD-Cer measures significantly higher order parameters for the liquid-ordered (Lo) domains (⟨P2⟩= 0.40 ±
0.03) than for the liquid-disordered phase (Ld, fluid, ⟨P2⟩ = 0.22 ± 0.02) of phase-separated bilayers prepared from egg
sphingomyelin, dioleolyphosphatidylcholine, and cholesterol mixtures. The probe also responds to changes in packing induced by the direct incorporation of ceramide or the variation in the ionic strength of the aqueous medium. Order parameter maps obtained after enzyme treatment of bilayers with coexisting Loand Ldphases show two distinct types of behavior. In regions of
high enzyme activity, the initial Lo/Lddomains are replaced by large, dark features that have high membrane order corroborating
previous hypotheses that these are ceramide-enriched regions of the membrane. In areas of low enzyme activity, the size and shape of the Lodomains are conserved, but there is an increase in the order parameter for the initial Ldphase (⟨P2⟩= 0.30 ±
0.01). This is attributed to the incorporation of ceramide in the Lodomains with the concomitant expulsion of cholesterol into
the surrounding fluid phase, increasing its order parameter.
■
INTRODUCTIONSupported lipid bilayers have been widely used as models to understand the organization of cell membranes and to probe lipid−peptide and lipid−protein interactions.1−3 Their utility stems in part from their ease of fabrication, their applicability to a wide range of lipids and biomolecules, and their suitability for characterization using a variety of surface-sensitive methods. Fluorescence imaging has been one of the most widely employed methods for characterizing supported bilayers because of its high sensitivity and temporal resolution and the availability of many different labeling strategies and environment-sensitive fluorescent probes. In addition, there are frequently advantages to combining fluorescence with other spectroscopy and microscopy tools to obtain complementary information. Integrating atomic force and fluorescence microscopy on a single instrument is a particularly useful approach because it combines the high spatial resolution of scanning probe methods with the flexibility, sensitivity, and specific labeling possibilities afforded by fluorescence-based techniques. Such correlated imaging approaches have provided considerable insight into the lipid−lipid and lipid−protein interactions that determine the organization of phase-separated supported lipid bilayers.4−12
Combinations of atomic force microscopy (AFM) and fluorescence imaging have been employed to investigate the reorganization that results from the incorporation of ceramide (Cer) in supported membranes, either by direct incorporation or by in situ enzymatic generation.9,10,12−16These studies have been motivated by the importance of Cer in regulating cell signaling processes and apoptosis. Ceramides are among the most hydrophobic lipids and have pronounced effects on the physical properties of membranes, promoting phase separation, nonlamellar phases, and membrane permeability.17−19 The enzymatic generation of Cer by the hydrolysis of sphingomyelin is believed to cause the coalescence of small ordered membrane domains to give larger signaling platforms, thus providing a mechanism to aggregate membrane receptors and enhance the signaling efficiency.20,21
We have examined the consequences of Cer incorporation into supported membranes prepared from ternary lipid mixtures that have coexisting liquid-disordered (Ld) and
liquid-ordered (Lo) phases.10,12,13,22,23The direct incorporation
of Cer leads to the formation of a new Cer-rich ordered phase
Received: September 19, 2013 Revised: December 4, 2013 Published: December 5, 2013
that is localized in small subdomains within the original ordered domains. The enzymatic generation of Cer also produces Cer-enriched islands but leads to a larger-scale reorganization that includes the clustering of domains, the formation of fluid-phase areas that are devoid of domains, and the formation of membrane defects. Correlated AFM and fluorescence imaging with a custom-designed NBD-labeled cholesterol (Chol) probe provided further information on the complex bilayer restructur-ing induced by the enzymatic generation of Cer.10 Enzyme treatment resulted in the rapid growth of large patches with lower fluorescence intensity than for either the Loor Ldphases
that were assigned to Chol-depleted and Cer-enriched regions of the membrane.
Although the correlated imaging approach has provided considerable insight into the effects of Cer on membrane properties, it does not yield information on the membrane order and the orientation of individual molecules within the reorganized bilayer. The orientation of molecules in supported membranes can be assessed by sum frequency generation vibrational spectroscopy,24 although its sensitivity is limited, and the lateral mobility of fluorescent probes in membranes can be measured by fluorescence correlation spectroscopy (FCS).25 In addition to the widespread use of fluorescence anisotropy to investigate the rotational mobility of molecules in lipid bilayers, fluorescence polarization anisotropy imaging has yielded information on membrane order and fluorophore orientation for phase-separated supported bilayers5,6,26−28 and cellular membranes.29,30Polarized total internal reflection fluorescence microscopy (pTIRFM) records fluorescence images as a function of the polarization of the excitation laser and yields order parameters that can be used to calculate the time and ensemble-averaged orientation of the fluorophore absorption dipoles.5,6,26 Similarly, the average orientation of fluorophores in supported membranes can be obtained by measuring the orientation of a large number of single molecules by defocused pTIRFM.31,32 Although pTIRFM provides information that is analogous to order parameters measured by methods such as NMR, FTIR, and X-ray scattering,33−38it is important to note that different techniques report on different aspects of membrane order.
In this work, we have used pTIRFM with a new nitrobenzoxadiazole (NBD)-labeled Cer probe to investigate changes in membrane order that occur as a result of the Cer-induced reorganization of phase-separated lipid bilayers. The results confirm that the headgroup-labeled probe is a sensitive reporter of changes in membrane order. Furthermore, we demonstrate that enzyme-mediated membrane restructuring yields large Cer-enriched features that are more ordered than either of the two coexisting phases in the initial bilayer.
■
MATERIALS AND METHODSMaterials. Egg yolk phosphocholine (EPC), 1,2-dioleoyl-sn-glycero-3-phosphocholine (DOPC), 1,2-dipalmitoyl-sn-glycero-3-phosphocholine (DPPC), egg sphingomyelin (ESM), N-palmitoyl-D
-erythro-sphingomyelin (C16:0 sphingomyelin, PSM), N-palmitoyl-D
-erythro-sphingosine (C16:0ceramide, C16 Cer), and cholesterol were
purchased from Avanti Polar Lipids (Alabaster, AL) and used without further purification. The ammonium salt of 1,2-dipalmitoyl-sn-glycero-3-phosphoethanolamine-N-(7-nitro-2-1,3-benzoxadiazol-4-yl) (NBD-DHPE) was also obtained from Avanti Polar Lipids. 2-(4,4-Difluoro- 5,7-dimethyl-4-bora-3a,4a-diaza-s-indacene-3-pentanoyl)-1-hexadeca-noyl-sn-glycero-3-phosphocholine (BODIPY-PC) was acquired from Molecular Probes (Eugene, OR). ((E,2S,3R)-3-Hydroxy-2-
(palmitamido)octadec-4-enyl)-4-(4-nitrobenzo-2-oxa-1,3-diazol-7-ylamino)butylcarbamate (NBD-Cer) was synthesized as described in the Supporting Information. The sodium salt of fluorescein, sphingomyelinase (SMase) isolated from S. aureus, and all salts and synthesis reagents were purchased from Sigma-Aldrich (St. Louis, MO). Optical adhesive 88 was obtained from Norland Products (Cranbury, NJ) and used to glue freshly cleaved mica (grade V-1, Ted Pella, Redding, CA) onto cover glass (Fisher Scientific, Hampton, NH). All aqueous solutions were prepared using 18.3 MΩ cm deionized water. SMase buffer (125 mM NaCl, 10 mM CaCl2, 2 mM
MgCl2, 10 mM 4-(2-hydroxyethyl)piperazine-1-ethanesulfonic acid
(HEPES), pH 7.4) was used for some imaging and SMase experiments. All buffered solutions were passed through a 0.22 μm filter (Millipore, Billerica, MA) before being used. Organic solvents used to prepare lipid films were HPLC grade from EMD Chemicals (Philadelphia, PA).
Preparation of Vesicles and Supported Lipid Bilayers.Small unilamellar vesicles (SUVs) were prepared as previously described subject to some minor modifications.10The required amounts of lipids
and NBD-Cer were dissolved in chloroform, methanol, ethanol, or mixtures thereof. After these solutions were mixed in the appropriate proportions, the solvent was evaporated and the lipid films were dried under vacuum. The lipid films were then hydrated in water and sonicated at 60 °C in a bath sonicator to clarity to form SUVs with a final lipid concentration of 1.0 mg/mL for spectroscopic experiments or 0.5 mg/mL for supported bilayer experiments. Lipid films were stored for up to 1 week at −20 °C prior to use; however, fresh vesicles were prepared on the day of each experiment.
Planar supported bilayers were formed on mica via vesicle fusion. Freshly cleaved mica disks (15−25-μm-thick for fluorescence imaging) were glued onto circular cover glasses. To prepare bilayers of DOPC/ ESM/Chol or DPPC/ESM/Chol stained with NBD-Cer, 950 μL of 8 mM CaCl2was first added to a mica/glass slide clamped in a liquid cell
and warmed to 45 °C. A 0.5 mg/mL vesicle suspension (50 μL) was then introduced at the same temperature, and the samples were incubated for 15 min before being gradually cooled to 22 °C over a period of 2 h. Bilayers were gently washed with water or buffer to remove adsorbed vesicles before imaging.
pTIRFM/AFM Imaging. Rationale.Polarized light can be used to determine the orientational order of membrane components because fluorophore excitation is dependent on the reporter’s molecular orientation with respect to the exciting light polarization.5,26In TIRF microscopy, fluorophores are excited by an evanescent field generated by the total internal reflection of the illuminating light at the substrate/ water interface. Because the polarization state of the evanescent field depends, among other factors, on the polarization of the illuminating beam, the orientational order of fluorophores embedded in a supported membrane can be probed by measuring the intensity of fluorescence as a function of the illuminating beam polarization angle ψ. Fluorescent molecules are excited most efficiently when the electric field of the evanescent wave is aligned with their absorption dipole moments. Fluorophores oriented at different tilt angles relative to the substrate normal θcwill therefore be preferentially excited at different
polarization angles. The probe tilt angle can range from 0° for a fluorophore oriented along the substrate normal (the reference z axis) to 90° for an absorption dipole lying parallel to the substrate.
For problems with uniaxial symmetry, such as in the present experiment, the steady-state fluorescence intensity, F(ψ), as a function of the polarization angle, ψ, is given by
ψ = + ψ− ψ
F( ) 1 B(cos2 cos2 0) (1)
where ψ0(equal to either 0 or 90°) is the experimentally determined
polarization angle at which F(ψ) is a maximum. The parameter B depends on the polarization state of the evanescent field and the distribution of fluorophore orientations in the detection volume and, assuming higher-order parameter ⟨P4⟩ = 0, is related to order
parameter ⟨P2⟩by
ψ = − + + ⟨ ⟩ + − − ⟨ ⟩ + − + + ⟨ ⟩ + − B I I I P I I I I P I I I P I I I ( ) (2 ) (1 ) cos ( ) (2 ) z y x z y x y z y x z y x 2 2 2 0 2 (2) where Ix, Iy, and Izare the intensity directional components of the
evanescent field, which depend on the relative index of refraction of the TIR interface and angle of incidence of the illuminating beam. Orientational order parameter ⟨P2⟩ can be expressed in terms of
fluorescence-detected dichroic ratio RFD, which is experimentally measured on a pixel-by-pixel basis from pTIRFM images of the sample
⟨ ⟩ = − + − − P I R I I I R I 2I x y z x y z 2 FD FD (3) = R F F FD p s (4)
where Fpand Fsare the fluorescence intensities obtained with p- and
s-polarized illuminating beams, respectively. As such, ⟨P2⟩is a time- and
ensemble-averaged quantity but is independent of the fluorophore concentration and various instrumental factors.5 The relationship between the order parameter ⟨P2⟩ and the tilt angle ⟨θc⟩ of the
fluorophore’s absorption dipole with respect to the membrane normal (z axis) is given by the following expression
θ
⟨ ⟩ =P 1 ⟨ ⟩ − 2(3[cos ] 1)
2 2 c (5)
For a planar solid-supported membrane, the possible tilt angles ⟨θc⟩
range from 0 to 90°, meaning that ⟨P2⟩values of −0.5 to 1.0 can be
calculated from pTIRFM images. An isotropic or randomly oriented distribution of molecules will yield ⟨P2⟩ = 0, whereas absorption
dipoles randomly oriented perpendicular (parallel) to the membrane normal correspond to a ⟨P2⟩ value of −0.5 (1.0), respectively. In
practice, intermediate values, which indicate intermediate tilt angles, are typically observed.
Instrumentation. The pTIRFM and correlated pTIRFM-AFM experiments were performed at room temperature (∼22 °C) on the same integrated imaging system. The system consisted of a NanoWizard II BioAFM (JPK Instruments, Berlin, Germany) mounted on an IX81 inverted optical microscope (Olympus Corporation, Tokyo, Japan) with an objective-based (PLAN-APO N 60× objective, 1.45 NA; Olympus) total internal reflection fluorescence setup. The system was enclosed in an acoustic isolation box fabricated in-house and seated on a Micro 60 active vibration isolation table (Halcyonics/Accurion GmbH, Goettingen, Germany). A polarization-maintaining fiber-coupled 488 nm Ar ion laser (CVI Melles Griot, Albuquerque, NM) was used for excitation, and fluorescence was filtered through an FF01-536/40 emission filter (Semrock, Rochester, NY). All fluorescent images were captured using a Cascade 512B EMCCD camera (512 pixels × 512 pixels, 16 μm × 16 μm pixel size; Photometrics, Tucson, AZ). A manually operated micrometer screw was used to focus the illuminating laser beam on the objective back focal plane. A second micrometer screw allowed the radial translation of the laser beam from the center of the objective aperture (polarized epifluorescence mode) toward its edge in order to achieve TIR (TIRFM mode). For an initial evaluation of the effects of laser polarization, images were recorded using standard TIRF illumination, being nearly the same as the p-polarized pTIRF illumination, and axial epifluorescence illumination mimicking the s-polarized pTIRF illumination. For pTIRFM measurements, a half inch zero-order half-wave plate (Thorlabs, Newton, NJ) mounted in a manually operated rotation mount was installed in the filter slot under the microscope objective to control the polarization angle, ψ, of the incident laser beam. The rotational angle of the half-wave plate and thus the polarization angle, ψ, could be set with ±1° precision. The instrument calibration procedure is provided in the Supporting Information and Figures S1 and S2.
Image Acquisition.The pTIRFM and pTIRFM-AFM experiments were performed as follows: a sample region of interest (ROI) was
brought into focus, and images with s- and p-polarized illuminating beams were successively acquired. The camera gain was set to 0 for all images, and the acquisition time and excitation intensity were optimized to maximize the signal-to-noise ratio and minimize sample bleaching. Following the first pTIRFM image set acquisition, 30 μm × 30 μm AFM scans were obtained as required in the central area of the ROI. All AFM images were captured using uncoated silicon nitride DNP-S-10 (Veeco, Camarillo, CA) cantilevers with a typical spring constant of 0.12 N/m. Contact mode topographic images were collected at scan rates of 0.7−1 Hz, and continuous adjustments to the set point kept the force exerted on the sample at a minimum. Scans were collected at a 512 pixel × 512 pixel size, and the line was fitted with first- to third-order polynomials when necessary. The second pTIRFM image set acquisition was performed in the ROI after AFM imaging to monitor the sample for scan-related morphological changes. Once the required images had been obtained, fine-nosed tweezers were used to create a defect in the ROI by removing the lipid bilayer. The final set of s- and p-polarization excited pTIRFM images was obtained in this area using the same acquisition parameters as for sets 1 and 2. These images were used to determine a localized background correction for the images of sets 1 and 2.
Image Analysis and Order Parameter Determination. All pTIRFM image processing and analysis was done using National Institutes of Health ImageJ (http://rsb.info.nih.gov/ij), which is in the public domain. Each pTIRFM image from sets 1 and 2 was background corrected by subtracting a local background average value measured in the defect area of the corresponding s- and p-polarization excited images of the final pTIRFM set. Order parameters were then calculated from the background-corrected pTIRFM images using an ImageJ macro provided by Drs. John Oreopoulos and Christopher M. Yip (University of Toronto, Canada). The macro accepts the angle of incidence of the excitation laser beam (α), the indexes of refraction of the medium (n1) and substrate (n2), and the
p-and s-polarization excited pTIRFM images as input. For these experiments, we used α = 60°, n1= 1.3326 (water), and n2= 1.5750
(mica). The macro calculates the pixel-by-pixel dichroic ratio, RFD, (eq
4) using the p- and s-polarization excited images, converts the ratio into order parameter values ⟨P2⟩, and creates an order parameter
image of the ROI. Order parameters were analyzed using the ImageJ built-in measure and histogram functions. The analysis of pTIRFM images was restricted to the central areas of the ROIs (typically 30 μm ×30 μm) where the TIRF illumination had its peak intensity, was most homogeneous, and was free of interference patterns. Within each ROI, 10−15 sampling areas were selected within each ⟨P2⟩
environment (i.e., Ld and Lo phases). The average order parameter
values for each ROI were obtained by averaging the single pixel values first within each selection and then over all 10−15 sampling areas of each phase. The size of the sampling area varied with the size of the features; for example, for Lodomain squares with side lengths of 3−5
pixels (1 pixel = 267 nm) were selected. Unless otherwise stated, the reported ⟨P2⟩values are further averaged over a minimum of three
ROIs from each of three independently prepared bilayers.
Several studies have shown that the NBD fluorophore photo-bleaches rapidly in aerated solutions.39We assessed the bleaching rate
of NBD-Cer in supported bilayers upon 488 nm excitation in TIR mode by first irradiating a small ROI through a reduced iris aperture and then acquiring an image of the entire area with the iris fully open for several acquisition conditions. We determined that with the optimized excitation and detection conditions used in the present experiments the loss in fluorescence intensity due to bleaching was less than 5% between two sequential exposures. For two back-to-back sets of s- and p-polarization excited pTIRFM images in a given ROI, the maximum (systematic) error in ⟨P2⟩ values resulting from bleaching
did not exceed 0.019 for the range of ⟨P2⟩ values measured in this
work. Therefore, we concluded that NBD bleaching had a negligible effect on the order parameter determination in the pTIRFM experiments reported here using the dichroic ratio method.
SMase Treatments and Correlated pTIRFM/AFM Imaging. Supported lipid bilayers of DOPC/ESM/Chol stained with NBD-Cer were formed as described above. Prior to pTIRFM image acquisition,
the samples were gently rinsed with SMase buffer for 2 min and allowed to stand for 20−30 min in the dark. pTIRFM and AFM images were then sequentially acquired in an ROI. SMase in buffer (final concentration in the cell was 0.2 U/mL) was then pipetted into the solution above the bilayer. Changes in the membrane were monitored by fluorescence until rapid micrometer-scale lateral reorganization had ceased, typically 15−20 min following enzyme addition. At this point, pTIRFM and AFM images were sequentially acquired with the enzyme in situ.
■
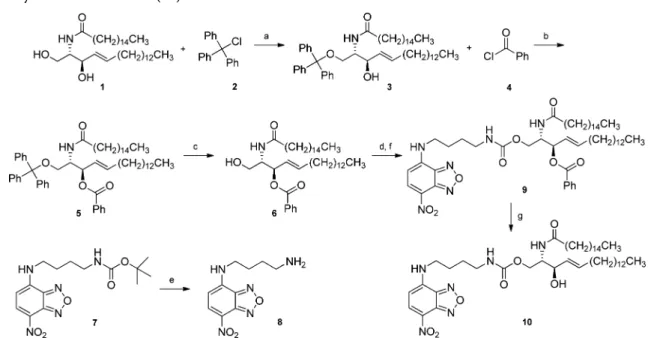
RESULTSSynthesis and Spectroscopic Characterization of NBD-Ceramide. NBD-Cer was synthesized from commer-cially sourced N-palmitoyl-D-erythro-sphingosine (C16 Cer) 1
as described in Scheme 1 (details in Supporting Information). Selective protection of the C1hydroxyl moiety of 1 with trityl
chloride 2 in the presence of N,N-diisopropylethylamine (DIPEA) gave 1-trityl ceramide 3 in 65% yield. The C3
hydroxyl group was then masked as a benzoate ester upon reaction with benzoyl chloride 4 in the presence of triethyl-amine (Et3N) and 4-dimethylaminopyridine (DMAP) to afford
5. Lewis acid-mediated methanolysis of the C1trityl group was
achieved with boron trifluoride diethyl etherate (BF3·Et2O) to
give 3-benzoyl ceramide 6 in 70% yield. The unprotected primary hydroxyl group of 6 was then treated with
carbon-yldiimidazole (CDI) to activate it for a subsequent coupling reaction. The amine coupling partner, 8, was prepared by the deprotection of tert-butyl 4-(4-nitrobenzo-2-oxa-1,3-diazol-7-ylamino)butylcarbamate 7 in neat trifluoroacetic acid (TFA). Carbamate 9 was formed in 38% yield from the reaction of the amine and CDI-activated alcohol in the presence of Et3N.
Hydrolysis of the C3 benzoate ester with LiOH afforded
((E,2S,3R)-3-hydroxy-2-(palmitamido)octadec-4-enyl)-4-(4-ni-trobenzo-2-oxa-1,3-diazol-7-ylamino)butyl carbamate (NBD-Cer, 10) in an overall yield of 10% from 1.
The spectroscopic properties of NBD-Cer were measured in SUVs prepared from EPC, DOPC/Chol (2:1 molar ratio), and PSM/Chol (5:4 molar ratio). These two mixtures were chosen to model the Ldand Lophases on the basis of a literature phase
diagram for ternary mixtures of DOPC/PSM/Chol.40 Absorp-tion and emission wavelengths and fluorescence quantum yields and lifetimes are summarized in Table S1 and compared to data for a commercially available headgroup-labeled lipid probe, NBD-DHPE, in EPC SUVs. The long-wavelength absorption band due to the NBD charge-transfer band was at 468 ± 2 nm with emission ranging from 525 to 535 nm. The slight blue shift in the emission spectrum for the Lophase is consistent with
literature data for DHPE and several other NBD-lipids.10,41 Quantum yields for NBD-Cer were similar to Scheme 1. Synthesis of NBD-Cer (10)a
a(a) DIPEA, CH
2Cl2, rt, 2 days, 65%. (b) Et3N, DMAP, CH2Cl2, 12 h, 92%. (c) BF3Et2O, toluene/MeOH, rt, 2 h, 70%. (d) CDI, toluene, rt, 1 h.
(e) TFA, 0.5 h, rt. (f) 8, Et3N, CH2Cl212 h, rt, 38%. (g) LiOH, THF/MeOH/H20, 1 h, 60%.
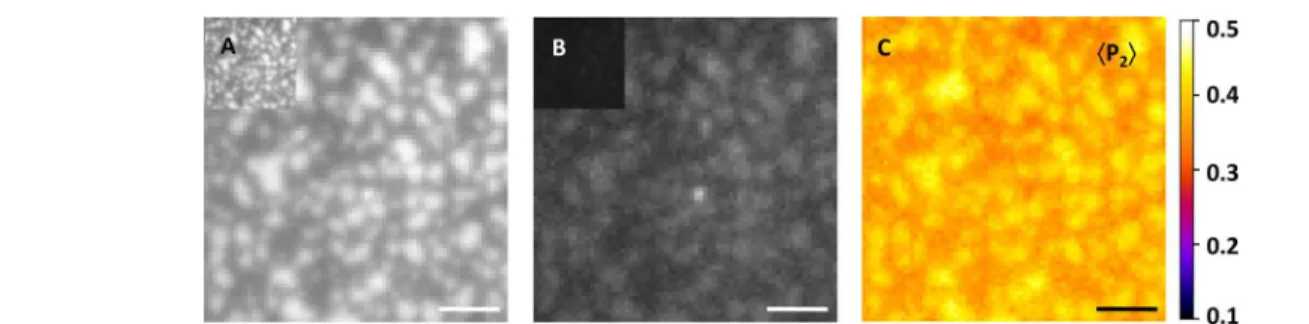
Figure 1.pTIRFM imaging of the orientational order parameter ⟨P2⟩distribution for 0.5 mol % NBD-Cer in a DOPC/ESM/Chol bilayer (2:2:1
molar ratio). Images were recorded with (A) p-polarized and (B) s-polarized illumination; the corner insets are displayed on the same intensity scale. (C) Order parameter ⟨P2⟩image of the same region. Scale bar = 5 μm.
those for NBD-DHPE in EPC and were unaffected by changes in lipid order. However, the fluorescence lifetime of NBD-Cer increased significantly in PSM/Chol (11.1 ns) compared to that in EPC (7.5 ns). The spectroscopic data suggest that the NBD fluorophore occupies a similar environment when attached to either the headgroup of phosphatidylethanolamine or the C1
-hydroxyl group of Cer via a short hydrophilic linker.
Probing Orientational Order in Phase-Separated Model Membranes. Our examination of NBD-Cer as a probe for measuring membrane order by pTIRFM was prompted by the observation of an inversion of contrast between domains and the fluid phase when phase-separated bilayers were imaged in epifluorescence and TIRF modes. We incorporated 0.5 mol % NBD-Cer into a mixture of DOPC/ ESM/Chol in a molar ratio of 2:2:1 and prepared mica-supported bilayers by vesicle fusion. This ternary lipid mixture exhibits ESM- and Chol-rich Lomicrodomains within a bulk Ld
phase (Figures 1 and S4). When visualized in TIRF mode, the domains were bright relative to the surrounding membrane (Figure S4A). However, a striking inversion of the relative fluorescence intensity of the two phases (Figure S4B, dark domains) was observed in axially illuminated epifluorescence images. Although a headgroup-labeled Cer probe has not been studied before, Cer probes with an NBD fluorophore attached to the N-acyl chain have been used in two earlier studies to visualize coexisting Lo and Ld phases in GUVs by confocal
microscopy. In both cases, the probe had similar fluorescence intensity in the two phases.42,43 A similar acyl-chain-labeled Bodipy-Cer probe showed stronger fluorescence in the Ld
phase.44
The polarization dependence of the NBD-Cer fluorescence intensity in DOPC/ESM/Chol supported bilayers was assessed by pTIRFM. Images acquired upon excitation with p-polarized light (Figure 1A) were similar to those observed in TIRF mode (bright domains) whereas those obtained with s-polarized excitation showed inverted fluorescence contrast as well as a lower overall fluorescence intensity in both lipid phases (Figure 1B). Orientational order parameter ⟨P2⟩ maps (Figure 1C)
were generated from s- and p-polarization excited images acquired in several representative regions of interest (ROI). The order-parameter images exhibited two ⟨P2⟩ populations
corresponding to the Ldand Lophases (Table 1). For images
obtained in water, we measured ⟨P2⟩ = 0.22 ± 0.02 with a
corresponding ⟨θc⟩= 46.1 ± 0.7° for the Ldphase. For the Lo
domains, the corresponding ⟨P2⟩and ⟨θc⟩values were 0.40 ±
0.03 and 39.3 ± 1.0°, respectively. A correlated pTIRFM-AFM imaging experiment (Figure S5) confirmed that the higher ⟨P2⟩
regions corresponded to the taller LoESM- and Chol-enriched
phase. The ⟨θc⟩ values for NBD-Cer report the mean
orientation of the fluorophore’s absorption dipole moment with respect to the membrane normal (Figure 2). The
absorption dipole moment for NBD fluorophores is tilted by 9.5° relative to the C7−N bond.45In the all-trans conformation for the headgroup-labeled NBD-Cer probe in a planar supported bilayer, we anticipate that the dipole should be oriented at a small angle with respect to the membrane normal. The larger angle measured for the Ldphase with respect to the
Lo phase indicates a less upright average dipole orientation,
which is consistent with looser packing or increased disorder in the Ldphase.
We compared the order parameters obtained using NBD-Cer to those measured with BODIPY-PC, an acyl-chain-labeled probe (Figure 2) previously used by Oreopoulos and Yip to measure order parameters in phase-separated model mem-branes.5 Fluorescence polarization microscopy measurements Table 1. Orientational Order Parameter ⟨P2⟩and Fluorophore Absorption Dipole Tilt Angles ⟨θc⟩Measured by pTIRFM in
Phase-Separated Supported Lipid Membranesa
Lo Ld
lipid composition probe ⟨P2⟩ ⟨θc⟩,° ⟨P2⟩ ⟨θc⟩,°
DOPC/ESM/Chol 2:2:1 NBD-Cer 0.40 ± 0.03 39.3 ± 1.0 0.22 ± 0.02 46.1 ± 0.7 2:2:1 BODIPY-PC 0.28 ± 0.03 43.9 ± 1.0 0.20 ± 0.02 46.8 ± 0.6 2:2:1b NBD-Cer 0.35 ± 0.02 41.1 ± 0.7 0.22 ± 0.02 46.3 ± 0.6 2:2:1c NBD-Cer 0.36 ± 0.01 41.0 ± 0.3 0.30 ± 0.01 43.0 ± 0.2 DOPC/DPPC/Chol 2:2:1 NBD-Cer 0.43 ± 0.01 38.0 ± 0.5 0.33 ± 0.02 42.1 ± 0.6 DOPC/ESM/Chol/C16Cer 8:6:4:2 NBD-Cer 0.36 ± 0.02 40.6 ± 0.7 0.26 ± 0.02 44.8 ± 0.7
aAll measurements were performed in deionized water unless otherwise stated.bBilayers imaged in SMase buffer: 125 mM NaCl, 10 mM CaCl
2, 2
mM MgCl2, 10 mM HEPES, pH 7.4.cBilayer in buffer treated with SMase for 21 min to generate ceramide from ESM; these data are obtained from
the sample shown in Figures 6 and S7.
Figure 2.Fluorescent lipid probes used in this pTIRFM study. (A) NBD-Cer and (B) BODIPY-PC. The probes’ absorption dipole moments are indicated with the double-headed red arrows. Order parameter ⟨P2⟩ measurements from pTIRFM report on the dipoles’
orientation (θc) with respect to the membrane/substrate normal.
in GUVs and supported bilayers suggest that the BODIPY chromophore is oriented vertically and thus largely parallel to the membrane normal. We incorporated 0.5 mol %
BODIPY-PC in DOBODIPY-PC/ESM/Chol bilayers and recorded pTIRFM images in several ROIs (Figure 3). These bilayers did not show phase contrast inversion when the polarization of the excitation
Figure 3.pTIRFM imaging of the orientational order parameter ⟨P2⟩distribution for BODIPY-PC in a DOPC/ESM/Chol bilayer (2:2:1 molar
ratio). Images recorded with (A) p-polarized and (B) s-polarized illumination are displayed on the same intensity scale. (C) Order parameter ⟨P2⟩
image of the same region. Scale bar = 5 μm.
Figure 4.pTIRFM imaging of the orientational order parameter ⟨P2⟩distribution for 0.5 mol % NBD-Cer in a DOPC/DPPC/Chol bilayer (2:2:1
molar ratio). Images were recorded with (A) p-polarized and (B) s-polarized illumination; the inset images are displayed on the same intensity scale. (C) Order parameter ⟨P2⟩image of the same region. Scale bar = 4 μm.
Figure 5.Time-dependent morphological changes in a DOPC/ESM/Chol supported bilayer (2:2:1 molar ratio with 0.5 mol % NBD-Cer) and treated with SMase (0.2 U/mL) in buffer (pH 7.4). The fluorescence images in this time course were captured in TIRF mode: (A) before and (B) 3, (C) 6, (D) 12, (E) 21, and (F) 58 min after enzyme addition. The corner insets are displayed on the same intensity scale. Prior to Cer generation, the Lodomains are brighter than the surrounding Ldphase (A). The contrast between the domains and bulk membrane decreased (B) and gradually
reversed (C, D, see also the domains circled in red). Dark domains (C−F, examples marked with arrows) appeared within seconds of enzyme addition and continued to expand at a slower rate over the course of the experiment. Scale bar = 8 μm.
beam was changed. The Lo domains were consistently dark
with respect to the Ldphase, although images obtained using
p-polarized excitation had a higher fluorescence intensity than those obtained with s-polarized excitation. Calculated ⟨P2⟩and
⟨θc⟩values of 0.20 ± 0.02 and 46.8 ± 0.6°, respectively, for the
Ld phase were very similar to those obtained with NBD-Cer
(Table 1). For the Lo phase, however, ⟨P2⟩and ⟨θc⟩ differed
significantly at 0.28 ± 0.03 and 43.9 ± 1.0°, respectively. The greater difference in ⟨P2⟩for the Ldand Lophases with
NBD-Cer suggested that this probe may be more sensitive for measuring small-order parameter changes in lipid mixtures.
NBD-Cer was also incorporated into model membranes of a second phase-separated lipid mixture: DOPC/DPPC/Chol in a molar ratio of 2:2:1. In these bilayers, the Lo domains were
brighter than the surrounding Ld phase in both s- and
p-polarization excited pTIRFM images (Figure 4). For this ternary lipid mixture, ⟨P2⟩and ⟨θc⟩were calculated to be 0.33
±0.02 and 42.1 ± 0.6°, respectively, for the Ldphase (Table 1). The Lodomains presented ⟨P2⟩and ⟨θc⟩values of 0.43 ± 0.1
and 38.0 ± 0.5°, respectively. The ⟨P2⟩obtained for NBD-Cer
in both phases indicated that the probe was oriented at smaller angles with respect to the membrane normal than in the analogous lipid phases in the DOPC/ESM/Chol bilayers. Furthermore, as is apparent in Figure 4C, the difference in orientational order ⟨P2⟩ between the two environments was
significantly decreased for these DPPC-containing membranes. Ceramide Induces Changes in Membrane Order. NBD-Cer was used to examine Cer-mediated changes in supported membranes using two different methods of introducing Cer: direct incorporation of C16 Cer in the SUVs
used to prepare supported bilayers and enzymatic treatment of ESM-containing bilayers with sphingomyelinase (SMase). pTIRFM images of DOPC/ESM/Chol/C16 Cer bilayers in a
molar ratio of 8:6:4:2 containing 0.5 mol % NBD-Cer (Figure S6) exhibited round micrometer-scale domains surrounded by the bulk Ldphase, similar to the morphology of DOPC/ESM/
Chol bilayers, and with a much lower intensity for s-polarized
excitation compared to that for p-polarized excitation. However, in contrast to results for the ternary lipid mixture, the raftlike domains were dark relative to the bulk membrane in both p- and s-polarization excited images for the C16
Cer-containing bilayers (Figure S6A). Order parameter maps for this mixture (Figure S6C) exhibited reduced contrast between the two lipid phases, consistent with a decreased difference in the mean orientation of NBD-Cer in the two environments with respect to the ternary mixture lacking Cer. This is illustrated by ⟨P2⟩and ⟨θc⟩values of 0.36 ± 0.02 and 40.6 ±
0.7° and 0.26 ± 0.02 and 44.8 ± 0.7° for the Loand Ldphases,
respectively (Table 1).
The effects of in situ Cer generation were examined by recording SMase-mediated morphological changes in DOPC/ ESM/Chol bilayers stained with NBD-Cer. Figure 5 gives a typical example of the time-dependent membrane reorganiza-tion observed in these SMase-treated bilayers. The images were acquired in TIRF mode, which, as mentioned above, is similar to p-polarization excited pTIRFM. Therefore, prior to enzyme addition (Figure 5A) the Lodomains were brighter than the Ld
phase with contrast qualitatively similar to that observed in p-polarization excited pTIRFM images (Figure 1A). SMase (0.2 U/mL) was then introduced into the solution above the bilayer, and pTIRFM images were acquired 3, 6, 12, 21, and 58 min postaddition. A gradual inversion of the fluorescence contrast between the Lo and Ld phases was observed over four time
points (Figure 5B−E) such that the initially bright domains appeared dark after approximately 20 min; see areas outlined in red in Figure 5A,D. Along with this striking visual effect, we observed the disappearance of several clusters of Lo domains
and the concomitant formation of several dark patches (identified with blue arrows in Figure 5). These dark features appeared within seconds of adding the enzyme and grew very rapidly to the sizes observed in Figure 5B. Although they increased in size only slightly in the time required for the original domains to darken (Figure 5B−E), they expanded considerably in the subsequent 25 min (Figure 5F). The Lo
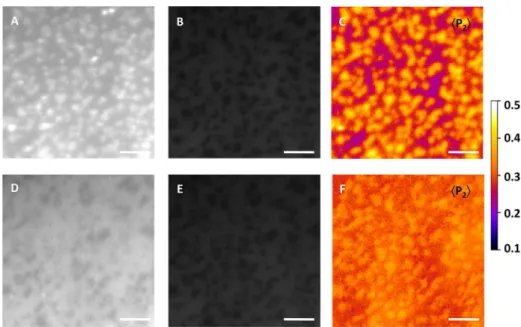
Figure 6.Changes in membrane order resulting from the SMase-mediated reorganization of DOPC/ESM/Chol bilayers (2:2:1 molar ratio) stained with 0.5 mol % NBD-Cer were quantified using pTIRFM. The membranes were first imaged in SMase buffer (pH 7.4). Images obtained with (A) p-polarized and (B) s-p-polarized excitation are displayed on the same intensity scale. (C) ⟨P2⟩image of the same region. Following 21 min of treatment
with SMase (0.2 U/mL), the ROI was reimaged (D, E) to reveal the contrast reversal between the two lipid phases with p-polarized excitation (D) and a significant increase in order for the Ldphase (F). Scale bar = 5 μm.
domains proximal to these dark patches were the first to darken. Thus, the inversion of contrast throughout the sample appeared to progress outward from the patches forming radial patterns (Figure 5B,C). As the sample continued to evolve, “rings” of the bright Ld phase grew in around the patches
(Figure 5E).
The membrane morphology at selected time points after enzyme restructuring of the bilayers was examined by pTIRFM. Because SMase treatments require a high-ionic-strength HEPES buffer to optimize the enzyme’s activity, we first tested the effect of this buffer on the order parameters. Bilayers of DOPC/ESM/Chol with 0.5 mol % NBD-Cer were washed with buffer and equilibrated for about 20 min prior to recording pTIRFM images (Figure 6A−C, Table 1). We obtained ⟨P2⟩
and ⟨θc⟩values of 0.22 ± 0.02 and 46.3 ± 0.6°, respectively, for
the Ld phase and 0.35 ± 0.02 and 41.1 ± 0.9° for the Lo
domains. The ⟨P2⟩values for both phases decreased compared
to those measured in water, although the difference is greater than one standard deviation only in the Lophase. The decrease
in ⟨P2⟩for the Lophase translates to an increase of about 2° in
the average angle between the NBD transition dipole and the membrane normal, consistent with a slight disordering effect. The increased ionic strength of the medium may alter the hydration of the membrane or the packing of the lipid headgroups to account for this observation.
Figures 6 and S7 compare pTIRFM and order parameter images for two regions of a DOPC/ESM/Chol bilayer before and 21 min after the addition of SMase. The areas selected display the two types of behavior that is typically observed after enzyme treatment. In Figure 6, the membrane domains were
well conserved in size and shape after enzyme treatment, and no other indications of morphological changes were evident from the s-polarization excited pTIRFM image. However, a comparison of the p-polarization excited images recorded prior to SMase treatment and at the 21 min mark showed a change in the fluorescence contrast between the domains and the surrounding membrane (Figure 6A,D). Prior to Cer generation in the bilayer, the Lodomains were brighter than the Ldphase
but were darker 21 min after enzyme addition. The absolute intensity for the Ldphase in the p-polarization excited images
also increased following Cer generation.
Order parameters for NBD-Cer calculated from these pTIRFM images confirmed the SMase-dependent changes in membrane structure (Figure 6C,F, Table 1). Reduced contrast between the lipid phases in the post-SMase ⟨P2⟩ image
indicated that there was a smaller difference in lipid packing between the two phases than there had been in the untreated bilayer. This observation was primarily due to a change in order of the DOPC-rich phase for which ⟨P2⟩increased from 0.22 ±
0.02 to 0.30 ± 0.01 with a corresponding decrease in ⟨θc⟩of
about 3°. Conversely, ⟨P2⟩ for the domains did not change
significantly with calculated values of 0.35 ± 0.02 and 0.36 ± 0.01 before and after SMase treatment, respectively. We confirmed that photobleaching of NBD-Cer did not affect the measured ⟨P2⟩values.
Figure S7 shows a second ROI for the bilayer shown in Figure 6. Although the domains on the right side of the image are similar before and after SMase treatment, a large dark feature has replaced the domains on the left side of the image. This is typical of the behavior shown in Figure 5 where enzyme
Figure 7.Dark features generated from SMase activity in DOPC/ESM/Chol bilayers (2:2:1 molar ratio with 0.5% NBD-Cer) vary considerably in their size and shape. (A, B) Images recorded with p- and s-polarized excitation, respectively. The order parameter image (C) and cross section (D) show ⟨P2⟩values that are higher than those for either the Ldor Lophase. Scale bar = 5 μm.
treatment gave rise to heterogeneous, irregularly shaped features that had considerably lower fluorescence intensity than either the domains or the bulk membrane. The dark feature (Figure S7) has high ⟨P2⟩values and is surrounded by
what appears to be a new area of the Ldphase based on the low
⟨P2⟩values. A second example of a particularly large and
well-defined dark feature surrounded by a less-ordered, bright ring is shown in Figure 7. These large, irregularly shaped features typically had maximum ⟨P2⟩values ranging from ∼0.40 to 0.50
depending on the size of the feature. The regions with the highest ⟨P2⟩values corresponded to small areas within the large
dark features (Figure 7).
A previous fluorescence study in GUVs reported that an N-acyl chain labeled NBD-Cer was excluded from Cer gel-phase domains.42 It should be noted that for the experiments described here the fluorescence intensities for NBD-Cer 10 in the large, dark features formed after treatment with SMase are significantly above the background level, consistent with some partitioning of the probe into this Cer-enriched phase. However, the images obtained with different polarizations of the excitation beam clearly illustrate that intensity changes do not provide even qualitative information on the relative amount of probe in the two phases for NBD-Cer in these mixtures.
Our previous studies of DOPC/ESM/Chol supported bilayers containing Texas red DHPE had characterized large dye-depleted patches that formed during enzyme-mediated reorganization,12,13similar to the results shown in Figures 5 and 7 using the NBD-Cer probe. A fluorescent Chol probe was used to identify these features as Chol-depleted regions of the membrane.10 Correlated fluorescence and AFM experiments with both probes indicated that the dark features were taller than the bulk membrane, but were not as tall as the Cer-rich domains formed in direct incorporation experiments. Corre-lated pTIRFM-AFM experiments performed on SMase-treated bilayers incorporating NBD-Cer (Figure S8) confirmed that the dark, high ⟨P2⟩ features observed with this probe also
corresponded to regions of intermediate height in the AFM images. The correlated pTIRFM-AFM images of the SMase-treated bilayer reveal subdomain-level features (Figure S8). In the AFM scan, tall, fencelike perimeters encircle some of the domains, all on a length scale of a few hundred nanometers. Some of this detail can also be resolved in the p- and s-polarization excited fluorescence images, where the centers of the largest domains are brighter than their peripheries. However, this heterogeneity is not readily apparent in the ⟨P2⟩image of the same area that is calculated on a pixel-by-pixel
basis using the ratio of p- to s-polarization excited fluorescence intensities (eq 4).
■
DISCUSSIONNBD-Cer as a Probe for Measuring Orientational Order in Lipid Membranes.Order parameter measurements based on pTIRFM experiments with the NBD-Cer probe indicate that this probe is sensitive to the changes in order between Loand Ldphases in supported bilayers prepared from
ternary lipid mixtures. For the DOPC/ESM/Chol and DOPC/ DPPC/Chol bilayers (Table 1), the data follow a similar trend with ⟨P2⟩and ⟨θc⟩values for the Ldphases that are consistent
with a more disordered environment than that of the Lo
domains. The all-trans conformation of NBD-Cer (Figure 2) is predicted to orient the NBD transition dipole almost perpendicular to the plane of the bilayer. Therefore, we expect
to see greater ⟨P2⟩and smaller ⟨θc⟩values for the more highly
ordered Lolipid phase, as is in fact the case.
The measured ⟨P2⟩ value of 0.40 ± 0.03 for the DOPC/
ESM/Chol mixture in water is significantly higher than that for the Ldphase (0.22 ± 0.02). There is a modest reduction in the
order parameter (0.35 ± 0.02) for the Lophase in buffer but no
change for the Ldphase, suggesting that the order of the lipid
headgroup region is more sensitive to ionic strength in the Lo
phase. In addition to modest effects of buffer, ⟨P2⟩is modified
by the addition of Cer to DOPC/ESM/Chol bilayers. The small reduction in order parameter for the Lo phase may be
explained on the basis of the localization of Cer predominantly in the ordered domains with the concomitant expulsion of Chol into the fluid phase, resulting in an increase in ⟨P2⟩for the latter
phase. These results are consistent with the complex partitioning behavior of Cer, Chol, and SM that has been observed in lipid vesicles.46,47For DOPC/DPPC/Chol bilayers labeled with NBD-Cer, we have measured a ⟨P2⟩value of 0.33
±0.02 for the Ldphase, which is considerably higher than that
obtained for the analogous ESM-containing membranes (Table 1). Phase diagrams for this ternary lipid mixture indicate that the Ld phase of this DPPC-containing mixture is more
Chol-rich than the Ld phase in the ESM-containing mixture.35
Although increased order in the Lophase due to a higher Chol
concentration could explain the change in order parameter, there may also be effects due to the change in headgroup structure and acyl chain length for DPPC and ESM.
⟨P2⟩measurements using the BODIPY-PC probe in DOPC/
ESM/Chol bilayers also indicate increased disorder for the Ld
phase with respect to the Lodomains. Although the two probes
have similar ⟨P2⟩ values for the Ld phase, NBD-Cer gives a
substantially larger ⟨P2⟩ than BODIPY-PC (0.40 vs 0.28) for
the Lophase. Thus, the NBD probe that senses changes in the
organization of the headgroup region of the membrane appears to be more sensitive to changes in order than the acyl chain labeled BODIPY-PC, at least for this particular lipid mixture. It has been concluded from fluorescence polarization studies in both GUVs and supported membranes that the BODIPY fluorophore is situated in the hydrophobic interior of the membrane with its transition dipole approximately aligned with the bilayer normal.5,48 However, several acyl-chain-labeled BODIPY PCs have been reported to adopt two conformations in supported monolayers and bilayers, one in which the fluorophore is aligned with the acyl chains and one in which the fluorophore loops back to interact with the polar head-groups.31,32 For example, Dunn and co-workers have used single-molecule fluorescence to show that there are approx-imately equal amounts of the two orientations for a chain-labeled BODIPY-PC in DPPC bilayers and that the fraction of probes aligned parallel to the acyl chains increases with increasing Chol content.32 It is possible that a mixture of conformations for BODIPY-PC contributes to the lower ⟨P2⟩
values obtained for the Lophase of DOPC/ESM/Chol bilayers
with this probe.
Oreopoulos and Yip have measured the order parameter for supported membranes of DOPC/DSPC in molar ratios of 1/1 with 30 mol % Chol with the BODIPY-PC probe.5 They reported ⟨P2⟩values of 0.22 ± 0.03 for the Ldphase and 0.30 ±
0.02 for the Lodomains, values that are substantially lower than
those obtained with the NBD-Cer probe (Table 1) for DOPC/ DPPC/Chol mixtures but similar to those measured for DOPC/ESM/Chol. The combination of results for several different mixtures with the headgroup-labeled NBD-Cer probe
and the acyl-chain-labeled BODIPY probe indicate that relatively small changes in the acyl chain length, headgroup structure, and probe locations all have measurable impacts on the measured order parameters. The same study investigated the effects of Chol concentration on the order parameter of DOPC/DSPC bilayers.5The order parameter of the Lophase
increased when Chol increased from 5 to 15 mol % but then decreased again at 30 mol % Chol. Although these unusual effects were hypothesized to be due to changes in the number of coexisting membrane phases, it is also possible that a combination of acyl-chain-aligned and looping conformations plays a role, as suggested above.
Order parameters have been measured for ternary lipid mixtures with coexisting liquid phases using other model membranes and other methods. The order parameters (0.4 and 0.22 for the Lo and Ld phases, respectively) measured by
polarized fluorescence microscopy in DOPC/ESM/Chol GUVs using a Bodipy-Chol probe28are in remarkably good agreement with the results obtained here for NBD-Cer in supported bilayers prepared from this lipid mixture (Table 1). A similar trend with order parameters for the Lo phase that are
approximately 2 times larger than those for the Ldphase has
been observed by NMR for vesicle suspensions and by wide-angle X-ray scattering for oriented lipid bilayers.33,35,36,38Order parameters from the X-ray method were roughly 30% higher than those obtained by NMR. The two methods report on different aspects of membrane order, with NMR studies providing the molecular order of the deuterated acyl chain methylenes whereas X-ray scattering averages data over all scatterers in the sample. However, both NMR and X-ray data demonstrate a significant increase in the order parameter when Chol is added to either DPPC or DOPC.37
Changes in Membrane Order Parameters for SMase-Treated Bilayers. Combinations of fluorescence imaging/ spectroscopy and AFM have been used previously to investigate changes in membrane morphology induced by SMase activity and other lipid−protein interactions.9,10,12−16AFM allows one to map the membrane topography and properties with the high spatial resolution necessary to visualize nanometer-scale features. However, there are limitations associated with using AFM to monitor the restructuring of SMase-treated bilayers. First, the relatively long acquisition times make it difficult to capture the initial rapid changes induced by SMase addition. Second, AFM tips rapidly become contaminated when imaging enzyme-treated bilayers, and the scanning action of the tip can redistribute bound enzyme molecules or mechanically damage the bilayer. Scanning with a minimum applied force, working with dilute SMase solutions, and washing out the enzyme prior to imaging can attenuate but not completely eliminate these effects. Fluorescence microscopy provides higher temporal resolution than AFM and can resolve rapid (second to minute) changes in membrane structure due to enzyme activity but affords limited information about the local membrane proper-ties or composition of specific phases. We have used pTIRFM to monitor the SMase-mediated reorganization of NBD-Cer-labeled bilayers to address this limitation and to further our understanding of the complex morphology resulting from the enzymatic generation of Cer.
The pTIRFM images recorded using NBD-Cer provide evidence for changes in the lipid composition and properties induced by SMase treatment of DOPC/ESM/Chol bilayers. The order parameter maps provide additional insight into the two main types of behavior observed during the
enzyme-mediated restructuring of the bilayer. The most obvious change induced by enzyme is the rapid appearance and growth of large features that are darker than either the initial Lodomains or the
fluid phase and that are surrounded by rings of a uniform, disordered phase. AFM data obtained in the present work and in our earlier correlated AFM-fluorescence imaging study12 demonstrated that these dark features have a thickness that is intermediate between that of the domains and fluid phase and exhibit high contrast in lateral deflection scans. On the basis of the order parameter maps, these regions are more highly ordered than any of the regions of the initial bilayer prior to enzyme treatment, which corroborates our earlier conclusion that they are Cer-enriched domains or platforms. Previous kinetic studies of enzyme restructuring using fluorescence microscopy indicated that the size of the dark patches correlated with the number of active enzymes per unit area of the bilayer, consistent with extensive membrane restructur-ing in regions with high enzyme activity.12
In addition to bilayer regions that undergo extensive reorganization to give large, dark features, there are areas that are less affected by enzyme treatment. Order parameter maps demonstrate that the difference in order between the Loand Ld
phases in these areas has decreased significantly as a result of enzyme treatment, even though the original domains are well conserved in size and shape. This change is almost entirely due to an increase in order of the fluid phase surrounding the original domains, for which ⟨P2⟩ increased from 0.22 to 0.30.
Previous AFM studies have demonstrated that enzyme activity leads to heterogeneous domains that have small Cer-enriched domains around their periphery.12,49Therefore, we hypothesize that the change in the order parameter for the regions surrounding the domains is due to the ejection of Chol from the domains in response to the generation of Cer and the formation of an ordered SM-Cer phase within the domains.46,47 The SM-Cer-enriched domains appear to have similar lipid order to the original Lodomains. However, it should be noted
that the resolution available in our pTIRFM experiments is insufficient to observe domain heterogeneity associated with the Cer-enriched domains. An alternate explanation for the increased order of the Ld phase may be that SMase activity
generates Cer from small concentrations of ESM that localize in the fluid phase, thus increasing its order parameter. However, we believe that to be less likely on the basis of the observation of Cer-enriched subdomains within the Lophase.
The time-lapse experiment described in Figure 5 suggests that the reversal in Lo/Ldfluorescence contrast observed in the
p-polarized fluorescence images (Figures 6 and S7) and the increase in ⟨P2⟩for NBD-Cer in the Ldphase take place within
the first 20 min of SMase treatment. This time scale reflects the slow production of Cer in areas of low enzyme activity; this means that it takes a longer time for the generation of a sufficient Cer concentration to displace Chol from Lddomains
and increase the orientational order of NBD-Cer in the Ld
phase. By contrast, the initial appearance of the dark features is very rapid, reflecting the high concentration of active enzyme molecules and the rapid disappearance of domains with the formation of a new Cer-rich and Chol-poor phase.
In summary, a novel NBD-Cer probe has been synthesized and characterized and has been shown to be useful for measuring order parameters of lipid membranes using pTIRFM. The headgroup-labeled probe has similar sensitivity to previously used acyl-chain-labeled probes, which are complicated by the presence of multiple orientations with the
fluorophore in either the hydrophobic acyl chain region or the polar headgroup region of the membrane. The NBD-Cer probe has been used to examine the changes in the order parameter that occur upon enzymatic generation of Cer in phase-separated lipid bilayers. The polarized fluorescence measure-ments provide information that is complementary to that obtained by correlated fluorescence and atomic force microscopies for the complex bilayer morphologies that result from enzyme-mediated restructuring.
■
ASSOCIATED CONTENT*
S Supporting InformationExperimental details for the synthesis and spectroscopic characterization of NBD-Cer and eight additional figures documenting pTIRFM calibrations and measurements on supported bilayers. This material is available free of charge via the Internet at http://pubs.acs.org/.
■
AUTHOR INFORMATIONCorresponding Author
*E-mail: [email protected].
Notes
The authors declare no competing financial interest.
■
ACKNOWLEDGMENTSWe thank Drs. C. Yip and J. Oreopoulos for providing the ImageJ macro for pTIRFM data analysis. D.M.C.R., W.W.O., and L.J.J. thank the Natural Sciences and Engineering Research Council for support in the form of a postgraduate scholarship and discovery grants.
■
REFERENCES(1) Chan, Y.-H. M.; Boxer, S. G. Model membrane systems and their applications. Curr. Opin. Chem. Biol. 2007, 11, 581−587.
(2) Sackmann, E. Supported membranes: scientific and practical applications. Science 1996, 271, 43−48.
(3) Johnston, L. J. Nanoscale imaging of domains in supported lipid membranes. Langmuir 2007, 23, 5886−5895.
(4) Oreopoulos, J.; Epand, R. F.; Epand, R. M.; Yip, C. M. Peptide-induced domain formation in supported lipid bilayers: direct evidence by combined atomic force and polarized total internal reflection fluorescence microscopy. Biophys. J. 2010, 98, 815−823.
(5) Oreopoulos, J.; Yip, C. M. Probing membrane order and topography in supported lipid bilayers by combined polarized total internal reflection fluorescence-atomic force microscopy. Biophys. J. 2009, 96, 1970−1984.
(6) Oreopoulos, J.; Yip, C. M. Combinatorial microscopy for the study of protein-membrane interactions in supported lipid bilayers: Order parameter measurements by combined polarized TIRFM/AFM. J. Struct. Biol. 2009, 168, 21−36.
(7) Shaw, J. E.; Epand, R. F.; Epand, R. M.; Li, Z.; Bittman, R.; Yip, C. M. Correlated fluorescence-atomic force microscopy of membrane domains: structure of fluorescence probes determines lipid local-ization. Biophys. J. 2006, 90, 2170−2178.
(8) Chiantia, S.; Kahya, N.; Schwille, P. Raft domain reorganization driven by short- and long-chain ceramide: a combined AFM and FCS study. Langmuir 2007, 23, 7659−7665.
(9) Chiantia, S.; Ries, J.; Kahya, N.; Schwille, P. Combined AFM and two-focus SFCS study of raft-exhibiting model membranes. ChemPhysChem 2006, 7, 2409−2418.
(10) Carter Ramirez, D. M.; Ogilvie, W. W.; Johnston, L. J. NBD cholesterol probes to track cholesterol distribution in model membranes. Biochim. Biophys. Acta 2010, 1798, 558−568.
(11) Coban, O.; Burger, M.; Laliberte, M.; Ianoul, A.; Johnston, L. J. Ganglioside partitioning and aggregation in phase separated
monolayers characterized by GM1-Bodipy monomer/dimer emission. Langmuir 2007, 23, 6704−6711.
(12) Ira; Zou, S.; Carter Ramirez, D. M.; Vanderlip, S.; Ogilvie, W.; Jakubek, Z.; Johnston, L. J. Enzymatic generation of ceramide induces membrane restructuring: correlated AFM and fluorescence imaging of supported bilayers. J. Struct. Biol. 2009, 168, 78−89.
(13) Ira; Johnston, L. J. Sphingomyelinase generation of ceramide promotes clustering of nanoscale domains in supported bilayer membranes. Biochim. Biophys. Acta 2008, 1778, 185−197.
(14) Carrer, D. C.; Kummer, E.; Chwastek, G.; Chiantia, S.; Schwille, P. Asymmetry determines the effects of natural ceramides on model membranes. Soft Matter 2009, 5, 3279−3286.
(15) Chiantia, S.; Ries, J.; Chwastek, G.; Carrer, D.; Li, Z.; Bittman, R.; Schwille, P. Role of ceramide in membrane protein organization investigated by combined AFM and FCS. Biochim. Biophys. Acta 2008, 1778, 1356−1364.
(16) Chao, L.; Gast, A. P.; Hatton, T. A.; Jensen, K. F. Sphingomyelinase-induced phase transformations: causing morphol-ogy switches and multiple time-domain ceramide generation in model raft membranes. Langmuir 2010, 26, 344−356.
(17) Zou, S.; Johnston, L. J. Ceramide-enriched microdomains in planar membranes. Curr. Opin. Colloid Interface Sci. 2010, 15, 489− 498.
(18) Goni, F. M.; Alonso, A. Effects of ceramide and other simple sphingolipids on membrane lateral structure. Biochim. Biophys. Acta 2009, 1788, 169−177.
(19) Lopez-Montero, I.; Monroy, F.; Velez, M.; Devaux, P. F. Ceramide: from lateral segregation to mechanical stress. Biochim. Biophys. Acta 2010, 1798, 1348−1356.
(20) Cremesti, A. E.; Goni, F. M.; Kolesnick, R. Role of sphingomyelinase and ceramide in modulating rafts: do biophysical properties determine biologic outcome? FEBS Lett. 2002, 531, 47−53. (21) Hannun, Y. A.; Obeid, L. M. Many ceramides. J. Biol. Chem. 2011, 286, 27855−27862.
(22) Carter Ramirez, D. M.; Kim, Y. A.; Bittman, R.; Johnston, L. J. Lipid phase separation and protein-ganglioside clustering in supported bilayers are induced by photorelease of ceramide. Soft Matter 2013, 9, 4890−4899.
(23) Carter Ramirez, D. M.; Pitre, S. P.; Kim, Y. A.; Bittman, R.; Johnston, L. J. Photouncaging of ceramides promotes reorganization of liquid-ordered domains in supported lipid bilayers. Langmuir 2013, 29, 3380−3387.
(24) Chen, X.; Chen, Z. SFG studies on interactions between antimicrobial peptides and supported lipid bilayers. Biochim. Biophys. Acta 2006, 1758, 1257−1273.
(25) Machan, R.; Hof, M. Lipid diffusion in planar membranes investigated by fluorescence correlation spectroscopy. Biochim. Biophys. Acta 2010, 1798, 1377−1391.
(26) Thompson, N. L.; McConnell, H. M.; Burghardt, T. P. Order in supported phospholipid monolayers detected by the dichroism of fluorescence excited with polarized evanescent illumination. Biophys. J. 1984, 46, 739−747.
(27) Reeve, J. E.; Corbett, A. D.; Boczarow, I.; Wilson, T.; Bayley, H.; Anderson, H. L. Probing the orientational distribution of dyes in membranes through multiphoton microscopy. Biphys. J. 2012, 103, 907−917.
(28) Ariola, F. S.; Li, Z.; Cornejo, C.; Bittman, R.; Heikal, A. A. Membrane fluidity and lipid order in ternary giant unilamellar vesicles using a new Bodipy-cholesterol derivative. Biophys. J. 2009, 96, 2696− 2708.
(29) Anantharam, A.; Onoa, B.; Edwards, R. H.; Holz, R. W.; Axelrod, D. Localized topological changes of the plasma membrane upon exocytosis visualized by polarized TIRFM. J. Cell Biol. 2010, 188, 415−428.
(30) Kiessling, V.; Domanska, M. K.; Tamm, L. K. Single SNARE-mediated vesicle fusion observed in vitro by polarized TIRFM. Biophys. J. 2010, 99, 4047−4055.
(31) Armendariz, K. P.; Huckabay, H. A.; Livanec, P. W.; Dunn, R. C. Single molecule probes of membrane structure: orientation of
BODIPY probes in DPPC as a function of probe structure. Analyst 2012, 137, 1402−1408.
(32) Livanec, P. W.; Huckabay, H. A.; Dunn, R. C. Exploring the effects of sterols in model lipid membranes using single molecule orientations. J. Phys. Chem. B 2009, 113, 10240−10248.
(33) Davis, J. H.; Clair, J. J.; Juhasz, J. Phase equilibria in DOPC/ DPPC-d62/cholesterol mixtures. Biophys. J. 2009, 96, 521−539.
(34) Lopes, S. C. D. N.; Castanho, M. A. R. B. Overview of common spectroscopic methods to determine the orientation/alignment of membrane probes and drugs in lipidic bilayers. Curr. Org. Chem. 2005, 9, 889−898.
(35) Veatch, S. L.; Polozov, I. V.; Gawrisch, K.; Keller, S. L. Liquid domains in vesicles investigated by NMR and fluorescence microscopy. Biophys. J. 2004, 86, 2910−2922.
(36) Veatch, S. L.; Soubias, O.; Keller, S. L.; Gawrisch, K. Critical fluctuations in domain-forming lipid mixtures. Proc. Natl. Acad. Sci. U.S.A. 2007, 104, 17650−17655.
(37) Mills, T. T.; Toombes, G. E. S.; Tristram-Nagle, S.; Smilgies, D.-M.; Feigenson, G. W.; Nagle, J. F. Order parameters and areas in fluid-phase oriented lipid membranes using wide angle X-ray scattering. Biophys. J. 2008, 95, 669−681.
(38) Mills, T. T.; Tristram-Nagle, S.; Heberle, F. A.; Morales, N. F.; Zhao, J.; Wu, J.; Toombes, G. E. S.; Nagle, J. F.; Feigenson, G. W. Liquid-liquid domains in bilayers detected by wide angle X-ray scattering. Biophys. J. 2008, 95, 682−690.
(39) Pagano, R. E.; Martin, O. C.; Kang, H. C.; Haugland, R. P. A novel fluorescent ceramide analogue for studying membrane traffic in animal cells: accumulation at the golgi apparatus results in altered spectral properties of the sphingolipid precursor. J. Cell Biol. 1991, 113, 1267−1279.
(40) Veatch, S. L.; Keller, S. L. Miscibility phase diagrams of giant vesicles containing sphingomyelin. Phys. Rev. Lett. 2005, 94, 148101− 148101−-148104.
(41) Mazeres, S.; Schram, V.; Tocanne, J.-F.; Lopez, A. 7-Nitrobenz-2-oxa-1,3-diazole-4-yl-labeled phospholipids in lipid membranes: differences in fluorescence behavior. Biophys. J. 1996, 71, 327−335.
(42) Sot, J.; Ibarguren, M.; Busto, J. V.; Montes, L. R.; Goni, F. M.; Alonso, A. Cholesterol displacement by ceramide in sphingomyelin-containing liquid-ordered domains, and generation of gel regions in giant lipidic vesicles. FEBS Lett. 2008, 582, 3230−3236.
(43) Sengupta, P.; Hammond, A.; Holowka, D.; Baird, B. Structural determinants for partitioning of lipids and proteins between coexisting fluid phases in giant plasma membrane vesicles. Biochim. Biophys. Acta 2008, 1778, 20−32.
(44) Baumgart, T.; Hunt, G.; Farkas, E. R.; Webb, W. W.; Feigenson, G. W. Fluorescence probe partitioning between Lo/Ld phases in lipid membranes. Biochim. Biophys. Acta 2007, 1768, 2182−2194.
(45) Paprica, P. A.; Baird, N. C.; Petersen, N. O. Theoretical and experimental analyses of optical transitions of nitrobenzoxadiazole (NBD) derivatives. J. Photochem. Photobiol. 1993, 70, 51−57.
(46) Castro, B. M.; de Almeida, R. F. M.; Silva, L. C.; Fedorov, A.; Prieto, M. Formation of ceramide/sphingomyelin gel domains in the presence of an unsaturated phospholipid: a quantitative multiprobe approach. Biophys. J. 2007, 93, 1639−1650.
(47) Castro, B. M.; Silva, L. C.; Fedorov, A.; de Almeida, R. F. M.; Prieto, M. Cholesterol-rich fluid membranes solubilize ceramide domains. Implications for the structure and dynamics of mammalian intracellular and plasma membranes. J. Biol. Chem. 2009, 284, 22978− 22987.
(48) Ariola, F. S.; Mudaliar, D. J.; Walvick, R. P.; Heikal, A. A. Dynamics imaging of lipid phases and lipid-marker interactions in model biomembranes. Phys. Chem. Chem. Phys. 2006, 8, 4517−4529. (49) Johnston, I.; Johnston, L. J. Ceramide promotes restructuring of model raft membranes. Langmuir 2006, 22, 11284−11289.


![[PDF] Fonctions et formules Excel 2019 pdf avancées | Cours Excel](data:image/gif;base64,R0lGODlhAQABAIAAAP///wAAACH5BAEAAAAALAAAAAABAAEAAAICRAEAOw==)